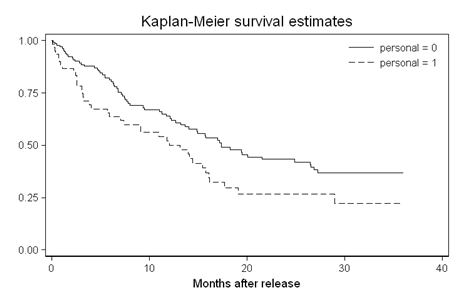
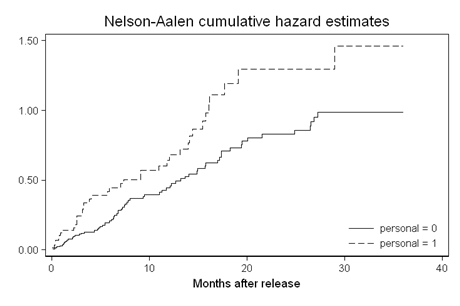
Figure 14.1, page 505.
use https://stats.idre.ucla.edu/stat/stata/examples/alda/data/rearrest, clear
gen event = ~censor
stset months, failure(event)
sts graph, by(personal) xtitle("Months after release") ///
legend(ring(0) pos(2)) ylabel(,nogrid)
 sts graph, cumh by(personal) xtitle("Months after release") ///
legend(ring(0) pos(5)) ylabel(,nogrid)
sts graph, cumh by(personal) xtitle("Months after release") ///
legend(ring(0) pos(5)) ylabel(,nogrid)
 sts graph, haz by(personal) width(8) xtitle("Months after release") ///
legend(ring(0) pos(5)) xlabel(0(6)36) ylabel(,nogrid)
sts graph, haz by(personal) width(8) xtitle("Months after release") ///
legend(ring(0) pos(5)) xlabel(0(6)36) ylabel(,nogrid)
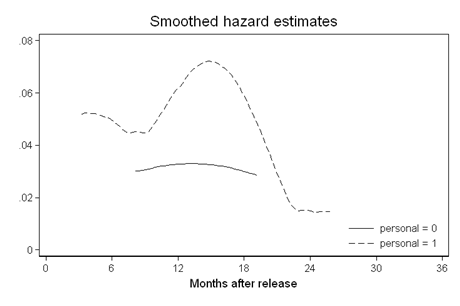
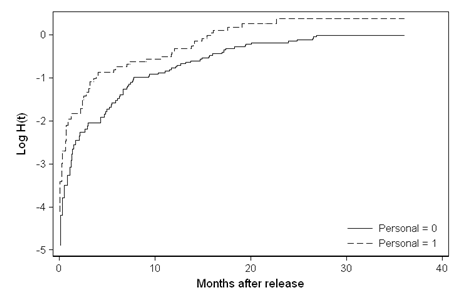
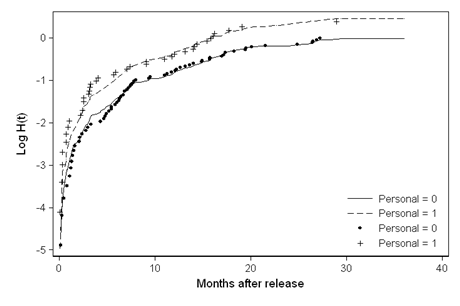
Figure 14.2, page 508.
use https://stats.idre.ucla.edu/stat/stata/examples/alda/data/rearrest, clear
gen event = ~censor
stset months, failure(event)
sts generate na = na, by(personal)
gen logna = log(na)
sort months
twoway (scatter logna months if personal==0, connect(stepstair) lpattern(solid) msize(zero)) ///
(scatter logna months if personal==1, connect(stepstair) lpattern(dash) msize(zero)), ///
legend(ring(0) pos(5) lab(1 "Personal = 0") lab(2 "Personal = 1")) ///
xtitle("Months after release") ytitle("Log H(t)")
 stcox personal, basec(ch0)
gen ch1 = ch0 * 1.613919
gen logch = log(ch0)
replace logch = log(ch1) if personal == 1
sort months
twoway (scatter logch months if personal==0, connect(direct) lpattern(solid) msize(zero)) ///
(scatter logch months if personal==1, connect(direct) lpattern(dash) msize(zero)) ///
(scatter logna months if personal==0 & event == 1, msymbol(o)) ///
(scatter logna months if personal==1 & event == 1, msymbol(+)), ///
legend(ring(0) pos(5) lab(1 "Personal = 0") lab(2 "Personal = 1") ///
lab(3 "Personal = 0") lab(4 "Personal = 1")) ///
xtitle("Months after release") ytitle("Log H(t)")
stcox personal, basec(ch0)
gen ch1 = ch0 * 1.613919
gen logch = log(ch0)
replace logch = log(ch1) if personal == 1
sort months
twoway (scatter logch months if personal==0, connect(direct) lpattern(solid) msize(zero)) ///
(scatter logch months if personal==1, connect(direct) lpattern(dash) msize(zero)) ///
(scatter logna months if personal==0 & event == 1, msymbol(o)) ///
(scatter logna months if personal==1 & event == 1, msymbol(+)), ///
legend(ring(0) pos(5) lab(1 "Personal = 0") lab(2 "Personal = 1") ///
lab(3 "Personal = 0") lab(4 "Personal = 1")) ///
xtitle("Months after release") ytitle("Log H(t)")
 twoway (scatter ch0 months if personal==0, connect(direct) lpattern(solid) msize(zero)) ///
(scatter ch1 months if personal==1, connect(direct) lpattern(dash) msize(zero)) ///
(scatter na months if personal==0 & event == 1, msymbol(o)) ///
(scatter na months if personal==1 & event == 1, msymbol(+)), ///
legend(ring(0) pos(5) lab(1 "Personal = 0") lab(2 "Personal = 1") ///
lab(3 "Personal = 0") lab(4 "Personal = 1")) ///
xtitle("Months after release") ytitle("H(t)")
twoway (scatter ch0 months if personal==0, connect(direct) lpattern(solid) msize(zero)) ///
(scatter ch1 months if personal==1, connect(direct) lpattern(dash) msize(zero)) ///
(scatter na months if personal==0 & event == 1, msymbol(o)) ///
(scatter na months if personal==1 & event == 1, msymbol(+)), ///
legend(ring(0) pos(5) lab(1 "Personal = 0") lab(2 "Personal = 1") ///
lab(3 "Personal = 0") lab(4 "Personal = 1")) ///
xtitle("Months after release") ytitle("H(t)")
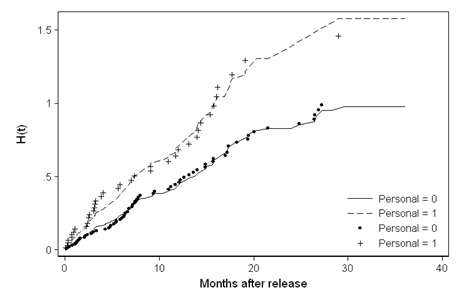
Table 14.1, page 525.
use https://stats.idre.ucla.edu/stat/stata/examples/alda/data/rearrest, clear

generate event = ~censor
stset months, failure(event)

     failure event:  event ~= 0 & event ~= .
obs. time interval:  (0, months]
 exit on or before:  failure

------------------------------------------------------------------------------
      194  total obs.
        0  exclusions
------------------------------------------------------------------------------
      194  obs. remaining, representing
      106  failures in single record/single failure data
 2678.456  total analysis time at risk, at risk from t =         0
                             earliest observed entry t =         0
                                  last observed exit t =        36

/* Model A */
stcox personal, nohr

Cox regression -- Breslow method for ties

No. of subjects =          194                     Number of obs   =       194
No. of failures =          106
Time at risk    =  2678.455851
                                                   LR chi2(1)      =      5.32
Log likelihood  =   -492.08392                     Prob > chi2     =    0.0210

------------------------------------------------------------------------------
          _t |
          _d |      Coef.   Std. Err.      z    P>|z|     [95% Conf. Interval]
-------------+----------------------------------------------------------------
    personal |   .4786654    .202482     2.36   0.018     .0818079    .8755229
------------------------------------------------------------------------------

test personal   /* wald test */

 ( 1)  personal = 0.0

           chi2(  1) =    5.59
         Prob > chi2 =    0.0181

/* Model B */
stcox property, nohr

Cox regression -- Breslow method for ties

No. of subjects =          194                     Number of obs   =       194
No. of failures =          106
Time at risk    =  2678.455851
                                                   LR chi2(1)      =     16.19
Log likelihood  =   -486.64864                     Prob > chi2     =    0.0000

------------------------------------------------------------------------------
          _t |
          _d |      Coef.   Std. Err.      z    P>|z|     [95% Conf. Interval]
-------------+----------------------------------------------------------------
    property |   1.194205   .3492838     3.42   0.001     .5096218    1.878789
------------------------------------------------------------------------------

test property   /* wald test */

 ( 1)  property = 0.0

           chi2(  1) =   11.69
         Prob > chi2 =    0.0006

/* Model C */
stcox cage, nohr

Cox regression -- Breslow method for ties

No. of subjects =          194                     Number of obs   =       194
No. of failures =          106
Time at risk    =  2678.455851
                                                   LR chi2(1)      =     22.93
Log likelihood  =   -483.27909                     Prob > chi2     =    0.0000

------------------------------------------------------------------------------
          _t |
          _d |      Coef.   Std. Err.      z    P>|z|     [95% Conf. Interval]
-------------+----------------------------------------------------------------
        cage |  -.0680667   .0156264    -4.36   0.000    -.0986939   -.0374394
------------------------------------------------------------------------------

test cage   /* wald test */

 ( 1)  cage = 0.0

           chi2(  1) =   18.97
         Prob > chi2 =    0.0000

/* Model D */
stcox personal property cage, nohr

Cox regression -- Breslow method for ties

No. of subjects =          194                     Number of obs   =       194
No. of failures =          106
Time at risk    =  2678.455851
                                                   LR chi2(3)      =     38.91
Log likelihood  =   -475.29169                     Prob > chi2     =    0.0000

------------------------------------------------------------------------------
          _t |
          _d |      Coef.   Std. Err.      z    P>|z|     [95% Conf. Interval]
-------------+----------------------------------------------------------------
    personal |   .5686725   .2051984     2.77   0.006      .166491     .970854
    property |   .9354007   .3508835     2.67   0.008     .2476817     1.62312
        cage |  -.0666248   .0167731    -3.97   0.000    -.0994995   -.0337501
------------------------------------------------------------------------------

test personal   /* wald test */

 ( 1)  personal = 0.0

           chi2(  1) =    7.68
         Prob > chi2 =    0.0056

test property   /* wald test */

 ( 1)  property = 0.0

           chi2(  1) =    7.11
         Prob > chi2 =    0.0077

test cage   /* wald test */

 ( 1)  cage = 0.0

           chi2(  1) =   15.78
         Prob > chi2 =    0.0001

/* Likelihood ratio tests */
lrtest, saving(0)
quietly stcox property cage, nohr  /* testing personal */
lrtest

Cox:  likelihood-ratio test                           chi2(1)     =       7.27
                                                      Prob > chi2 =     0.0070

quietly stcox personal cage, nohr  /* testing property */
lrtest

Cox:  likelihood-ratio test                           chi2(1)     =       9.14
                                                      Prob > chi2 =     0.0025

quietly stcox personal property, nohr  /* testing cage */
lrtest

Cox:  likelihood-ratio test                           chi2(1)     =      18.28
                                                      Prob > chi2 =     0.0000
Table 14.2, page 533.
Note: Observations are in numerical id order, not the order shown in the book.
use https://stats.idre.ucla.edu/stat/stata/examples/alda/data/rearrest, clear
generate event = ~censor
stset months, failure(event)

stcox personal property cage
predict risk
list id personal property cage risk months censor if inlist(id,22,8,187,26,5,130,106,33)


            id   personal   property       cage       risk     months     censor
  5.         5          1          1  -7.164588    7.25298   .2956879          0
  8.         8          1          1   22.45074   1.008332     .62423          1
 22.        22          0          0   .2577249   .9829757   1.708419          1
 26.        26          0          1  -7.301481   4.144825   2.365503          0
 33.        33          1          0   27.06129   .2910442   2.792608          1
106.       106          0          0   16.20297   .3397587    11.6961          0
130.       130          0          1   22.39051   .5732906   15.96715          1
187.       187          1          0  -7.200181   2.853034         36          1
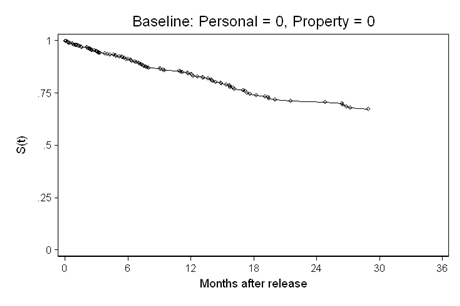
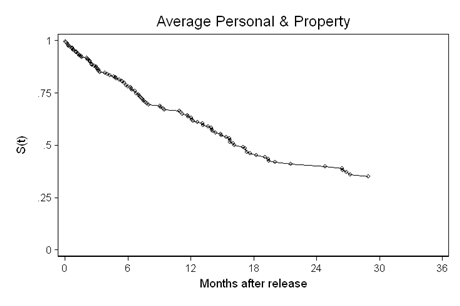
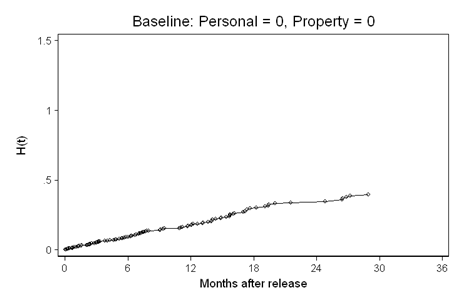
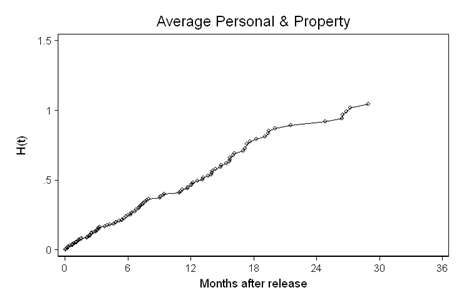
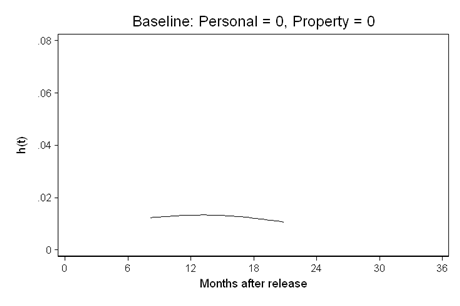
Figure 14.4, page 538.
use https://stats.idre.ucla.edu/stat/stata/examples/alda/data/rearrest, clear
generate event = ~censor
stset months, failure(event)
stcox personal property cage, basec(ch0)
summarize personal
global meanpersonal = r(mean)
summarize property
global meanproperty = r(mean)
gen ch1 = ch0 * (1.765921* $meanpersonal + 2.548234* $meanproperty)
gen s0 = exp(-ch0)
gen s1 = exp(-ch1)
/* Top row */
twoway (scatter s0 months if event==1, connect(direct) msize(small)), ///
title("Baseline: Personal = 0, Property = 0") ylabel(0(.25)1) xlabel(0(6)36) xtitle("Months after release") ytitle("S(t)")
 twoway (scatter s1 months if event==1, connect(direct) msize(small)), ///
title("Average Personal & Property") ylabel(0(.25)1) xlabel(0(6)36) xtitle("Months after release") ytitle("S(t)")
twoway (scatter s1 months if event==1, connect(direct) msize(small)), ///
title("Average Personal & Property") ylabel(0(.25)1) xlabel(0(6)36) xtitle("Months after release") ytitle("S(t)")
 /* Middle row */
twoway (scatter ch0 months if event==1, connect(direct) lpattern(solid) msize(small)), ///
title("Baseline: Personal = 0, Property = 0") ylabel(0(.5)1.5) xlabel(0(6)36) xtitle("Months after release") ytitle("H(t)")
/* Middle row */
twoway (scatter ch0 months if event==1, connect(direct) lpattern(solid) msize(small)), ///
title("Baseline: Personal = 0, Property = 0") ylabel(0(.5)1.5) xlabel(0(6)36) xtitle("Months after release") ytitle("H(t)")
 twoway (scatter ch1 months if event==1, connect(direct) lpattern(solid) msize(small)), ///
title("Average Personal & Property") ylabel(0(.5)1.5) xlabel(0(6)36) xtitle("Months after release") ytitle("H(t)")
twoway (scatter ch1 months if event==1, connect(direct) lpattern(solid) msize(small)), ///
title("Average Personal & Property") ylabel(0(.5)1.5) xlabel(0(6)36) xtitle("Months after release") ytitle("H(t)")
 /* Bottom row */
stcox personal property cage, basehc(h)
stcurve, hazard at(property = 0 personal = 0) width(8) ///
title("Baseline: Personal = 0, Property = 0") ylabel(0.00(0.02)0.08) xlabel(0(6)36) xtitle("Months after release") ytitle("h(t)")
/* Bottom row */
stcox personal property cage, basehc(h)
stcurve, hazard at(property = 0 personal = 0) width(8) ///
title("Baseline: Personal = 0, Property = 0") ylabel(0.00(0.02)0.08) xlabel(0(6)36) xtitle("Months after release") ytitle("h(t)")
 stcurve, hazard at(property=$meanproperty personal = $meanpersonal) width(8) ///
title("Average Personal & Property") ylabel(0.00(0.02)0.08) xlabel(0(6)36) xtitle("Months after release") ytitle("h(t)")
stcurve, hazard at(property=$meanproperty personal = $meanpersonal) width(8) ///
title("Average Personal & Property") ylabel(0.00(0.02)0.08) xlabel(0(6)36) xtitle("Months after release") ytitle("h(t)")
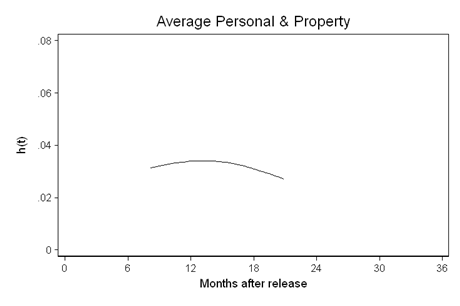
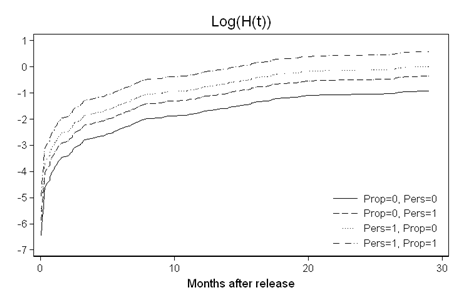
Figure 14.5, page 541.
use https://stats.idre.ucla.edu/stat/stata/examples/alda/data/rearrest, clear
generate event = ~censor
stset months, failure(event)
stcox personal property cage, basec(ch_per0prop0)
gen ch_per1prop0 = ch_per0prop0 * exp(_coef[personal])
gen ch_per0prop1 = ch_per0prop0 * exp(_coef[property])
gen ch_per1prop1 = ch_per0prop0 * exp(_coef[property]) * exp(_coef[personal])
gen s00 = exp(-ch_per0prop0 )
gen s10 = exp(-ch_per1prop0 )
gen s01 = exp(-ch_per0prop1 )
gen s11 = exp(-ch_per1prop1 )
gen lh00 = log(ch_per0prop0 )
gen lh10 = log(ch_per1prop0 )
gen lh01 = log(ch_per0prop1 )
gen lh11 = log(ch_per1prop1 )
/* Top figure */
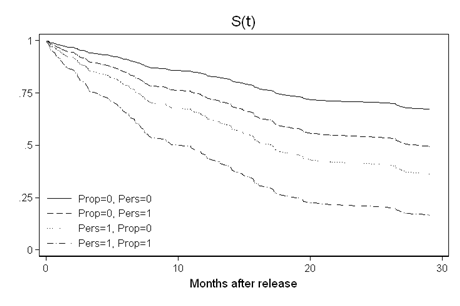
twoway (scatter s00 months if event==1, connect(direct) lpattern(solid) msize(zero)) ///
(scatter s10 months if event==1, connect(direct) lpattern(dash) msize(zero)) ///
(scatter s01 months if event==1, connect(direct) lpattern(dot) msize(zero)) ///
(scatter s11 months if event==1, connect(direct) lpattern(dash_dot) msize(zero)), ///
title("S(t)") ylabel(0.0(0.25)1.0) xtitle("Months after release") ///
legend(ring(0) pos(8) lab(1 "Prop=0, Pers=0") lab(2 "Prop=0, Pers=1") lab(3 "Pers=1, Prop=0") lab(4 "Pers=1, Prop=1")) scheme(Lean1)
 /* Middle figure */
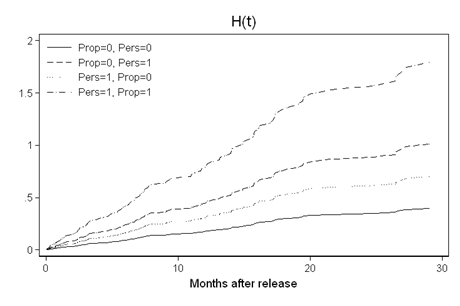
twoway (scatter ch_per0prop0 months if event==1, connect(direct) lpattern(solid) msize(zero)) ///
(scatter ch_per0prop1 months if event==1, connect(direct) lpattern(dash) msize(zero)) ///
(scatter ch_per1prop0 months if event==1, connect(direct) lpattern(dot) msize(zero)) ///
(scatter ch_per1prop1 months if event==1, connect(direct) lpattern(dash_dot) msize(zero)), ///
title("H(t)") ylabel(0.0(0.5)2.0) xtitle("Months after release") ///
legend(ring(0) pos(10) lab(1 "Prop=0, Pers=0") lab(2 "Prop=0, Pers=1") lab(3 "Pers=1, Prop=0") lab(4 "Pers=1, Prop=1")) scheme(Lean1)
/* Middle figure */
twoway (scatter ch_per0prop0 months if event==1, connect(direct) lpattern(solid) msize(zero)) ///
(scatter ch_per0prop1 months if event==1, connect(direct) lpattern(dash) msize(zero)) ///
(scatter ch_per1prop0 months if event==1, connect(direct) lpattern(dot) msize(zero)) ///
(scatter ch_per1prop1 months if event==1, connect(direct) lpattern(dash_dot) msize(zero)), ///
title("H(t)") ylabel(0.0(0.5)2.0) xtitle("Months after release") ///
legend(ring(0) pos(10) lab(1 "Prop=0, Pers=0") lab(2 "Prop=0, Pers=1") lab(3 "Pers=1, Prop=0") lab(4 "Pers=1, Prop=1")) scheme(Lean1)
 /* Bottom figure */
twoway (scatter lh00 months if event==1, connect(direct) lpattern(solid) msize(zero)) ///
(scatter lh10 months if event==1, connect(direct) lpattern(dash) msize(zero)) ///
(scatter lh01 months if event==1, connect(direct) lpattern(dot) msize(zero)) ///
(scatter lh11 months if event==1, connect(direct) lpattern(dash_dot) msize(zero)), ///
title("Log(H(t))") ylabel(-7(1)1) xtitle("Months after release") ///
legend(ring(0) pos(5) lab(1 "Prop=0, Pers=0") lab(2 "Prop=0, Pers=1") lab(3 "Pers=1, Prop=0") lab(4 "Pers=1, Prop=1")) scheme(Lean1)
/* Bottom figure */
twoway (scatter lh00 months if event==1, connect(direct) lpattern(solid) msize(zero)) ///
(scatter lh10 months if event==1, connect(direct) lpattern(dash) msize(zero)) ///
(scatter lh01 months if event==1, connect(direct) lpattern(dot) msize(zero)) ///
(scatter lh11 months if event==1, connect(direct) lpattern(dash_dot) msize(zero)), ///
title("Log(H(t))") ylabel(-7(1)1) xtitle("Months after release") ///
legend(ring(0) pos(5) lab(1 "Prop=0, Pers=0") lab(2 "Prop=0, Pers=1") lab(3 "Pers=1, Prop=0") lab(4 "Pers=1, Prop=1")) scheme(Lean1)