Please note that the early_int data file (which is used in Chapter 3) is not included among the data files. This was done at the request of the researcher who contributed this data file to ensure the privacy of the participants in the study. Although the web page shows how to obtain the results with this data file, we regret that visitors do not have access to this file to be able to replicate the results for themselves. Table 3.1, page 48
use earlyint_pp, clear

list id age cog program in 1/12

            id        age        cog    program
  1.        68          1        103          1
  2.        68        1.5        119          1
  3.        68          2         96          1
  4.        70          1        106          1
  5.        70        1.5        107          1
  6.        70          2         96          1
  7.        71          1        112          1
  8.        71        1.5         86          1
  9.        71          2         73          1
 10.        72          1        100          1
 11.        72        1.5         93          1
 12.        72          2         87          1

list id age cog program in 175/186

            id        age        cog    program
175.       902          1        119          0
176.       902        1.5         93          0
177.       902          2         99          0
178.       904          1        112          0
179.       904        1.5         98          0
180.       904          2         79          0
181.       906          1         89          0
182.       906        1.5         66          0
183.       906          2         81          0
184.       908          1        117          0
185.       908        1.5         90          0
186.       908          2         76          0
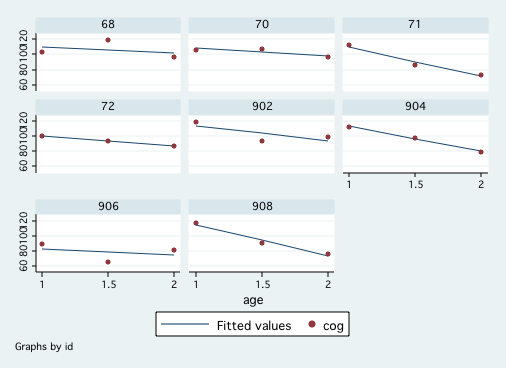
Figure 3.1, page 50
generate select = inlist(id,68,70,71,72,902,904,906,908)
keep if select

graph twoway (lfit cog age)(scatter cog age), by(id)
Figure 3.3, page 57.
use earlyint_pp, clear egen grp=group(id) generate p1=. forvalues i = 1/103 { quietly regress cog age if grp==`i' quietly predict p quietly replace p1=p if grp==`i' quietly drop p } graph twoway (scatter p1 age, msym(i) connect(L))(lfit cog age), legend(off)statsby _b[_cons] _b[time] (e(rmse)^2), by(id): regress cog time stem _stat_1, round(1) Stem-and-leaf plot for _stat_1 (_b[_cons]) _stat_1 rounded to integers _stat_1 rounded to integers 5. | 7 6* | 6. | 7* | 7. | 7 8* | 34 8. | 89 9* | 344 9. | 6666677799 10* | 0012222244 10. | 55666788999 11* | 000111112222333334444 11. | 55677777888999 12* | 12233344 12. | 5556778999 13* | 0013 13. | 55568 14* | 0 stem _stat_2 Stem-and-leaf plot for _stat_2 (_b[time]) -4* | 443111 -3. | 987 -3* | 443322100000 -2. | 9999877776655 -2* | 44322211110000 -1. | 99888877666655 -1* | 4333322211000 -0. | 99998888777765 -0* | 4444332 0* | 134 0. | 79 1* | 0 1. | 2* | 0 stem _stat_3, round(1) lines(1) Stem-and-leaf plot for _stat_3 (e(rmse)^2) _stat_3 rounded to integers 0* | 0000111122233334444444466668 1* | 111114447 2* | 044448888 3* | 33338888888 4* | 3338 5* | 44 6* | 777 7* | 44 8* | 111888 9* | 6666 10* | 444 11* | 33 12* | 2 13* | 1 14* | 15* | 16* | 000 17* | 11 18* | 19* | 3 20* | 21* | 22* | 8 23* | 24* | 1 25* | 444 26* | 7 27* | 28* | 29* | 4 30* | 31* | 32* | 3 33* | 34* | 35* | 36* | 8 37* | 38* | 39* | 40* | 00 41* | 42* | 43* | 44* | 45* | 46* | 8
Figure 3.4, page 59
use earlyint_pp, clear

egen grp=group(id)

generate p1=.
forvalues i = 1/103 {
  quietly regress cog age if grp==`i'
  quietly predict p
  quietly replace p1=p if grp==`i'
  quietly drop p
 }

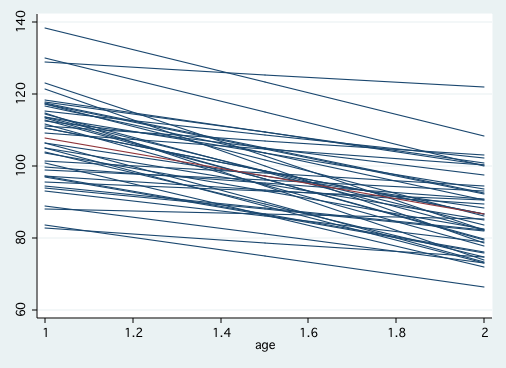
graph twoway (scatter p1 age if program==0, msym(i) connect(L))(lfit cog age if program==0), legend(off)


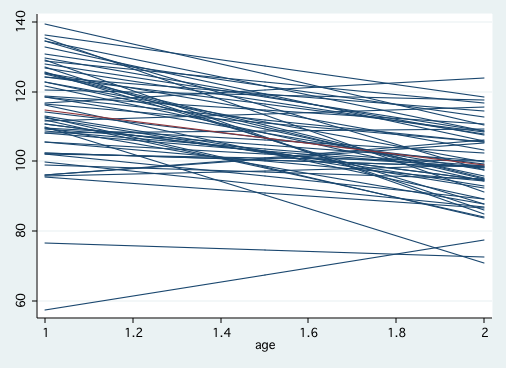
graph twoway (scatter p1 age if program==1, msym(i) connect(L))(lfit cog age if program==1), legend(off)

Table 3.3, page 69 In this table we will make use of the gllamm program written by Sophia Rabe-Hesketh, Andrew Pickles and Anders Skrondal. Stata users can obtain gllamm by using the command, search gllamm, and following the prompts (see How can I use the search command to search for programs and get additional help? for more information about using search). Recent versions of gllamm have greatly improved accuracy but the procedure is very slow in comparison to other multilevel programs. To use gllamm you need to create an explicit constant of all ones, create an interaction term, and define equations for the random intercept and slope. The nrf option indicates the number of random factors, nip is the number of integration points, and adapt allows for the use of adaptive quadrature for better accuracy.
generate prg_time = program*time

mixed cog program time prg_time || id: time, cov(un)

Performing EM optimization ...

Performing gradient-based optimization:
Iteration 0:  Log likelihood = -1186.0251
Iteration 1:  Log likelihood = -1185.0633
Iteration 2:  Log likelihood = -1184.9794
Iteration 3:  Log likelihood = -1184.9707
Iteration 4:  Log likelihood = -1184.9703
Iteration 5:  Log likelihood = -1184.9703

Computing standard errors ...

Mixed-effects ML regression                          Number of obs    =    309
Group variable: id                                   Number of groups =    103
                                                     Obs per group:
                                                                  min =      3
                                                                  avg =    3.0
                                                                  max =      3
                                                     Wald chi2(3)     = 242.64
Log likelihood = -1184.9703                          Prob > chi2      = 0.0000

---------------------------------------------------------------------------------
            cog | Coefficient  Std. err.      z    P>|z|     [95% conf. interval]
----------------+----------------------------------------------------------------
        program |   6.854662   2.711275     2.53   0.011     1.540661    12.16866
           time |  -21.13333   1.883346   -11.22   0.000    -24.82462   -17.44204
       prg_time |   5.271264   2.509775     2.10   0.036     .3521963    10.19033
          _cons |   107.8407   2.034552    53.00   0.000     103.8531    111.8284
---------------------------------------------------------------------------------

------------------------------------------------------------------------------
  Random-effects parameters  |   Estimate   Std. err.     [95% conf. interval]
-----------------------------+------------------------------------------------
id: Unstructured             |
                   var(time) |   10.09524    8.70534      1.862547    54.71746
                  var(_cons) |   123.9734   25.82612      82.41503    186.4879
             cov(time,_cons) |  -35.37712   17.96441     -70.58672   -.1675282
-----------------------------+------------------------------------------------
               var(Residual) |   74.75971   7.366321      61.63053     90.6858
------------------------------------------------------------------------------
LR test vs. linear model: chi2(3) = 89.46                 Prob > chi2 = 0.0000

Note: LR test is conservative and provided only for reference.
generate cons = 1 generate prg_time = program*time eq int: cons eq slope: time set more off gllamm cog program time prg_time, i(id) eqs(int slope) nrf(2) nip(8) adapt General model information ------------------------------------------------------------------------------ dependent variable: cog family: gauss link: ident equation for fixed effects program time prg_time _cons Random effects information for 2 level model ------------------------------------------------------------------------------ ***level 1 equation: log standard deviation lns1: _cons ***level 2 (id) equation(s): (2 random effect(s)) number of level 1 units = 309 number of level 2 units = 103 Condition Number = 129.8479 gllamm model log likelihood = -1184.9705 ------------------------------------------------------------------------------ cog | Coef. Std. Err. z P>|z| [95% Conf. Interval] -------------+---------------------------------------------------------------- program | 6.854673 2.713247 2.53 0.012 1.536806 12.17254 time | -21.13332 1.884586 -11.21 0.000 -24.82704 -17.4396 prg_time | 5.271254 2.511427 2.10 0.036 .3489467 10.19356 _cons | 107.8407 2.036033 52.97 0.000 103.8502 111.8313 ------------------------------------------------------------------------------ Variance at level 1 ------------------------------------------------------------------------------ 74.875942 (7.3826585) Variances and covariances of random effects ------------------------------------------------------------------------------ ***level 2 (id) var(1): 124.14771 (25.889351) cov(2,1): -35.36309 (17.996907) cor(2,1): -1 var(2): 10.073067 (8.7079115) ------------------------------------------------------------------------------
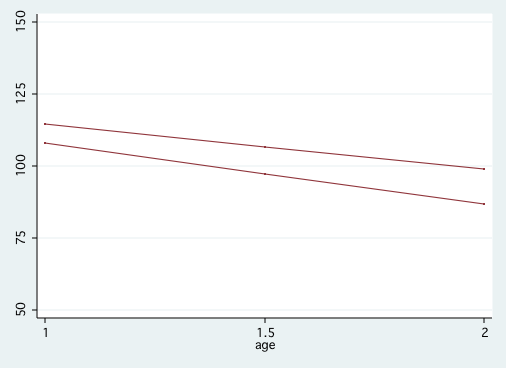
Figure 3.5 on page 71.
predict pred
sort prog age
twoway scatter cog pred age, msymbol(i i) connect(. L) ///
                 ylabel(50(25)150) xlabel(1(.5)2) legend(off)


