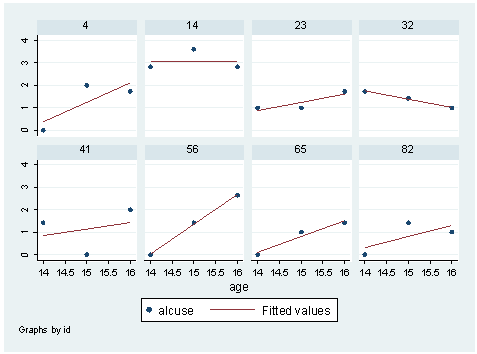
Figure 4.1, page 77
use https://stats.idre.ucla.edu/stat/stata/examples/alda/data/alcohol1_pp

graph twoway (scatter alcuse age) (lfit alcuse age) ///
  if inlist(id,4,14,23,32,41,56,65,82), by(id, cols(4))
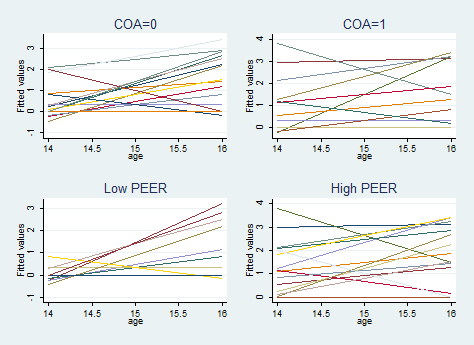
Figure 4.2, page 79
* Note: the book randomly samples 32 IDs for these plots, our sample will not match exactly

gen r = uniform()
sort id
by id: egen idr = mean(r)
sort idr
keep if _n in 1/96
drop r idr

sum peer
gen peerhi = (peer >= r(mean))

capture drop p
quietly reg alcuse i.id##c.age
predict p
xtline p if coa==0, overlay t(age) i(id) legend(off) title("COA=0") name(gg1)
xtline p if coa==1, overlay t(age) i(id) legend(off) title("COA=1") name(gg2)
xtline p if peerhi==0, overlay t(age) i(id) legend(off) title("Low PEER") name(gg3)
xtline p if peerhi==1, overlay t(age) i(id) legend(off) title("High PEER") name(gg4)

graph combine gg1 gg2 gg3 gg4
use https://stats.idre.ucla.edu/stat/stata/examples/alda/data/alcohol1_pp, clear
Table 4.1, pages 94-95
* Model A
mixed alcuse  || id:

Performing EM optimization:

Performing gradient-based optimization:

Iteration 0:   log likelihood = -335.07799
Iteration 1:   log likelihood = -335.07799

Computing standard errors:

Mixed-effects ML regression                     Number of obs      =       246
Group variable: id                              Number of groups   =        82

                                                Obs per group: min =         3
                                                               avg =       3.0
                                                               max =         3


                                                Wald chi2(0)       =         .
Log likelihood = -335.07799                     Prob > chi2        =         .

------------------------------------------------------------------------------
      alcuse |      Coef.   Std. Err.      z    P>|z|     [95% Conf. Interval]
-------------+----------------------------------------------------------------
       _cons |   .9219549   .0957073     9.63   0.000      .734372    1.109538
------------------------------------------------------------------------------

------------------------------------------------------------------------------
  Random-effects Parameters  |   Estimate   Std. Err.     [95% Conf. Interval]
-----------------------------+------------------------------------------------
id: Identity                 |
                  var(_cons) |   .5638619   .1191124      .3727018    .8530686
-----------------------------+------------------------------------------------
               var(Residual) |    .561747   .0620346      .4524194    .6974936
------------------------------------------------------------------------------
LR test vs. linear regression: chibar2(01) =    57.07 Prob >= chibar2 = 0.0000
* Model B mixed alcuse age_14 || id: age_14, cov(un) Performing EM optimization: Performing gradient-based optimization: Iteration 0: log likelihood = -318.31559 Iteration 1: log likelihood = -318.30556 Iteration 2: log likelihood = -318.30554 Computing standard errors: Mixed-effects ML regression Number of obs = 246 Group variable: id Number of groups = 82 Obs per group: min = 3 avg = 3.0 max = 3 Wald chi2(1) = 18.78 Log likelihood = -318.30554 Prob > chi2 = 0.0000 ------------------------------------------------------------------------------ alcuse | Coef. Std. Err. z P>|z| [95% Conf. Interval] -------------+---------------------------------------------------------------- age_14 | .2706514 .0624548 4.33 0.000 .1482423 .3930606 _cons | .6513035 .1050803 6.20 0.000 .4453498 .8572572 ------------------------------------------------------------------------------ ------------------------------------------------------------------------------ Random-effects Parameters | Estimate Std. Err. [95% Conf. Interval] -----------------------------+------------------------------------------------ id: Unstructured | var(age_14) | .1512035 .0564703 .0727213 .3143849 var(_cons) | .6243576 .1480618 .3922629 .9937785 cov(age_14,_cons) | -.0684405 .0700779 -.2057906 .0689096 -----------------------------+------------------------------------------------ var(Residual) | .3372916 .052676 .2483536 .4580793 ------------------------------------------------------------------------------ LR test vs. linear regression: chi2(3) = 79.70 Prob > chi2 = 0.0000 Note: LR test is conservative and provided only for reference* Model C mixed alcuse coa age_14 c.coa#c.age_14 || id: age_14, cov(un) Performing EM optimization: Performing gradient-based optimization: Iteration 0: log likelihood = -310.61555 Iteration 1: log likelihood = -310.60136 Iteration 2: log likelihood = -310.60131 Iteration 3: log likelihood = -310.60131 Computing standard errors: Mixed-effects ML regression Number of obs = 246 Group variable: id Number of groups = 82 Obs per group: min = 3 avg = 3.0 max = 3 Wald chi2(3) = 35.77 Log likelihood = -310.60131 Prob > chi2 = 0.0000 ------------------------------------------------------------------------------ alcuse | Coef. Std. Err. z P>|z| [95% Conf. Interval] -------------+---------------------------------------------------------------- coa | .743212 .1945656 3.82 0.000 .3618705 1.124554 age_14 | .2929552 .0842277 3.48 0.001 .1278719 .4580384 c.coa#c.age_14| -.0494299 .1253894 -0.39 0.693 -.2951887 .1963288 _cons | .3159517 .1306953 2.42 0.016 .0597936 .5721098 ------------------------------------------------------------------------------ ------------------------------------------------------------------------------ Random-effects Parameters | Estimate Std. Err. [95% Conf. Interval] -----------------------------+------------------------------------------------ id: Unstructured | var(age_14) | .1505975 .0563867 .0722954 .3137073 var(_cons) | .4875799 .1278182 .2916788 .8150547 cov(age_14,_cons) | -.0593426 .0657277 -.1881665 .0694812 -----------------------------+------------------------------------------------ var(Residual) | .3372923 .0526762 .248354 .4580805 ------------------------------------------------------------------------------ LR test vs. linear regression: chi2(3) = 66.15 Prob > chi2 = 0.0000 Note: LR test is conservative and provided only for reference* Model D mixed alcuse coa peer age_14 c.coa#c.age_14 c.peer#c.age_14 || id: age_14, cov(un) Performing EM optimization: Performing gradient-based optimization: Iteration 0: log likelihood = -294.4103 Iteration 1: log likelihood = -294.34565 Iteration 2: log likelihood = -294.34532 Iteration 3: log likelihood = -294.34532 Computing standard errors: Mixed-effects ML regression Number of obs = 246 Group variable: id Number of groups = 82 Obs per group: min = 3 avg = 3.0 max = 3 Wald chi2(5) = 84.14 Log likelihood = -294.34532 Prob > chi2 = 0.0000 ------------------------------------------------------------------------------ alcuse | Coef. Std. Err. z P>|z| [95% Conf. Interval] -------------+---------------------------------------------------------------- coa | .5791651 .162486 3.56 0.000 .2606984 .8976317 peer | .6942956 .1115329 6.23 0.000 .4756952 .912896 age_14 | .4294286 .1136893 3.78 0.000 .2066017 .6522555 c.coa#c.age_14| -.0140319 .124765 -0.11 0.910 -.2585669 .2305031 peerBYage_14 | -.149815 .0856406 -1.75 0.080 -.3176676 .0180375 _cons | -.3165142 .1480616 -2.14 0.033 -.6067096 -.0263187 ------------------------------------------------------------------------------ ------------------------------------------------------------------------------ Random-effects Parameters | Estimate Std. Err. [95% Conf. Interval] -----------------------------+------------------------------------------------ id: Unstructured | var(age_14) | .139112 .0548071 .0642702 .301106 var(_cons) | .240905 .0925874 .1134233 .5116692 cov(age_14,_cons) | -.0061151 .055002 -.1139171 .1016869 -----------------------------+------------------------------------------------ var(Residual) | .3372924 .0526762 .248354 .4580806 ------------------------------------------------------------------------------ LR test vs. linear regression: chi2(3) = 53.86 Prob > chi2 = 0.0000 Note: LR test is conservative and provided only for reference* Model E mixed alcuse coa peer age_14 c.peer#c.age_14 || id: age_14, cov(un) Performing EM optimization: Performing gradient-based optimization: Iteration 0: log likelihood = -294.41657 Iteration 1: log likelihood = -294.35197 Iteration 2: log likelihood = -294.35165 Iteration 3: log likelihood = -294.35165 Computing standard errors: Mixed-effects ML regression Number of obs = 246 Group variable: id Number of groups = 82 Obs per group: min = 3 avg = 3.0 max = 3 Wald chi2(4) = 84.13 Log likelihood = -294.35165 Prob > chi2 = 0.0000 ------------------------------------------------------------------------------ alcuse | Coef. Std. Err. z P>|z| [95% Conf. Interval] -------------+---------------------------------------------------------------- coa | .571197 .1462266 3.91 0.000 .2845981 .8577959 peer | .6951827 .1112552 6.25 0.000 .4771264 .9132389 age_14 | .4246867 .1055901 4.02 0.000 .2177339 .6316394 c.peer#c.age_14| -.1513771 .0845133 -1.79 0.073 -.3170201 .0142659 _cons | -.3138215 .1461149 -2.15 0.032 -.6002014 -.0274415 ------------------------------------------------------------------------------ ------------------------------------------------------------------------------ Random-effects Parameters | Estimate Std. Err. [95% Conf. Interval] -----------------------------+------------------------------------------------ id: Unstructured | var(age_14) | .1391594 .0548136 .0643032 .301157 var(_cons) | .2409203 .0925912 .1134324 .5116931 cov(age_14,_cons) | -.0061421 .0550086 -.1139569 .1016727 -----------------------------+------------------------------------------------ var(Residual) | .3372924 .0526762 .248354 .4580806 ------------------------------------------------------------------------------ LR test vs. linear regression: chi2(3) = 53.86 Prob > chi2 = 0.0000 Note: LR test is conservative and provided only for reference* Model F mixed alcuse coa cpeer age_14 c.cpeer#c.age_14 || id: age_14, cov(un) Performing EM optimization: Performing gradient-based optimization: Iteration 0: log likelihood = -294.41657 Iteration 1: log likelihood = -294.35197 Iteration 2: log likelihood = -294.35165 Iteration 3: log likelihood = -294.35165 Computing standard errors: Mixed-effects ML regression Number of obs = 246 Group variable: id Number of groups = 82 Obs per group: min = 3 avg = 3.0 max = 3 Wald chi2(4) = 84.13 Log likelihood = -294.35165 Prob > chi2 = 0.0000 ------------------------------------------------------------------------------ alcuse | Coef. Std. Err. z P>|z| [95% Conf. Interval] -------------+---------------------------------------------------------------- coa | .571197 .1462266 3.91 0.000 .2845981 .8577959 cpeer | .6951827 .1112552 6.25 0.000 .4771264 .9132389 age_14 | .2705847 .0612677 4.42 0.000 .1505023 .3906672 c.cpeer#c.ag~14| -.1513771 .0845133 -1.79 0.073 -.3170201 .0142659 _cons | .3938745 .1035383 3.80 0.000 .1909432 .5968057 ------------------------------------------------------------------------------ ------------------------------------------------------------------------------ Random-effects Parameters | Estimate Std. Err. [95% Conf. Interval] -----------------------------+------------------------------------------------ id: Unstructured | var(age_14) | .1391595 .0548136 .0643032 .301157 var(_cons) | .2409203 .0925912 .1134324 .5116931 cov(age_14,_cons) | -.0061421 .0550086 -.1139569 .1016727 -----------------------------+------------------------------------------------ var(Residual) | .3372924 .0526762 .248354 .4580806 ------------------------------------------------------------------------------ LR test vs. linear regression: chi2(3) = 53.86 Prob > chi2 = 0.0000 Note: LR test is conservative and provided only for reference* Model G mixed alcuse ccoa cpeer age_14 c.cpeer#c.age_14 || id: age_14, cov(un) Performing EM optimization: Performing gradient-based optimization: Iteration 0: log likelihood = -294.41657 Iteration 1: log likelihood = -294.35197 Iteration 2: log likelihood = -294.35165 Iteration 3: log likelihood = -294.35165 Computing standard errors: Mixed-effects ML regression Number of obs = 246 Group variable: id Number of groups = 82 Obs per group: min = 3 avg = 3.0 max = 3 Wald chi2(4) = 84.13 Log likelihood = -294.35165 Prob > chi2 = 0.0000 ------------------------------------------------------------------------------ alcuse | Coef. Std. Err. z P>|z| [95% Conf. Interval] -------------+---------------------------------------------------------------- ccoa | .571197 .1462266 3.91 0.000 .2845981 .8577959 cpeer | .6951827 .1112552 6.25 0.000 .4771264 .9132389 age_14 | .2705847 .0612677 4.42 0.000 .1505023 .3906672 c.cpeer#c.a~14| -.1513771 .0845133 -1.79 0.073 -.3170201 .0142659 _cons | .6514843 .0797861 8.17 0.000 .4951064 .8078622 ------------------------------------------------------------------------------ ------------------------------------------------------------------------------ Random-effects Parameters | Estimate Std. Err. [95% Conf. Interval] -----------------------------+------------------------------------------------ id: Unstructured | var(age_14) | .1391595 .0548136 .0643032 .301157 var(_cons) | .2409203 .0925912 .1134324 .5116931 cov(age_14,_cons) | -.0061421 .0550086 -.1139569 .1016727 -----------------------------+------------------------------------------------ var(Residual) | .3372924 .0526762 .248354 .4580806 ------------------------------------------------------------------------------ LR test vs. linear regression: chi2(3) = 53.86 Prob > chi2 = 0.0000 Note: LR test is conservative and provided only for referenceTable 4.1 (part 2), producing the output for pseudo R-squares which are described in Section 4.4.3 (page 102-104). We only show the code for Model D which can also be applied to other models in this table.
/* unconditional mean model */
mixed alcuse || id:, nolog

(output omitted)

mat b=e(b)
local e1=el(b,1,colsof(b))
mat e1=exp(`e1')^2

/* unconditional time model */

mixed  alcuse age_14  ||  id:  age_14, cov(unstr) nolog

(output omitted)

mat b = e(b)
local e2=el(b,1,colsof(b))
mat e2=exp(`e2')^2
estat recov
mat cov1=r(cov)
mat c1=vecdiag(cov1)
mat c1=e1,c1


/* final model */

mixed  alcuse peer coa age_14 c.age_14#c.peer c.age_14#c.coa ||  id:  age_14, cov(unstr) nolog

(output omitted)

estat recov
mat cov2=r(cov)
mat c2=vecdiag(cov2)
mat c2=e2,c2
predict p1
quietly regress alcuse p1
local orsq=e(r2)

display "Overall Pseudo R-squared = " `orsq'

Overall Pseudo R-squared = .2912099

mat d=diag(c1-c2)
mat rsq=vecdiag(d*syminv(diag(c1)))
mat colnames rsq = r2_e r2_s r2_i

display "Component Pseudo R-squareds"
mat list rsq

Component Pseudo R-squareds
rsq[1,3]
         r2_e       r2_s       r2_i
r1  .39956553  .07996194  .61415453
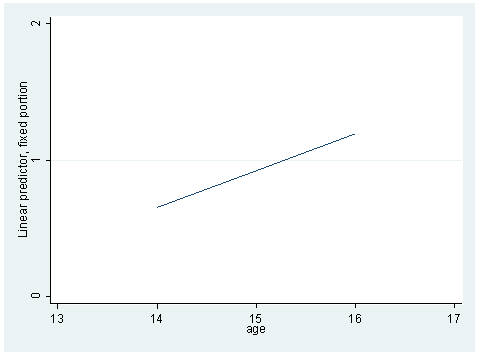
Figure 4.3 on page 99
* Model B
mixed alcuse age_14 || id: age_14 ,  cov(un)
predict yhatb
line yhatb age, xlabel(13 14 to 17) ylabel(0 1 2) sort
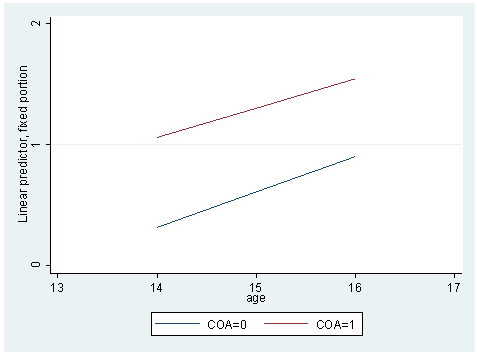
* model C
mixed alcuse coa age_14 c.coa#c.age_14 || id: age_14,  cov(un)
predict yhatc
graph twoway (line yhatc age if coa==0, sort) ///
             (line yhatc age if coa==1, sort), ///
             ylabel(0 1 2) xlabel(13 14 to 17) ///
             legend(label(1 "COA=0") label(2 "COA=1"))
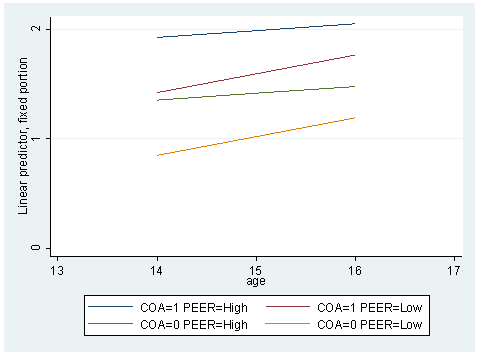
* Model E
mixed alcuse coa cpeer age_14  c.cpeer#c.age_14 || id: age_14,  cov(un)

preserve
replace cpeer = .655
predict yhatf_lopeer

replace cpeer = 1.381
predict yhatf_hipeer

graph twoway (line yhatf_hipeer yhatf_lopeer age if coa==1, sort) ///
             (line yhatf_hipeer yhatf_lopeer age if coa==0, sort), ///
             ylabel(0 1 2) xlabel(13 14 to 17) ///
             legend(label(1 "COA=1 PEER=High") label(2 "COA=1 PEER=Low") ///
             label(3 "COA=0 PEER=High") label(4 "COA=0 PEER=Low"))
restore
Test of equation 4.18 on page 123 using model F
* Model F
mixed alcuse coa cpeer age_14 c.cpeer#c.age_14 || id: age_14 ,  cov(un)
test [alcuse]_cons [alcuse]age_14

 ( 1)  [alcuse]_cons = 0
 ( 2)  [alcuse]age_14 = 0

           chi2(  2) =   51.03
         Prob > chi2 =    0.0000
Figure 4.4 on page 130
preserve
sort id
save temp, replace

statsby , by(id) clear : regress alcuse age_14

sort id
merge id using temp

scatter _b_cons coa, name(g1)
scatter _b_cons peer, name(g2)
scatter _b_age_14 coa, name(g3)
scatter _b_age_14 peer, name(g4)

graph combine g1 g2 g3 g4
corr _b* coa peer
(obs=246) | _b_ag~14 _b_cons coa peer -------------+------------------------------------ _b_age_14 | 1.0000 _b_cons | -0.4406 1.0000 coa | -0.0435 0.3887 1.0000 peer | -0.1940 0.5781 0.1622 1.0000restoreFigure 4.5 on page 131
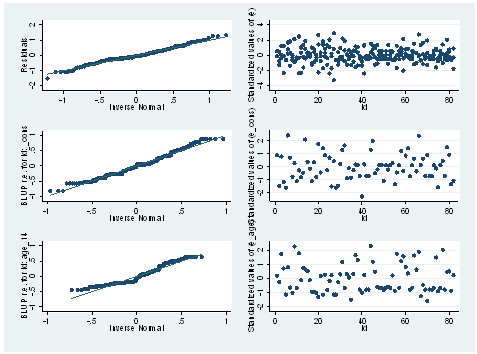
mixed alcuse coa cpeer age_14 c.cpeer#c.age_14 || id: age_14,  cov(un)

predict e, resid
predict e_age e_cons , reffects level(id)

qnorm e, name(g1)
qnorm e_cons, name(g2)
qnorm e_age, name(g3)

egen ze = std(e)
egen ze_age = std(e_age)
egen ze_cons = std(e_cons)

scatter ze id, name(g4)
scatter ze_cons id, name(g5)
scatter ze_age id, name(g6)

graph combine g1 g2 g3 g4 g5 g6, cols(2) colfirst
Figure 4.6 on page 133
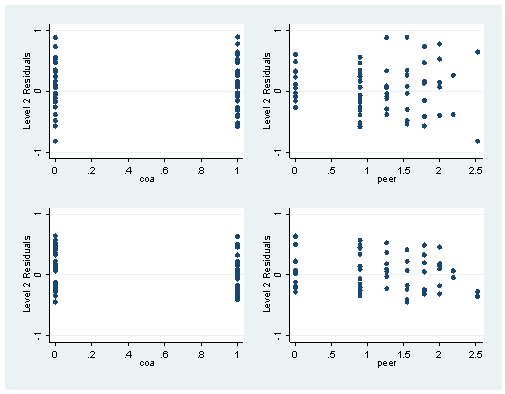
scatter e age, yscale(range(-2 2)) ylabel(-2(1)2) ytitle("Level 1 Residuals")scatter e_cons coa, yscale(range(-1 1)) ylabel(-1(1)1) ytitle("Level 2 Residuals") name(fig46_2) scatter e_cons peer, yscale(range(-1 1)) ylabel(-1(1)1) ytitle("Level 2 Residuals") name(fig46_3) scatter e_age coa, yscale(range(-1 1)) ylabel(-1(1)1) ytitle("Level 2 Residuals") name(fig46_4) scatter e_age peer, yscale(range(-1 1)) ylabel(-1(1)1) ytitle("Level 2 Residuals") name(fig46_5) graph combine fig46_2 fig46_3 fig46_4 fig46_5, cols(2)
Figure 4.7 on page 136
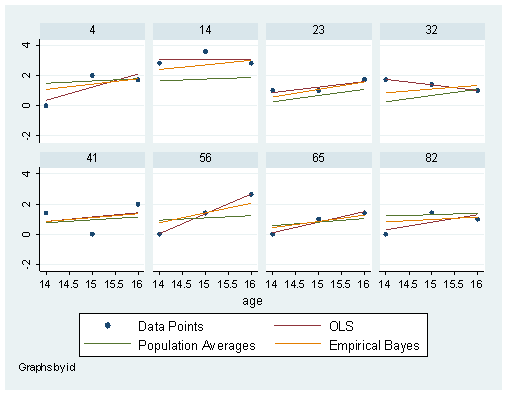
*Population Averages
reg alcuse age_14 coa cpeer c.cpeer#c.age_14
predict pPA

* Model F
mixed alcuse coa cpeer age_14 c.cpeer#c.age_14 || id: age_14, cov(un)
predict e_age e_cons , reffects level(id)

* Create Empirical Bayes Estimates
gen bayes0 = .3938745 + .571197*coa + .6951827*cpeer + e_cons
gen bayes1 = .2705847 - .1513771*cpeer + e_age
gen pbayes =  bayes0 + bayes1 * age_14

graph twoway (scatter alcuse age)(lfit alcuse age)(lfit pPA age)(lfit pbayes age) ///
if inlist(id,4,14,23,32,41,56,65,82), ///
yscale(range(-1 4)) by(id, cols(4)) legend(label(1 "Data Points") label(2 "OLS")label(3 "Population Averages")label(4 "Empirical Bayes"))

