Table 5.1 on page 141 using reading_pp data
use https://stats.idre.ucla.edu/stat/stata/examples/alda/data/reading_pp, clear

list if inlist(id, 4, 27, 31, 33, 41, 49, 69, 77, 87)
+--------------------------------------+ | id wave agegrp age piat | |--------------------------------------| 10. | 4 1 6.5 6 18 | 11. | 4 2 8.5 8.5 31 | 12. | 4 3 10.5 10.66667 50 | 79. | 27 1 6.5 6.25 19 | 80. | 27 2 8.5 9.166667 36 | |--------------------------------------| 81. | 27 3 10.5 10.91667 57 | 91. | 31 1 6.5 6.333333 18 | 92. | 31 2 8.5 8.833333 31 | 93. | 31 3 10.5 10.91667 51 | 97. | 33 1 6.5 6.333333 18 | |--------------------------------------| 98. | 33 2 8.5 8.916667 34 | 99. | 33 3 10.5 10.75 29 | 121. | 41 1 6.5 6.333333 18 | 122. | 41 2 8.5 8.75 28 | 123. | 41 3 10.5 10.83333 36 | |--------------------------------------| 145. | 49 1 6.5 6.5 19 | 146. | 49 2 8.5 8.75 32 | 147. | 49 3 10.5 10.66667 48 | 205. | 69 1 6.5 6.666667 26 | 206. | 69 2 8.5 9.166667 47 | |--------------------------------------| 207. | 69 3 10.5 11.33333 45 | 229. | 77 1 6.5 6.833333 17 | 230. | 77 2 8.5 8.083333 19 | 231. | 77 3 10.5 10 28 | 259. | 87 1 6.5 6.916667 22 | |--------------------------------------| 260. | 87 2 8.5 9.416667 49 | 261. | 87 3 10.5 11.5 64 | +--------------------------------------+
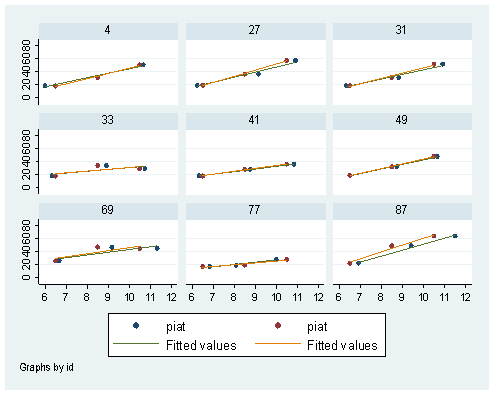
Figure 5.1 on page 143
preserve
keep if inlist(id, 4, 27, 31, 33, 41, 49, 69, 77, 87)
graph twoway (scatter piat age) (scatter piat agegrp) (lfit piat age, legend(off)) ///
(lfit piat agegrp, legend(off)) , by(id) ylabel(0(20)80) xlabel(6(1) 12)
Table 5.2 on page 145.
Part 1: Unconditional growth model on the centered agegrp variable
gen cagegrp = agegrp - 6.5
mixed piat cagegrp || id: cagegrp, cov(un)
Performing EM optimization:
Performing gradient-based optimization:
Iteration 0:   log likelihood = -910.13718
Iteration 1:   log likelihood = -909.97622
Iteration 2:   log likelihood = -909.97465
Iteration 3:   log likelihood = -909.97465
Computing standard errors:
Mixed-effects ML regression                     Number of obs      =       267
Group variable: id                              Number of groups   =        89
                                                Obs per group: min =         3
                                                               avg =       3.0
                                                               max =         3

                                                Wald chi2(1)       =    289.62
Log likelihood = -909.97465                     Prob > chi2        =    0.0000
------------------------------------------------------------------------------
        piat |      Coef.   Std. Err.      z    P>|z|     [95% Conf. Interval]
-------------+----------------------------------------------------------------
     cagegrp |   5.030899   .2956204    17.02   0.000     4.451494    5.610304
       _cons |   21.16292   .6142662    34.45   0.000     19.95898    22.36686
------------------------------------------------------------------------------
------------------------------------------------------------------------------
  Random-effects Parameters  |   Estimate   Std. Err.     [95% Conf. Interval]
-----------------------------+------------------------------------------------
id: Unstructured             |
                var(cagegrp) |    4.39745   1.271306      2.495273    7.749681
                  var(_cons) |   11.04583    6.06258      3.767131    32.38815
          cov(cagegrp,_cons) |   1.646659   2.062946     -2.396641    5.689959
-----------------------------+------------------------------------------------
               var(Residual) |   27.04309   4.053927      20.15839    36.27911
------------------------------------------------------------------------------
LR test vs. linear regression:       chi2(3) =    86.92   Prob > chi2 = 0.0000
Note: LR test is conservative and provided only for reference
Part 2: Unconditional growth model on centered age variable
gen cage = age - 6.5
mixed piat cage || id: cage, cov(un)
Performing EM optimization:
Performing gradient-based optimization:
Iteration 0:   log likelihood =  -902.4384
Iteration 1:   log likelihood = -901.98942
Iteration 2:   log likelihood = -901.95011
Iteration 3:   log likelihood =  -901.9478
Iteration 4:   log likelihood = -901.94777
Computing standard errors:
Mixed-effects ML regression                     Number of obs      =       267
Group variable: id                              Number of groups   =        89
                                                Obs per group: min =         3
                                                               avg =       3.0
                                                               max =         3

                                                Wald chi2(1)       =    303.42
Log likelihood = -901.94777                     Prob > chi2        =    0.0000
------------------------------------------------------------------------------
        piat |      Coef.   Std. Err.      z    P>|z|     [95% Conf. Interval]
-------------+----------------------------------------------------------------
        cage |   4.540021   .2606349    17.42   0.000     4.029186    5.050856
       _cons |   21.06082   .5593131    37.65   0.000     19.96458    22.15705
------------------------------------------------------------------------------
------------------------------------------------------------------------------
  Random-effects Parameters  |   Estimate   Std. Err.     [95% Conf. Interval]
-----------------------------+------------------------------------------------
id: Unstructured             |
                   var(cage) |   3.301472   1.014522      1.807751    6.029435
                  var(_cons) |   5.107369   6.028915      .5051372    51.63986
             cov(cage,_cons) |   2.366531   1.802022     -1.165368     5.89843
-----------------------------+------------------------------------------------
               var(Residual) |   27.44634   4.371408      20.08689    37.50216
------------------------------------------------------------------------------
LR test vs. linear regression:       chi2(3) =    88.91   Prob > chi2 = 0.0000
Note: LR test is conservative and provided only for reference
Table 5.3 on page 147 using wages_pp data
clear
use https://stats.idre.ucla.edu/stat/stata/examples/alda/data/wages_pp
list exper lnw black hgc uerate if id == 206 | id == 332 | id ==1028
      +--------------------------------------+
      | exper     lnw   black   hgc   uerate |
      |--------------------------------------|
  75. | 1.874   2.028       0    10      9.2 |
  76. | 2.814   2.297       0    10       11 |
  77. | 4.314   2.482       0    10    6.295 |
 197. |  .125    1.63       0     8      7.1 |
 198. | 1.625   1.476       0     8      9.6 |
      |--------------------------------------|
 199. | 2.413   1.804       0     8      7.2 |
 200. | 3.393   1.439       0     8    6.195 |
 201. |  4.47   1.748       0     8    5.595 |
 202. | 5.178   1.526       0     8    4.595 |
 203. | 6.082   2.044       0     8    4.295 |
      |--------------------------------------|
 204. | 7.043   2.179       0     8    3.395 |
 205. | 8.197   2.186       0     8    4.395 |
 206. | 9.092   4.035       0     8    6.695 |
 466. |  .004    .872       1     8      9.3 |
 467. |  .035    .903       1     8      7.4 |
      |--------------------------------------|
 468. |  .515   1.389       1     8      7.3 |
 469. | 1.483   2.324       1     8      7.4 |
 470. | 2.141   1.484       1     8    6.295 |
 471. | 3.161   1.705       1     8    5.895 |
 472. | 4.103   2.343       1     8      6.9 |
      +--------------------------------------+
Table 5.4 on page 149
Model A: Unconditional growth model
mixed lnw exper || id: exper, cov(un)
Performing EM optimization:
Performing gradient-based optimization:
Iteration 0:   log likelihood = -2460.7432
Iteration 1:   log likelihood = -2460.6972
Iteration 2:   log likelihood = -2460.6971
Computing standard errors:
Mixed-effects ML regression                     Number of obs      =      6402
Group variable: id                              Number of groups   =       888
                                                Obs per group: min =         1
                                                               avg =       7.2
                                                               max =        13
                                                Wald chi2(1)       =    380.59
Log likelihood = -2460.6971                     Prob > chi2        =    0.0000
------------------------------------------------------------------------------
         lnw |      Coef.   Std. Err.      z    P>|z|     [95% Conf. Interval]
-------------+----------------------------------------------------------------
       exper |   .0456807   .0023416    19.51   0.000     .0410913    .0502701
       _cons |   1.715604   .0107965   158.90   0.000     1.694443    1.736765
------------------------------------------------------------------------------
------------------------------------------------------------------------------
  Random-effects Parameters  |   Estimate   Std. Err.     [95% Conf. Interval]
-----------------------------+------------------------------------------------
id: Unstructured             |
                  var(exper) |    .001726     .00022      .0013444    .0022158
                  var(_cons) |   .0542681   .0050012      .0453001    .0650114
            cov(exper,_cons) |  -.0029149    .000869      -.004618   -.0012118
-----------------------------+------------------------------------------------
               var(Residual) |   .0951047   .0019442      .0913694    .0989927
------------------------------------------------------------------------------
LR test vs. linear regression:       chi2(3) =  1580.05   Prob > chi2 = 0.0000
Note: LR test is conservative and provided only for reference
Model B: Conditional growth model
gen hgc_exper = hgc_9*exper
gen bxexp = black*exper
mixed lnw exper black hgc_9 hgc_exper bxexp || id: exper, cov(un)
Performing EM optimization:
Performing gradient-based optimization:
Iteration 0:   log likelihood = -2436.9369
Iteration 1:   log likelihood = -2436.8758
Iteration 2:   log likelihood = -2436.8757
Computing standard errors:
Mixed-effects ML regression                     Number of obs      =      6402
Group variable: id                              Number of groups   =       888
                                                Obs per group: min =         1
                                                               avg =       7.2
                                                               max =        13

                                                Wald chi2(5)       =    441.56
Log likelihood = -2436.8757                  Prob > chi2        =    0.0000
------------------------------------------------------------------------------
         lnw |      Coef.   Std. Err.      z    P>|z|     [95% Conf. Interval]
-------------+----------------------------------------------------------------
       exper |   .0493428   .0026317    18.75   0.000     .0441848    .0545008
       black |   .0153954   .0239265     0.64   0.520    -.0314996    .0622905
       hgc_9 |   .0349201   .0078815     4.43   0.000     .0194727    .0503675
   hgc_exper |   .0012794   .0017232     0.74   0.458    -.0020979    .0046568
       bxexp |  -.0182129   .0054991    -3.31   0.001    -.0289911   -.0074348
       _cons |   1.717139   .0125424   136.91   0.000     1.692556    1.741721
------------------------------------------------------------------------------
------------------------------------------------------------------------------
  Random-effects Parameters  |   Estimate   Std. Err.     [95% Conf. Interval]
-----------------------------+------------------------------------------------
id: Unstructured             |
                  var(exper) |   .0016358   .0002139       .001266    .0021137
                  var(_cons) |   .0517481   .0048685      .0430341    .0622265
            cov(exper,_cons) |  -.0028508   .0008441     -.0045052   -.0011965
-----------------------------+------------------------------------------------
               var(Residual) |   .0951938   .0019462      .0914547    .0990857
------------------------------------------------------------------------------
LR test vs. linear regression:       chi2(3) =  1465.80   Prob > chi2 = 0.0000
Note: LR test is conservative and provided only for reference
Model C: conditional growth model
mixed lnw exper hgc_9 bxexp || id: exper, cov(un)
Performing EM optimization:
Performing gradient-based optimization:
Iteration 0:   log likelihood = -2437.4097
Iteration 1:   log likelihood = -2437.3518
Iteration 2:   log likelihood = -2437.3518
Computing standard errors:
Mixed-effects ML regression                     Number of obs      =      6402
Group variable: id                              Number of groups   =       888
                                                Obs per group: min =         1
                                                               avg =       7.2
                                                               max =        13

                                                Wald chi2(3)       =    439.40
Log likelihood = -2437.3518                  Prob > chi2        =    0.0000
------------------------------------------------------------------------------
         lnw |      Coef.   Std. Err.      z    P>|z|     [95% Conf. Interval]
-------------+----------------------------------------------------------------
       exper |    .048847   .0025134    19.43   0.000     .0439208    .0537732
       hgc_9 |   .0383608   .0064334     5.96   0.000     .0257516      .05097
       bxexp |   -.016115   .0045114    -3.57   0.000    -.0249571   -.0072729
       _cons |   1.721475   .0106971   160.93   0.000     1.700509    1.742441
------------------------------------------------------------------------------
------------------------------------------------------------------------------
  Random-effects Parameters  |   Estimate   Std. Err.     [95% Conf. Interval]
-----------------------------+------------------------------------------------
id: Unstructured             |
                  var(exper) |   .0016467   .0002141      .0012762    .0021247
                  var(_cons) |   .0518309   .0048732      .0431081    .0623188
            cov(exper,_cons) |  -.0028798   .0008455     -.0045369   -.0012227
-----------------------------+------------------------------------------------
               var(Residual) |   .0951735   .0019453      .0914361    .0990637
------------------------------------------------------------------------------
LR test vs. linear regression:       chi2(3) =  1474.50   Prob > chi2 = 0.0000
Note: LR test is conservative and provided only for reference
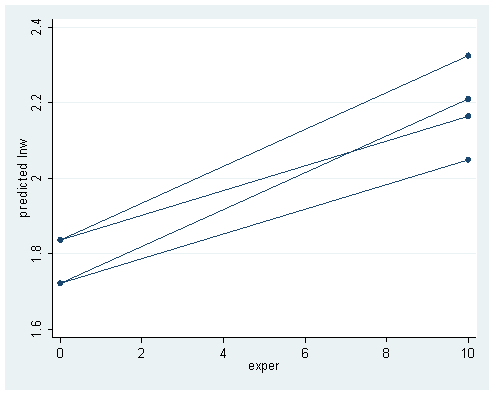
Figure 5.2 on page 150
We will first have to create a data set for generating predicted values for different groups.
input exper hgc_9 black group
exper      hgc_9      black      group
0  0 0 1
10 0 0 1
0  0 1 2
10 0 1 2
0  3 0 3
10 3 0 3
0  3 1 4
10 3 1 4
end

gen bxexp = black*exper
save fig5_2
use https://stats.idre.ucla.edu/stat/stata/examples/alda/data/wages_pp, clear
gen bxexp = black*exper
mixed lnw exper hgc_9 bxexp || id: exper, cov(un)
Performing EM optimization:
Performing gradient-based optimization:
Iteration 0:   log likelihood = -2437.4097
Iteration 1:   log likelihood = -2437.3518
Iteration 2:   log likelihood = -2437.3518
Computing standard errors:
Mixed-effects ML regression                     Number of obs      =      6402
Group variable: id                              Number of groups   =       888
                                                Obs per group: min =         1
                                                               avg =       7.2
                                                               max =        13

                                                Wald chi2(3)       =    439.40
Log likelihood = -2437.3518                     Prob > chi2        =    0.0000
------------------------------------------------------------------------------
         lnw |      Coef.   Std. Err.      z    P>|z|     [95% Conf. Interval]
-------------+----------------------------------------------------------------
       exper |    .048847   .0025134    19.43   0.000     .0439208    .0537732
       hgc_9 |   .0383608   .0064334     5.96   0.000     .0257516      .05097
       bxexp |   -.016115   .0045114    -3.57   0.000    -.0249571   -.0072729
       _cons |   1.721475   .0106971   160.93   0.000     1.700509    1.742441
------------------------------------------------------------------------------
------------------------------------------------------------------------------
  Random-effects Parameters  |   Estimate   Std. Err.     [95% Conf. Interval]
-----------------------------+------------------------------------------------
id: Unstructured             |
                  var(exper) |   .0016467   .0002141      .0012762    .0021247
                  var(_cons) |   .0518309   .0048732      .0431081    .0623188
            cov(exper,_cons) |  -.0028798   .0008455     -.0045369   -.0012227
-----------------------------+------------------------------------------------
               var(Residual) |   .0951735   .0019453      .0914361    .0990637
------------------------------------------------------------------------------
LR test vs. linear regression:       chi2(3) =  1474.50   Prob > chi2 = 0.0000
Note: LR test is conservative and provided only for reference

use fig5_2, clear
predict p
(option xb assumed)
twoway scatter p exper, c(L) ytitle("predicted lnw")
Table 5.5 on page 154 using wages_small_pp data. Stata does not have problem estimating this model.
use https://stats.idre.ucla.edu/stat/stata/examples/alda/data/wages_small_pp
gen bexper = black*exper
mixed lnw hgc_9 exper bexper || id: exper, cov(un)
Performing EM optimization:<
Performing gradient-based optimization:
Iteration 0:   log likelihood = -144.13188
Iteration 1:   log likelihood = -142.21488
Iteration 2:   log likelihood = -142.01812
Iteration 3:   log likelihood =  -141.9574
Iteration 4:   log likelihood =  -141.9398
Iteration 5:   log likelihood = -141.93609
Iteration 6:   log likelihood = -141.93515
Iteration 7:   log likelihood = -141.93492
Iteration 8:   log likelihood = -141.93487
Iteration 9:   log likelihood = -141.93486
Computing standard errors:
Mixed-effects ML regression                     Number of obs      =       257
Group variable: id                              Number of groups   =       124
                                                Obs per group: min =         1
                                                               avg =       2.1
                                                               max =         3

                                                Wald chi2(3)       =     11.96
Log likelihood = -141.93486                     Prob > chi2        =    0.0075
------------------------------------------------------------------------------
         lnw |      Coef.   Std. Err.      z    P>|z|     [95% Conf. Interval]
-------------+----------------------------------------------------------------
       hgc_9 |   .0461057    .024471     1.88   0.060    -.0018565    .0940679
       exper |   .0516136   .0210767     2.45   0.014      .010304    .0929232
      bexper |  -.0596725   .0347673    -1.72   0.086    -.1278152    .0084701
       _cons |   1.737337   .0475981    36.50   0.000     1.644046    1.830628
------------------------------------------------------------------------------
------------------------------------------------------------------------------
  Random-effects Parameters  |   Estimate   Std. Err.     [95% Conf. Interval]
-----------------------------+------------------------------------------------
id: Unstructured             |
                  var(exper) |   3.57e-06   .0000829      5.94e-26    2.14e+14
                  var(_cons) |   .0821216   .0320226      .0382418    .1763503
            cov(exper,_cons) |   .0005401   .0061749     -.0115624    .0126427
-----------------------------+------------------------------------------------
               var(Residual) |   .1149779   .0147141      .0894713    .1477561
------------------------------------------------------------------------------
LR test vs. linear regression:       chi2(3) =    23.71   Prob > chi2 = 0.0000
Note: LR test is conservative and provided only for reference
Fixed rates of change approach
mixed lnw exper hgc_9 bxexp || id:
Performing EM optimization:
Performing gradient-based optimization:
Iteration 0:   log likelihood = -141.94137
Iteration 1:   log likelihood = -141.93861
Iteration 2:   log likelihood = -141.93861
Computing standard errors:
Mixed-effects ML regression                     Number of obs      =       257
Group variable: id                              Number of groups   =       124
                                                Obs per group: min =         1
                                                               avg =       2.1
                                                               max =         3

                                                Wald chi2(3)       =     12.09
Log likelihood = -141.93861                     Prob > chi2        =    0.0071
------------------------------------------------------------------------------
         lnw |      Coef.   Std. Err.      z    P>|z|     [95% Conf. Interval]
-------------+----------------------------------------------------------------
       exper |   .0517798   .0209332     2.47   0.013     .0107516    .0928081
       hgc_9 |   .0457585   .0244959     1.87   0.062    -.0022525    .0937696
       bxexp |  -.0600723   .0345782    -1.74   0.082    -.1278443    .0076996
       _cons |   1.737344   .0477509    36.38   0.000     1.643754    1.830934
------------------------------------------------------------------------------
------------------------------------------------------------------------------
  Random-effects Parameters  |   Estimate   Std. Err.     [95% Conf. Interval]
-----------------------------+------------------------------------------------
id: Identity                 |
                  var(_cons) |   .0842504   .0211917      .0514597    .1379356
-----------------------------+------------------------------------------------
               var(Residual) |   .1147999   .0145473      .0895526    .1471652
------------------------------------------------------------------------------
LR test vs. linear regression: chibar2(01) =    23.71 Prob >= chibar2 = 0.0000
Table 5.6 on page 161 using unemployment_pp data
use https://stats.idre.ucla.edu/stat/stata/examples/alda/data/unemployment_pp, clear
list id months cesd unemp if id == 7589 | id == 55697 | id == 67641 | id ==65441 | id == 53782
     +---------------------------------+
     |    id     months   cesd   unemp |
     |---------------------------------|
212. |  7589   1.314168     36       1 |
213. |  7589   5.092402     40       1 |
214. |  7589   11.79466     39       1 |
454. | 53782   .4271047     22       1 |
455. | 53782   4.238193     15       0 |
     |---------------------------------|
456. | 53782   11.07187     21       1 |
504. | 55697   1.347023      7       1 |
505. | 55697   5.782341      4       1 |
623. | 65441   1.084189     27       1 |
624. | 65441   4.698152     15       1 |
     |---------------------------------|
625. | 65441   11.26899      7       0 |
647. | 67641   .3285421     32       1 |
648. | 67641   4.106776      9       0 |
649. | 67641   10.94045     10       0 |
     +---------------------------------+
Table 5.7 on page 163
Model A: Initial growth model
mixed cesd months || id:  months,cov(un)
Performing EM optimization ...

Performing gradient-based optimization:
Iteration 0:  Log likelihood = -2567.3171
Iteration 1:  Log likelihood =  -2566.571
Iteration 2:  Log likelihood = -2566.5687
Iteration 3:  Log likelihood = -2566.5687

Computing standard errors ...

Mixed-effects ML regression                          Number of obs    =    674
Group variable: id                                   Number of groups =    254
                                                     Obs per group:
                                                                  min =      1
                                                                  avg =    2.7
                                                                  max =      3
                                                     Wald chi2(1)     =  25.86
Log likelihood = -2566.5687                          Prob > chi2      = 0.0000

-----------------------------------------------------------------------------------
             cesd | Coefficient  Std. err.      z    P>|z|     [95% conf. interval]
------------------+----------------------------------------------------------------
           months |  -.4219941   .0829789    -5.09   0.000    -.5846297   -.2593585
            _cons |   17.66936   .7755637    22.78   0.000     16.14929    19.18944
-----------------------------------------------------------------------------------

------------------------------------------------------------------------------
  Random-effects parameters  |   Estimate   Std. err.     [95% conf. interval]
-----------------------------+------------------------------------------------
id: Unstructured             |
                 var(months) |   .3550302   .1844942       .128213    .9831023
                  var(_cons) |   86.84826   14.96314      61.95938    121.7349
           cov(months,_cons) |  -3.057233   1.384615     -5.771029    -.343438
-----------------------------+------------------------------------------------
               var(Residual) |   68.85021     6.6027       57.0526    83.08738
------------------------------------------------------------------------------
LR test vs. linear model: chi2(3) = 106.52                Prob > chi2 = 0.0000
Note: LR test is conservative and provided only for reference.
Model B: Main effect of unemployment
mixed cesd months unemp || id: months, cov(un)
Performing EM optimization ...

Performing gradient-based optimization:
Iteration 0:  Log likelihood = -2554.2517
Iteration 1:  Log likelihood = -2553.8032
Iteration 2:  Log likelihood = -2553.8016
Iteration 3:  Log likelihood = -2553.8016

Computing standard errors ...

Mixed-effects ML regression                          Number of obs    =    674
Group variable: id                                   Number of groups =    254
                                                     Obs per group:
                                                                  min =      1
                                                                  avg =    2.7
                                                                  max =      3
                                                     Wald chi2(2)     =  52.78
Log likelihood = -2553.8016                          Prob > chi2      = 0.0000

-----------------------------------------------------------------------------------
             cesd | Coefficient  Std. err.      z    P>|z|     [95% conf. interval]
------------------+----------------------------------------------------------------
           months |  -.2019834   .0933163    -2.16   0.030      -.38488   -.0190869
            unemp |   5.111307   .9888444     5.17   0.000     3.173208    7.049407
            _cons |    12.6656   1.242071    10.20   0.000     10.23118    15.10001
-----------------------------------------------------------------------------------

------------------------------------------------------------------------------
  Random-effects parameters  |   Estimate   Std. err.     [95% conf. interval]
-----------------------------+------------------------------------------------
id: Unstructured             |
                 var(months) |   .4647051   .1797869      .2177015    .9919586
                  var(_cons) |   93.51887   14.82016      68.54998    127.5825
           cov(months,_cons) |  -3.894106   1.370256     -6.579758   -1.208453
-----------------------------+------------------------------------------------
               var(Residual) |   62.38752   6.013225      51.64813    75.35999
------------------------------------------------------------------------------
LR test vs. linear model: chi2(3) = 114.84                Prob > chi2 = 0.0000

Note: LR test is conservative and provided only for reference.
Model C: Effect of unemployment on initial status and growth rate
gen unempxmth = unemp*months
mixed cesd months unemp unempxmth|| id: months, cov(un)
Performing EM optimization:
Performing gradient-based optimization:
Iteration 0:   log likelihood = -2551.9898
Iteration 1:   log likelihood = -2551.5272
Iteration 2:   log likelihood = -2551.5235
Iteration 3:   log likelihood = -2551.5235
Computing standard errors:
Mixed-effects ML regression                     Number of obs      =       674
Group variable: id                              Number of groups   =       254
                                                Obs per group: min =         1
                                                               avg =       2.7
                                                               max =         3

                                                Wald chi2(3)       =     57.88
Log likelihood = -2551.5235                  Prob > chi2        =    0.0000
------------------------------------------------------------------------------
        cesd |      Coef.   Std. Err.      z    P>|z|     [95% Conf. Interval]
-------------+----------------------------------------------------------------
      months |    .162036   .1936623     0.84   0.403    -.2175351    .5416072
       unemp |   8.529059   1.877875     4.54   0.000     4.848492    12.20963
   unempxmth |  -.4652222   .2172146    -2.14   0.032     -.890955   -.0394895
       _cons |   9.616744   1.889309     5.09   0.000     5.913766    13.31972
------------------------------------------------------------------------------
------------------------------------------------------------------------------
  Random-effects Parameters  |   Estimate   Std. Err.     [95% Conf. Interval]
-----------------------------+------------------------------------------------
id: Unstructured             |
                 var(months) |   .4512058   .1773447      .2088397    .9748464
                  var(_cons) |   93.71305   14.77709      68.79849    127.6501
           cov(months,_cons) |  -3.873144   1.358796     -6.536335   -1.209953
-----------------------------+------------------------------------------------
               var(Residual) |   62.03126   5.965555      51.37484     74.8981
------------------------------------------------------------------------------
LR test vs. linear regression:       chi2(3) =   116.31   Prob > chi2 = 0.0000
Note: LR test is conservative and provided only for reference
Model D: This model is problematic. The problem with this example is that the variance-covariance matrix of the three random effects is singular. The determinant is negative. Different algorithms and packages react differently to this situation. Many researchers might consider this an unacceptable model. Stata was not able to estimate standard errors for the random effects variance components using the default NR algorithm. Experimentation with other estimators produced no results at all. So we decided to show the solution using the default algorithm even though the standard errors of the random effects are missing.
mixed cesd unemp unempxmth || id: unemp unempxmth, cov(un)
Performing EM optimization ...

Performing gradient-based optimization:
Iteration 0:  Log likelihood = -2552.1214
Iteration 1:  Log likelihood =  -2548.306
Iteration 2:  Log likelihood =  -2547.758
Iteration 3:  Log likelihood = -2547.6515
Iteration 4:  Log likelihood = -2547.6474
Iteration 5:  Log likelihood = -2547.6474  (not concave)
Iteration 6:  Log likelihood = -2547.6474  (backed up)

Computing standard errors ...

Mixed-effects ML regression                          Number of obs    =    674
Group variable: id                                   Number of groups =    254
                                                     Obs per group:
                                                                  min =      1
                                                                  avg =    2.7
                                                                  max =      3
                                                     Wald chi2(2)     =  55.92
Log likelihood = -2547.6474                          Prob > chi2      = 0.0000

--------------------------------------------------------------------------------------
                cesd | Coefficient  Std. err.      z    P>|z|     [95% conf. interval]
---------------------+----------------------------------------------------------------
               unemp |   6.927268   .9300356     7.45   0.000     5.104432    8.750104
           unempxmth |  -.3029835   .1120896    -2.70   0.007    -.5226751   -.0832919
               _cons |   11.19492   .7898842    14.17   0.000     9.646772    12.74306
--------------------------------------------------------------------------------------

------------------------------------------------------------------------------
  Random-effects parameters  |   Estimate   Std. err.     [95% conf. interval]
-----------------------------+------------------------------------------------
id: Unstructured             |
                  var(unemp) |   44.96896          .             .           .
              var(unempxmth) |   .7534248          .             .           .
                  var(_cons) |    45.2535          .             .           .
        cov(unemp,unempxmth) |  -5.629083          .             .           .
            cov(unemp,_cons) |   6.543357          .             .           .
        cov(unempxmth,_cons) |   .6511535          .             .           .
-----------------------------+------------------------------------------------
               var(Residual) |   59.01791          .             .           .
------------------------------------------------------------------------------
LR test vs. linear model: chi2(6) = 124.60                Prob > chi2 = 0.0000

Note: LR test is conservative and provided only for reference.
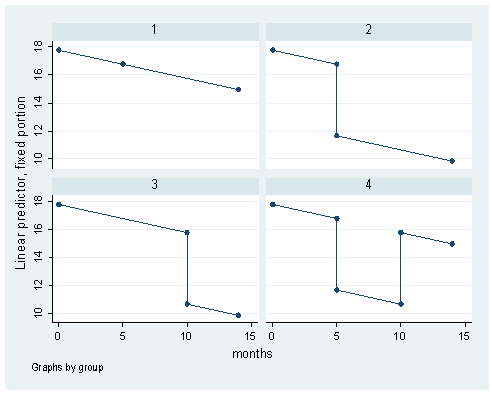
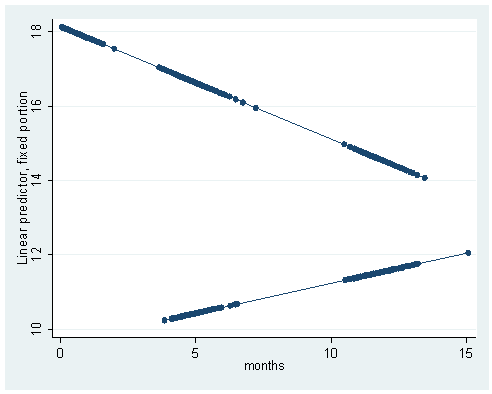
Figure 5.3 on page 165 based on model B from the previous example. We will have to create a small data set for generating predicted values.
input months unemp group
0  1  1
5  1  1
14 1  1
0  1  2
5  1  2
5  0  2
14 0  2
0  1  3
10 1  3
10 0  3
14 0  3
0  1  4
5  1  4
5  0  4
10 0  4
10 1  4
14 1  4
end
save fig5_3
file fig5_3.dta saved

use https://stats.idre.ucla.edu/stat/stata/examples/alda/data/unemployment_pp, clear
mixed cesd months unemp || id:  months, cov(un) nolog
Mixed-effects ML regression                     Number of obs      =       674
Group variable: id                              Number of groups   =       254
                                                Obs per group: min =         1
                                                               avg =       2.7
                                                               max =         3

                                                Wald chi2(2)       =     52.78
Log likelihood = -2553.8016                  Prob > chi2        =    0.0000
------------------------------------------------------------------------------
        cesd |      Coef.   Std. Err.      z    P>|z|     [95% Conf. Interval]
-------------+----------------------------------------------------------------
      months |  -.2019835   .0933162    -2.16   0.030      -.38488    -.019087
       unemp |   5.111305   .9888446     5.17   0.000     3.173205    7.049405
       _cons |    12.6656   1.242071    10.20   0.000     10.23118    15.10001
------------------------------------------------------------------------------
------------------------------------------------------------------------------
  Random-effects Parameters  |   Estimate   Std. Err.     [95% Conf. Interval]
-----------------------------+------------------------------------------------
id: Unstructured             |
                 var(months) |   .4647019   .1797873      .2176985    .9919587
                  var(_cons) |   93.51871   14.82016      68.54982    127.5824
           cov(months,_cons) |  -3.894087   1.370257     -6.579741   -1.208433
-----------------------------+------------------------------------------------
               var(Residual) |   62.38761   6.013247      51.64818    75.36013
------------------------------------------------------------------------------
LR test vs. linear regression:       chi2(3) =   114.84   Prob > chi2 = 0.0000

use fig5_3,  clear
predict p
(option xb assumed)
twoway scatter p month, by(group) c(L)
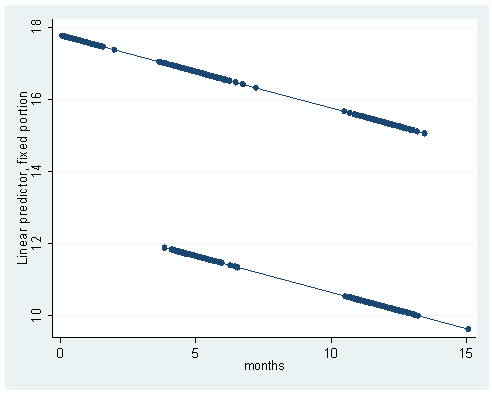
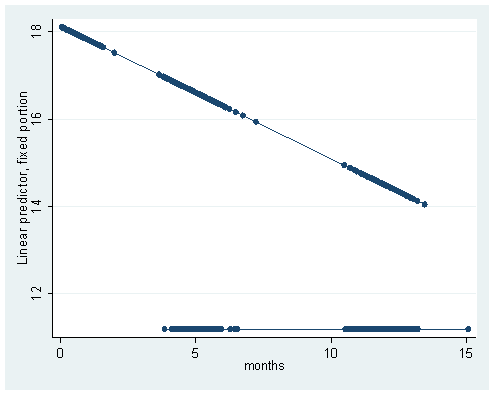
Figure 5.4 on page 167 based on Model B, C and D from previous example.
Leftmost panel using Model B:
mixed cesd months unemp || id: months, cov(un)
(output omitted)
------------------------------------------------------------------------------
        cesd |      Coef.   Std. Err.      z    P>|z|     [95% Conf. Interval]
-------------+----------------------------------------------------------------
      months |  -.2019835   .0933162    -2.16   0.030      -.38488    -.019087
       unemp |   5.111305   .9888446     5.17   0.000     3.173205    7.049405
       _cons |    12.6656   1.242071    10.20   0.000     10.23118    15.10001
------------------------------------------------------------------------------
------------------------------------------------------------------------------
  Random-effects Parameters  |   Estimate   Std. Err.     [95% Conf. Interval]
-----------------------------+------------------------------------------------
id: Unstructured             |
                 var(months) |   .4647019   .1797873      .2176985    .9919587
                  var(_cons) |   93.51871   14.82016      68.54982    127.5824
           cov(months,_cons) |  -3.894087   1.370257     -6.579741   -1.208433
-----------------------------+------------------------------------------------
               var(Residual) |   62.38761   6.013247      51.64818    75.36013
------------------------------------------------------------------------------
LR test vs. linear regression:       chi2(3) =   114.84   Prob > chi2 = 0.0000
Note: LR test is conservative and provided only for reference
predict p
(option xb assumed)
sort unemp months
scatter p months, c(L)
Panel in the middle using Model C
mixed cesd months unemp unempxmth || id: months, cov(un)
(output omitted)
------------------------------------------------------------------------------
        cesd |      Coef.   Std. Err.      z    P>|z|     [95% Conf. Interval]
-------------+----------------------------------------------------------------
      months |    .162036   .1936623     0.84   0.403    -.2175351    .5416072
       unemp |   8.529059   1.877875     4.54   0.000     4.848492    12.20963
   unempxmth |  -.4652222   .2172146    -2.14   0.032     -.890955   -.0394895
       _cons |   9.616744   1.889309     5.09   0.000     5.913766    13.31972
------------------------------------------------------------------------------
------------------------------------------------------------------------------
  Random-effects Parameters  |   Estimate   Std. Err.     [95% Conf. Interval]
-----------------------------+------------------------------------------------
id: Unstructured             |
                 var(months) |   .4512058   .1773447      .2088397    .9748464
                  var(_cons) |   93.71305   14.77709      68.79849    127.6501
           cov(months,_cons) |  -3.873144   1.358796     -6.536335   -1.209953
-----------------------------+------------------------------------------------
               var(Residual) |   62.03126   5.965555      51.37484     74.8981
------------------------------------------------------------------------------
LR test vs. linear regression:       chi2(3) =   116.31   Prob > chi2 = 0.0000
Note: LR test is conservative and provided only for reference
predict pc
(option xb assumed)
sort unemp months
scatter pc months, c(L)
Rightmost panel using Model D
mixed cesd unemp unempxmth || id: unemp unempxmth, cov(un)
(output omitted)
------------------------------------------------------------------------------
        cesd |      Coef.   Std. Err.      z    P>|z|     [95% Conf. Interval]
-------------+----------------------------------------------------------------
       unemp |   6.927277    .930033     7.45   0.000     5.104445    8.750108
   unempxmth |  -.3029831   .1120893    -2.70   0.007    -.5226741   -.0832921
       _cons |   11.19491   .7898805    14.17   0.000     9.646771    12.74305
------------------------------------------------------------------------------
------------------------------------------------------------------------------
  Random-effects Parameters  |   Estimate   Std. Err.     [95% Conf. Interval]
-----------------------------+------------------------------------------------
id: Unstructured             |
                  var(unemp) |   44.96733          .             .           .
               var(unempx~h) |    .753401          .             .           .
                  var(_cons) |   45.25229          .             .           .
         cov(unemp,unempx~h) |  -5.628865          .             .           .
            cov(unemp,_cons) |   6.544479          .             .           .
         cov(unempx~h,_cons) |   .6510678          .             .           .
-----------------------------+------------------------------------------------
               var(Residual) |   59.01838          .             .           .
------------------------------------------------------------------------------
LR test vs. linear regression:       chi2(6) =   124.60   Prob > chi2 = 0.0000
Note: LR test is conservative and provided only for reference
predict pd
(option xb assumed)
sort unemp months
scatter pd months, c(L)
Table 5.8 on page 175 using data set wages_pp
Model A: Unemployment rate centered around 7
mixed lnw hgc_9 ue_7 exper bexper || id: exper, cov(un)
Performing EM optimization:
Performing gradient-based optimization:
Iteration 0:   log likelihood = -2415.3186
Iteration 1:   log likelihood = -2415.2596
Iteration 2:   log likelihood = -2415.2595
Computing standard errors:
Mixed-effects ML regression                     Number of obs      =      6402
Group variable: id                              Number of groups   =       888
                                                Obs per group: min =         1
                                                               avg =       7.2
                                                               max =        13

                                                Wald chi2(4)       =    488.69
Log likelihood = -2415.2595                  Prob > chi2        =    0.0000
------------------------------------------------------------------------------
         lnw |      Coef.   Std. Err.      z    P>|z|     [95% Conf. Interval]
-------------+----------------------------------------------------------------
       hgc_9 |    .040011   .0063627     6.29   0.000     .0275403    .0524816
        ue_7 |  -.0119504   .0017916    -6.67   0.000     -.015462   -.0084389
       exper |   .0440539   .0026034    16.92   0.000     .0389513    .0491564
      bexper |  -.0181832   .0044837    -4.06   0.000    -.0269711   -.0093953
       _cons |   1.748989   .0113993   153.43   0.000     1.726646    1.771331
------------------------------------------------------------------------------
------------------------------------------------------------------------------
  Random-effects Parameters  |   Estimate   Std. Err.     [95% Conf. Interval]
-----------------------------+------------------------------------------------
id: Unstructured             |
                  var(exper) |   .0016317   .0002126       .001264    .0021064
                  var(_cons) |   .0506369   .0048085      .0420374    .0609955
            cov(exper,_cons) |  -.0029129   .0008386     -.0045565   -.0012693
-----------------------------+------------------------------------------------
               var(Residual) |   .0947952   .0019382      .0910714    .0986711
------------------------------------------------------------------------------
LR test vs. linear regression:       chi2(3) =  1423.34   Prob > chi2 = 0.0000
Note: LR test is conservative and provided only for reference
Model B Within context centering
mixed lnw hgc_9 ue_mean ue_person_centered exper bexper || id: exper, cov(un)
Performing EM optimization:
Performing gradient-based optimization:
Iteration 0:   log likelihood = -2413.5457
Iteration 1:   log likelihood = -2413.4893
Iteration 2:   log likelihood = -2413.4892
Computing standard errors:
Mixed-effects ML regression                     Number of obs      =      6402
Group variable: id                              Number of groups   =       888
                                                Obs per group: min =         1
                                                               avg =       7.2
                                                               max =        13

                                                Wald chi2(5)       =    494.17
Log likelihood = -2413.4892                  Prob > chi2        =    0.0000
------------------------------------------------------------------------------
         lnw |      Coef.   Std. Err.      z    P>|z|     [95% Conf. Interval]
-------------+----------------------------------------------------------------
       hgc_9 |   .0401695   .0063507     6.33   0.000     .0277224    .0526166
     ue_mean |  -.0177091   .0035202    -5.03   0.000    -.0246085   -.0108097
ue_person_~d |  -.0099015   .0020973    -4.72   0.000    -.0140121   -.0057909
       exper |   .0450568   .0026498    17.00   0.000     .0398632    .0502503
      bexper |  -.0188696   .0044769    -4.21   0.000    -.0276441    -.010095
       _cons |    1.87426   .0295235    63.48   0.000     1.816395    1.932125
------------------------------------------------------------------------------
------------------------------------------------------------------------------
  Random-effects Parameters  |   Estimate   Std. Err.     [95% Conf. Interval]
-----------------------------+------------------------------------------------
id: Unstructured             |
                  var(exper) |   .0016286   .0002123      .0012615    .0021026
                  var(_cons) |   .0510114   .0048412       .042353    .0614399
            cov(exper,_cons) |  -.0030248   .0008431     -.0046772   -.0013724
-----------------------------+------------------------------------------------
               var(Residual) |   .0948018   .0019384      .0910777    .0986782
------------------------------------------------------------------------------
LR test vs. linear regression:       chi2(3) =  1407.18   Prob > chi2 = 0.0000
Note: LR test is conservative and provided only for reference
Model C: Centering on time-1
mixed lnw hgc_9 ue1 ue_centert1 exper bexper || id: exper, cov(un)
Performing EM optimization:
Performing gradient-based optimization:
Iteration 0:   log likelihood = -2412.9798
Iteration 1:   log likelihood = -2412.9209
Iteration 2:   log likelihood = -2412.9208
Computing standard errors:
Mixed-effects ML regression                     Number of obs      =      6402
Group variable: id                              Number of groups   =       888
                                                Obs per group: min =         1
                                                               avg =       7.2
                                                               max =        13

                                                Wald chi2(5)       =    493.23
Log likelihood = -2412.9208                  Prob > chi2        =    0.0000
------------------------------------------------------------------------------
         lnw |      Coef.   Std. Err.      z    P>|z|     [95% Conf. Interval]
-------------+----------------------------------------------------------------
       hgc_9 |   .0399276   .0063491     6.29   0.000     .0274835    .0523717
         ue1 |  -.0161774   .0026484    -6.11   0.000    -.0213682   -.0109866
 ue_centert1 |   -.010309   .0019445    -5.30   0.000    -.0141201    -.006498
       exper |   .0447649   .0026249    17.05   0.000     .0396202    .0499096
      bexper |  -.0183238   .0044848    -4.09   0.000    -.0271138   -.0095338
       _cons |   1.869345   .0260316    71.81   0.000     1.818324    1.920366
------------------------------------------------------------------------------
------------------------------------------------------------------------------
  Random-effects Parameters  |   Estimate   Std. Err.     [95% Conf. Interval]
-----------------------------+------------------------------------------------
id: Unstructured             |
                  var(exper) |   .0016354   .0002129      .0012672    .0021107
                  var(_cons) |   .0502771   .0047894      .0417143    .0605976
            cov(exper,_cons) |  -.0029024   .0008381      -.004545   -.0012598
-----------------------------+------------------------------------------------
               var(Residual) |   .0947669   .0019371      .0910452    .0986406
------------------------------------------------------------------------------
LR test vs. linear regression:       chi2(3) =  1423.82   Prob > chi2 = 0.0000
Note: LR test is conservative and provided only for reference
Table 5.10 on page 184 using medication_pp data
Model A: TIME
use https://stats.idre.ucla.edu/stat/stata/examples/alda/data/medication_pp, clear
gen ttime = treat*time
mixed pos treat time ttime || id: time, cov(un)
Performing EM optimization:
Performing gradient-based optimization:
Iteration 0:   log likelihood = -6340.2258
Iteration 1:   log likelihood = -6340.2258
Computing standard errors:
Mixed-effects ML regression                     Number of obs      =      1242
Group variable: id                              Number of groups   =        64
                                                Obs per group: min =         2
                                                               avg =      19.4
                                                               max =        21

                                                Wald chi2(3)       =      7.05
Log likelihood = -6340.2258                  Prob > chi2        =    0.0702
------------------------------------------------------------------------------
         pos |      Coef.   Std. Err.      z    P>|z|     [95% Conf. Interval]
-------------+----------------------------------------------------------------
       treat |  -3.109294   12.33256    -0.25   0.801    -27.28067    21.06208
        time |  -2.418128   1.730852    -1.40   0.162    -5.810535    .9742796
       ttime |    5.53681   2.277846     2.43   0.015     1.072314    10.00131
       _cons |   167.4635    9.32626    17.96   0.000     149.1843    185.7426
------------------------------------------------------------------------------
------------------------------------------------------------------------------
  Random-effects Parameters  |   Estimate   Std. Err.     [95% Conf. Interval]
-----------------------------+------------------------------------------------
id: Unstructured             |
                   var(time) |   63.73588   14.27148      41.09476     98.8511
                  var(_cons) |   2111.401   420.2165      1429.428    3118.739
             cov(time,_cons) |  -121.6214   59.03397     -237.3259   -5.916964
-----------------------------+------------------------------------------------
               var(Residual) |    1229.93   52.09137      1131.955    1336.384
------------------------------------------------------------------------------
LR test vs. linear regression:       chi2(3) =   971.31   Prob > chi2 = 0.0000
Note: LR test is conservative and provided only for reference
Model B: TIME-3.33
gen ttime333 = treat*time333
mixed pos treat time333 ttime333 || id: time333, cov(un)
Performing EM optimization:
Performing gradient-based optimization:
Iteration 0:   log likelihood = -6340.2258
Iteration 1:   log likelihood = -6340.2258
Computing standard errors:
Mixed-effects ML regression                     Number of obs      =      1242
Group variable: id                              Number of groups   =        64
                                                Obs per group: min =         2
                                                               avg =      19.4
                                                               max =        21

                                                Wald chi2(3)       =      7.05
Log likelihood = -6340.2258                  Prob > chi2        =    0.0702
------------------------------------------------------------------------------
         pos |      Coef.   Std. Err.      z    P>|z|     [95% Conf. Interval]
-------------+----------------------------------------------------------------
       treat |   15.34674   11.54466     1.33   0.184    -7.280383    37.97386
     time333 |  -2.418128   1.730852    -1.40   0.162    -5.810535    .9742798
    ttime333 |   5.536811   2.277846     2.43   0.015     1.072314    10.00131
       _cons |    159.403   8.764519    18.19   0.000     142.2249    176.5812
------------------------------------------------------------------------------
------------------------------------------------------------------------------
  Random-effects Parameters  |   Estimate   Std. Err.     [95% Conf. Interval]
-----------------------------+------------------------------------------------
id: Unstructured             |
                var(time333) |   63.73589   14.27147      41.09478    98.85109
                  var(_cons) |   2008.768   367.2589      1403.804     2874.44
          cov(time333,_cons) |    90.8317   52.45916     -11.98636    193.6498
-----------------------------+------------------------------------------------
               var(Residual) |   1229.929   52.09137      1131.955    1336.384
------------------------------------------------------------------------------
LR test vs. linear regression:       chi2(3) =   971.31   Prob > chi2 = 0.0000
Note: LR test is conservative and provided only for reference
Model C: TIME-6.67
gen ttime667 = treat*time667
mixed pos treat time667 ttime667 || id: time667, cov(un)
Performing EM optimization:
Performing gradient-based optimization:
Iteration 0:   log likelihood = -6340.2258
Iteration 1:   log likelihood = -6340.2258
Computing standard errors:
Mixed-effects ML regression                     Number of obs      =      1242
Group variable: id                              Number of groups   =        64
                                                Obs per group: min =         2
                                                               avg =      19.4
                                                               max =        21

                                                Wald chi2(3)       =      7.05
Log likelihood = -6340.2258                  Prob > chi2        =    0.0702
------------------------------------------------------------------------------
         pos |      Coef.   Std. Err.      z    P>|z|     [95% Conf. Interval]
-------------+----------------------------------------------------------------
       treat |   33.80278    15.1581     2.23   0.026     4.093444    63.51211
     time667 |  -2.418128   1.730852    -1.40   0.162    -5.810535    .9742797
    ttime667 |   5.536811   2.277846     2.43   0.015     1.072314    10.00131
       _cons |   151.3426   11.54247    13.11   0.000     128.7198    173.9654
------------------------------------------------------------------------------
------------------------------------------------------------------------------
  Random-effects Parameters  |   Estimate   Std. Err.     [95% Conf. Interval]
-----------------------------+------------------------------------------------
id: Unstructured             |
                var(time667) |   63.73588   14.27144      41.09481    98.85099
                  var(_cons) |   3322.485   632.1168      2288.328    4824.004
          cov(time667,_cons) |   303.2845   80.90138      144.7207    461.8483
-----------------------------+------------------------------------------------
               var(Residual) |    1229.93   52.09138      1131.955    1336.384
------------------------------------------------------------------------------
LR test vs. linear regression:       chi2(3) =   971.31   Prob > chi2 = 0.0000
Note: LR test is conservative and provided only for reference
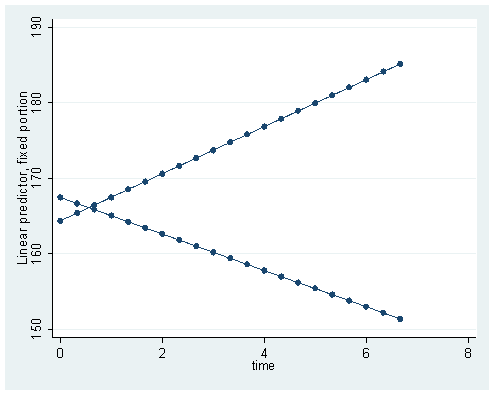
Figure 5.5 on page 185
mixed pos treat time ttime || id: time, cov(un)
Performing EM optimization:
Performing gradient-based optimization:
Iteration 0:   log likelihood = -6340.2258
Iteration 1:   log likelihood = -6340.2258<
Computing standard errors:
Mixed-effects ML regression                     Number of obs      =      1242
Group variable: id                              Number of groups   =        64
                                                Obs per group: min =         2
                                                               avg =      19.4
                                                               max =        21

                                                Wald chi2(3)       =      7.05
Log likelihood = -6340.2258                     Prob > chi2        =    0.0702
------------------------------------------------------------------------------
         pos |      Coef.   Std. Err.      z    P>|z|     [95% Conf. Interval]
-------------+----------------------------------------------------------------
       treat |  -3.109294   12.33256    -0.25   0.801    -27.28067    21.06208
        time |  -2.418128   1.730852    -1.40   0.162    -5.810535    .9742796
       ttime |    5.53681   2.277846     2.43   0.015     1.072314    10.00131
       _cons |   167.4635    9.32626    17.96   0.000     149.1843    185.7426
------------------------------------------------------------------------------
------------------------------------------------------------------------------
  Random-effects Parameters  |   Estimate   Std. Err.     [95% Conf. Interval]
-----------------------------+------------------------------------------------
id: Unstructured             |
                   var(time) |   63.73588   14.27148      41.09476     98.8511
                  var(_cons) |   2111.401   420.2165      1429.428    3118.739
             cov(time,_cons) |  -121.6214   59.03397     -237.3259   -5.916964
-----------------------------+------------------------------------------------
               var(Residual) |    1229.93   52.09137      1131.955    1336.384
------------------------------------------------------------------------------
LR test vs. linear regression:       chi2(3) =   971.31   Prob > chi2 = 0.0000
Note: LR test is conservative and provided only for reference
predict pf
(option xb assumed)
scatter pf time, c(L)
Page 188 on modeling initial and final status
mixed pos initial tinit final tfinal, nocons || id: initial final, cov(un) nocons
Performing EM optimization:
Performing gradient-based optimization:
Iteration 0:   log likelihood = -6340.2258
Iteration 1:   log likelihood = -6340.2258
Computing standard errors:
Mixed-effects ML regression                     Number of obs      =      1242
Group variable: id                              Number of groups   =        64
                                                Obs per group: min =         2
                                                               avg =      19.4
                                                               max =        21

                                                Wald chi2(4)       =    912.52
Log likelihood = -6340.2258                     Prob > chi2        =    0.0000
------------------------------------------------------------------------------ pos | Coef. Std. Err. z P>|z| [95% Conf. Interval] -------------+---------------------------------------------------------------- initial | 167.4635 9.326258 17.96 0.000 149.1843 185.7426 tinit | -3.109296 12.33256 -0.25 0.801 -27.28066 21.06207 final | 151.3426 11.54248 13.11 0.000 128.7198 173.9654 tfinal | 33.80278 15.1581 2.23 0.026 4.093439 63.51211 ------------------------------------------------------------------------------ ------------------------------------------------------------------------------ Random-effects Parameters | Estimate Std. Err. [95% Conf. Interval] -----------------------------+------------------------------------------------ id: Unstructured | var(initial) | 2111.399 420.2156 1429.428 3118.735 var(final) | 3322.486 632.1178 2288.328 4824.009 cov(initial,final) | 1300.589 392.7855 530.7431 2070.434 -----------------------------+------------------------------------------------ var(Residual) | 1229.93 52.09137 1131.955 1336.384 ------------------------------------------------------------------------------ LR test vs. linear regression: chi2(3) = 971.31 Prob > chi2 = 0.0000 Note: LR test is conservative and provided only for reference estat recov, corr Random-effects correlation matrix for level id | initial final -------------+---------------------- initial | 1 final | .4910471 1

