Table 5.1, page 150.
use uis.dta, clear

gen ndrgfp1 = ((ndrugtx+1)/10)^(-1)
gen ndrgfp2 = ndrgfp1*log((ndrugtx+1)/10)
gen agendrgfp1 = age*ndrgfp1
gen racesite = race*site
quietly logit dfree age ndrgfp1 ndrgfp2 ivhx2 ivhx3 race treat site agendrgfp1 racesite

* Stata 8 code.
lfit, table group(10)

* Stata 9 code and output.
estat gof, table group(10)

Logistic model for dfree, goodness-of-fit test

  (Table collapsed on quantiles of estimated probabilities)
  +--------------------------------------------------------+
  | Group |   Prob | Obs_1 | Exp_1 | Obs_0 | Exp_0 | Total |
  |-------+--------+-------+-------+-------+-------+-------|
  |     1 | 0.0939 |     4 |   4.1 |    54 |  53.9 |    58 |
  |     2 | 0.1261 |     5 |   6.2 |    52 |  50.8 |    57 |
  |     3 | 0.1631 |     8 |   8.5 |    50 |  49.5 |    58 |
  |     4 | 0.2036 |    11 |  10.4 |    46 |  46.6 |    57 |
  |     5 | 0.2335 |    16 |  12.7 |    42 |  45.3 |    58 |
  |-------+--------+-------+-------+-------+-------+-------|
  |     6 | 0.2788 |    11 |  14.5 |    46 |  42.5 |    57 |
  |     7 | 0.3240 |    18 |  17.5 |    40 |  40.5 |    58 |
  |     8 | 0.3764 |    24 |  19.8 |    33 |  37.2 |    57 |
  |     9 | 0.4590 |    23 |  23.9 |    35 |  34.1 |    58 |
  |    10 | 0.7283 |    27 |  29.3 |    30 |  27.7 |    57 |
  +--------------------------------------------------------+

       number of observations =       575
             number of groups =        10
      Hosmer-Lemeshow chi2(8) =         4.39
                  Prob > chi2 =         0.8199
Table 5.2, page 157.
* Stata 8 code.
lstat

* Stata 9 code and output.
estat classification

Logistic model for dfree

              -------- True --------
Classified |         D            ~D  |      Total
-----------+--------------------------+-----------
     +     |        16            11  |         27
     -     |       131           417  |        548
-----------+--------------------------+-----------
   Total   |       147           428  |        575

Classified + if predicted Pr(D) >= .5
True D defined as dfree ~= 0
--------------------------------------------------
Sensitivity                     Pr( +| D)   10.88%
Specificity                     Pr( -|~D)   97.43%
Positive predictive value       Pr( D| +)   59.26%
Negative predictive value       Pr(~D| -)   76.09%
--------------------------------------------------
False + rate for true ~D        Pr( +|~D)    2.57%
False - rate for true D         Pr( -| D)   89.12%
False + rate for classified +   Pr(~D| +)   40.74%
False - rate for classified -   Pr( D| -)   23.91%
--------------------------------------------------
Correctly classified                        75.30%
--------------------------------------------------
Table 5.3, page 159.
NOTE: We could not recreate this table.
Table 5.4, page 160.
NOTE: We could not recreate this table.
Table 5.5, page 161.
quietly logit dfree age ndrgfp1 ndrgfp2 ivhx2 ivhx3 race treat site agendrgfp1 racesite

* Stata 8 code.
lstat, cutoff(.6)

* Stata 9 code and output.
estat classification, cutoff(.6)

Logistic model for dfree

              -------- True --------
Classified |         D            ~D  |      Total
-----------+--------------------------+-----------
     +     |         5             0  |          5
     -     |       142           428  |        570
-----------+--------------------------+-----------
   Total   |       147           428  |        575

Classified + if predicted Pr(D) >= .6
True D defined as dfree ~= 0
--------------------------------------------------
Sensitivity                     Pr( +| D)    3.40%
Specificity                     Pr( -|~D)  100.00%
Positive predictive value       Pr( D| +)  100.00%
Negative predictive value       Pr(~D| -)   75.09%
--------------------------------------------------
False + rate for true ~D        Pr( +|~D)    0.00%
False - rate for true D         Pr( -| D)   96.60%
False + rate for classified +   Pr(~D| +)    0.00%
False - rate for classified -   Pr( D| -)   24.91%
--------------------------------------------------
Correctly classified                        75.30%
--------------------------------------------------
Table 5.6, page 161.
quietly logit dfree age ndrgfp1 ndrgfp2 ivhx2 ivhx3 race treat site agendrgfp1 racesite

* Stata 8 code.
lstat, cutoff(.05)

* Stata 9 code and output.
estat classification, cutoff(.05)

Logistic model for dfree

              -------- True --------
Classified |         D            ~D  |      Total
-----------+--------------------------+-----------
     +     |       146           417  |        563
     -     |         1            11  |         12
-----------+--------------------------+-----------
   Total   |       147           428  |        575

Classified + if predicted Pr(D) >= .05
True D defined as dfree ~= 0
--------------------------------------------------
Sensitivity                     Pr( +| D)   99.32%
Specificity                     Pr( -|~D)    2.57%
Positive predictive value       Pr( D| +)   25.93%
Negative predictive value       Pr(~D| -)   91.67%
--------------------------------------------------
False + rate for true ~D        Pr( +|~D)   97.43%
False - rate for true D         Pr( -| D)    0.68%
False + rate for classified +   Pr(~D| +)   74.07%
False - rate for classified -   Pr( D| -)    8.33%
--------------------------------------------------
Correctly classified                        27.30%
--------------------------------------------------

* Stata 8 code.
lstat, cutoff(.1)

* Stata 9 code and output.
estat classification, cutoff(.1)

Logistic model for dfree

              -------- True --------
Classified |         D            ~D  |      Total
-----------+--------------------------+-----------
     +     |       141           363  |        504
     -     |         6            65  |         71
-----------+--------------------------+-----------
   Total   |       147           428  |        575

Classified + if predicted Pr(D) >= .1
True D defined as dfree ~= 0
--------------------------------------------------
Sensitivity                     Pr( +| D)   95.92%
Specificity                     Pr( -|~D)   15.19%
Positive predictive value       Pr( D| +)   27.98%
Negative predictive value       Pr(~D| -)   91.55%
--------------------------------------------------
False + rate for true ~D        Pr( +|~D)   84.81%
False - rate for true D         Pr( -| D)    4.08%
False + rate for classified +   Pr(~D| +)   72.02%
False - rate for classified -   Pr( D| -)    8.45%
--------------------------------------------------
Correctly classified                        35.83%
--------------------------------------------------

* Stata 8 code.
lstat, cutoff(.15)

* Stata 9 code and output.
estat classification, cutoff(.15)

Logistic model for dfree

              -------- True --------
Classified |         D            ~D  |      Total
-----------+--------------------------+-----------
     +     |       133           292  |        425
     -     |        14           136  |        150
-----------+--------------------------+-----------
   Total   |       147           428  |        575

Classified + if predicted Pr(D) >= .15
True D defined as dfree ~= 0
--------------------------------------------------
Sensitivity                     Pr( +| D)   90.48%
Specificity                     Pr( -|~D)   31.78%
Positive predictive value       Pr( D| +)   31.29%
Negative predictive value       Pr(~D| -)   90.67%
--------------------------------------------------
False + rate for true ~D        Pr( +|~D)   68.22%
False - rate for true D         Pr( -| D)    9.52%
False + rate for classified +   Pr(~D| +)   68.71%
False - rate for classified -   Pr( D| -)    9.33%
--------------------------------------------------
Correctly classified                        46.78%
--------------------------------------------------

* Stata 8 code.
lstat, cutoff(.2)

* Stata 9 code and output.
estat classification, cutoff(.2)

Logistic model for dfree

              -------- True --------
Classified |         D            ~D  |      Total
-----------+--------------------------+-----------
     +     |       120           230  |        350
     -     |        27           198  |        225
-----------+--------------------------+-----------
   Total   |       147           428  |        575

Classified + if predicted Pr(D) >= .2
True D defined as dfree ~= 0
--------------------------------------------------
Sensitivity                     Pr( +| D)   81.63%
Specificity                     Pr( -|~D)   46.26%
Positive predictive value       Pr( D| +)   34.29%
Negative predictive value       Pr(~D| -)   88.00%
--------------------------------------------------
False + rate for true ~D        Pr( +|~D)   53.74%
False - rate for true D         Pr( -| D)   18.37%
False + rate for classified +   Pr(~D| +)   65.71%
False - rate for classified -   Pr( D| -)   12.00%
--------------------------------------------------
Correctly classified                        55.30%
--------------------------------------------------

* Stata 8 code.
lstat, cutoff(.25)

* Stata 9 code and output.
estat classification, cutoff(.25)

Logistic model for dfree

              -------- True --------
Classified |         D            ~D  |      Total
-----------+--------------------------+-----------
     +     |        97           166  |        263
     -     |        50           262  |        312
-----------+--------------------------+-----------
   Total   |       147           428  |        575

Classified + if predicted Pr(D) >= .25
True D defined as dfree ~= 0
--------------------------------------------------
Sensitivity                     Pr( +| D)   65.99%
Specificity                     Pr( -|~D)   61.21%
Positive predictive value       Pr( D| +)   36.88%
Negative predictive value       Pr(~D| -)   83.97%
--------------------------------------------------
False + rate for true ~D        Pr( +|~D)   38.79%
False - rate for true D         Pr( -| D)   34.01%
False + rate for classified +   Pr(~D| +)   63.12%
False - rate for classified -   Pr( D| -)   16.03%
--------------------------------------------------
Correctly classified                        62.43%
--------------------------------------------------

* Stata 8 code.
lstat, cutoff(.3)

* Stata 9 code and output.
estat classification, cutoff(.3)

Logistic model for dfree

              -------- True --------
Classified |         D            ~D  |      Total
-----------+--------------------------+-----------
     +     |        84           119  |        203
     -     |        63           309  |        372
-----------+--------------------------+-----------
   Total   |       147           428  |        575

Classified + if predicted Pr(D) >= .3
True D defined as dfree ~= 0
--------------------------------------------------
Sensitivity                     Pr( +| D)   57.14%
Specificity                     Pr( -|~D)   72.20%
Positive predictive value       Pr( D| +)   41.38%
Negative predictive value       Pr(~D| -)   83.06%
--------------------------------------------------
False + rate for true ~D        Pr( +|~D)   27.80%
False - rate for true D         Pr( -| D)   42.86%
False + rate for classified +   Pr(~D| +)   58.62%
False - rate for classified -   Pr( D| -)   16.94%
--------------------------------------------------
Correctly classified                        68.35%
--------------------------------------------------

* Stata 8 code.
lstat, cutoff(.35)

* Stata 9 code and output.
estat classification, cutoff(.35)

Logistic model for dfree

              -------- True --------
Classified |         D            ~D  |      Total
-----------+--------------------------+-----------
     +     |        59            77  |        136
     -     |        88           351  |        439
-----------+--------------------------+-----------
   Total   |       147           428  |        575

Classified + if predicted Pr(D) >= .35
True D defined as dfree ~= 0
--------------------------------------------------
Sensitivity                     Pr( +| D)   40.14%
Specificity                     Pr( -|~D)   82.01%
Positive predictive value       Pr( D| +)   43.38%
Negative predictive value       Pr(~D| -)   79.95%
--------------------------------------------------
False + rate for true ~D        Pr( +|~D)   17.99%
False - rate for true D         Pr( -| D)   59.86%
False + rate for classified +   Pr(~D| +)   56.62%
False - rate for classified -   Pr( D| -)   20.05%
--------------------------------------------------
Correctly classified                        71.30%
--------------------------------------------------

* Stata 8 code.
lstat, cutoff(.4)

* Stata 9 code and output.
estat classification, cutoff(.4)

Logistic model for dfree

              -------- True --------
Classified |         D            ~D  |      Total
-----------+--------------------------+-----------
     +     |        43            54  |         97
     -     |       104           374  |        478
-----------+--------------------------+-----------
   Total   |       147           428  |        575

Classified + if predicted Pr(D) >= .4
True D defined as dfree ~= 0
--------------------------------------------------
Sensitivity                     Pr( +| D)   29.25%
Specificity                     Pr( -|~D)   87.38%
Positive predictive value       Pr( D| +)   44.33%
Negative predictive value       Pr(~D| -)   78.24%
--------------------------------------------------
False + rate for true ~D        Pr( +|~D)   12.62%
False - rate for true D         Pr( -| D)   70.75%
False + rate for classified +   Pr(~D| +)   55.67%
False - rate for classified -   Pr( D| -)   21.76%
--------------------------------------------------
Correctly classified                        72.52%
--------------------------------------------------

* Stata 8 code.
lstat, cutoff(.45)

* Stata 9 code and output.
estat classification, cutoff(.45)

Logistic model for dfree

              -------- True --------
Classified |         D            ~D  |      Total
-----------+--------------------------+-----------
     +     |        27            34  |         61
     -     |       120           394  |        514
-----------+--------------------------+-----------
   Total   |       147           428  |        575

Classified + if predicted Pr(D) >= .45
True D defined as dfree ~= 0
--------------------------------------------------
Sensitivity                     Pr( +| D)   18.37%
Specificity                     Pr( -|~D)   92.06%
Positive predictive value       Pr( D| +)   44.26%
Negative predictive value       Pr(~D| -)   76.65%
--------------------------------------------------
False + rate for true ~D        Pr( +|~D)    7.94%
False - rate for true D         Pr( -| D)   81.63%
False + rate for classified +   Pr(~D| +)   55.74%
False - rate for classified -   Pr( D| -)   23.35%
--------------------------------------------------
Correctly classified                        73.22%
--------------------------------------------------

* Stata 8 code.
lstat, cutoff(.5)

* Stata 9 code and output.
estat classification, cutoff(.5)

Logistic model for dfree

              -------- True --------
Classified |         D            ~D  |      Total
-----------+--------------------------+-----------
     +     |        16            11  |         27
     -     |       131           417  |        548
-----------+--------------------------+-----------
   Total   |       147           428  |        575

Classified + if predicted Pr(D) >= .5
True D defined as dfree ~= 0
--------------------------------------------------
Sensitivity                     Pr( +| D)   10.88%
Specificity                     Pr( -|~D)   97.43%
Positive predictive value       Pr( D| +)   59.26%
Negative predictive value       Pr(~D| -)   76.09%
--------------------------------------------------
False + rate for true ~D        Pr( +|~D)    2.57%
False - rate for true D         Pr( -| D)   89.12%
False + rate for classified +   Pr(~D| +)   40.74%
False - rate for classified -   Pr( D| -)   23.91%
--------------------------------------------------
Correctly classified                        75.30%
--------------------------------------------------

* Stata 8 code.
lstat, cutoff(.55)

* Stata 9 code and output.
estat classification, cutoff(.55)

Logistic model for dfree

              -------- True --------
Classified |         D            ~D  |      Total
-----------+--------------------------+-----------
     +     |         8             3  |         11
     -     |       139           425  |        564
-----------+--------------------------+-----------
   Total   |       147           428  |        575

Classified + if predicted Pr(D) >= .55
True D defined as dfree ~= 0
--------------------------------------------------
Sensitivity                     Pr( +| D)    5.44%
Specificity                     Pr( -|~D)   99.30%
Positive predictive value       Pr( D| +)   72.73%
Negative predictive value       Pr(~D| -)   75.35%
--------------------------------------------------
False + rate for true ~D        Pr( +|~D)    0.70%
False - rate for true D         Pr( -| D)   94.56%
False + rate for classified +   Pr(~D| +)   27.27%
False - rate for classified -   Pr( D| -)   24.65%
--------------------------------------------------
Correctly classified                        75.30%
--------------------------------------------------

* Stata 8 code.
lstat, cutoff(.6)

* Stata 9 code and output.
estat classification, cutoff(.6)

Logistic model for dfree

              -------- True --------
Classified |         D            ~D  |      Total
-----------+--------------------------+-----------
     +     |         5             0  |          5
     -     |       142           428  |        570
-----------+--------------------------+-----------
   Total   |       147           428  |        575

Classified + if predicted Pr(D) >= .6
True D defined as dfree ~= 0
--------------------------------------------------
Sensitivity                     Pr( +| D)    3.40%
Specificity                     Pr( -|~D)  100.00%
Positive predictive value       Pr( D| +)  100.00%
Negative predictive value       Pr(~D| -)   75.09%
--------------------------------------------------
False + rate for true ~D        Pr( +|~D)    0.00%
False - rate for true D         Pr( -| D)   96.60%
False + rate for classified +   Pr(~D| +)    0.00%
False - rate for classified -   Pr( D| -)   24.91%
--------------------------------------------------
Correctly classified                        75.30%
--------------------------------------------------
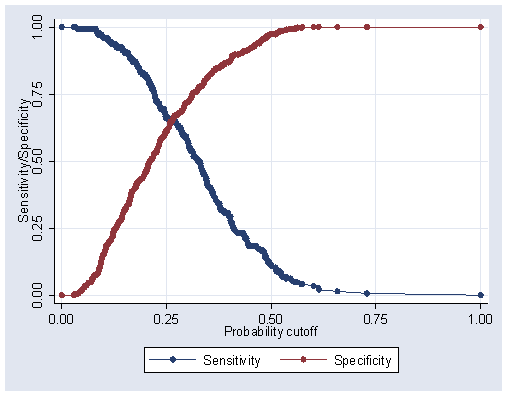
Figure 5.1, page 162.
lsens
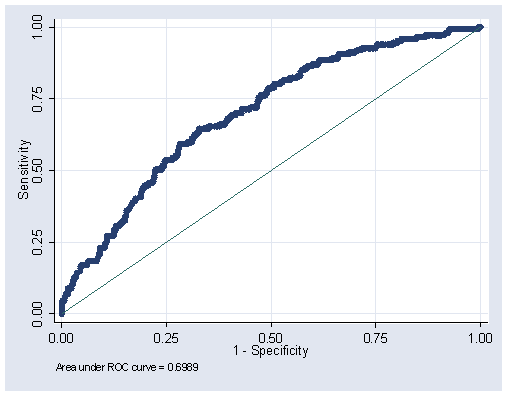
Figure 5.2, page 163.
lroc
Logistic model for dfree

number of observations =      575
area under ROC curve   =   0.6989
Figure 5.3, page 171.
NOTE: We cannot recreate this figure because we do not have the hypothetical data that were used.
Figure 5.4, page 172.
NOTE: We cannot recreate this figure because we do not have the hypothetical data that were used.
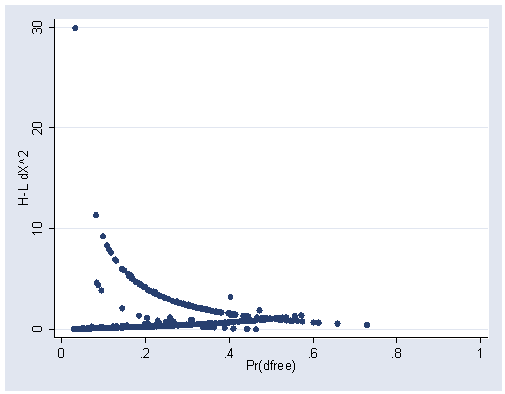
Figure 5.5, page 177.
logit dfree age ndrgfp1 ndrgfp2 ivhx2 ivhx3 race treat site agendrgfp1 racesite

Iteration 0:   log likelihood = -326.86446
Iteration 1:   log likelihood = -300.06724
Iteration 2:   log likelihood = -298.98837
Iteration 3:   log likelihood = -298.98146
Iteration 4:   log likelihood = -298.98146

Logit estimates                                   Number of obs   =        575
                                                  LR chi2(10)     =      55.77
                                                  Prob > chi2     =     0.0000
Log likelihood = -298.98146                       Pseudo R2       =     0.0853

------------------------------------------------------------------------------
       dfree |      Coef.   Std. Err.      z    P>|z|     [95% Conf. Interval]
-------------+----------------------------------------------------------------
         age |   .1166385   .0288749     4.04   0.000     .0600446    .1732323
     ndrgfp1 |   1.669035    .407152     4.10   0.000      .871032    2.467038
     ndrgfp2 |   .4336886   .1169052     3.71   0.000     .2045586    .6628185
       ivhx2 |  -.6346307   .2987192    -2.12   0.034    -1.220109   -.0491518
       ivhx3 |  -.7049475   .2615805    -2.69   0.007    -1.217636   -.1922591
        race |   .6841068   .2641355     2.59   0.010     .1664107    1.201803
       treat |   .4349255   .2037596     2.13   0.033      .035564     .834287
        site |    .516201   .2548881     2.03   0.043     .0166295    1.015773
  agendrgfp1 |  -.0152697   .0060268    -2.53   0.011    -.0270819   -.0034575
    racesite |  -1.429457   .5297806    -2.70   0.007    -2.467808   -.3911062
       _cons |  -6.843864   1.219316    -5.61   0.000     -9.23368   -4.454048
------------------------------------------------------------------------------

predict p
(option p assumed; Pr(dfree))

predict dx, dx2
graph twoway scatter dx p, xlabel(0(.2)1) ylabel(0(10)30)
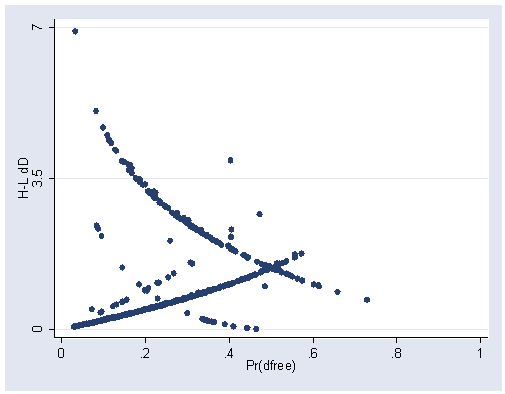
Figure 5.6, page 178.
predict dd, dd
graph twoway scatter dd p, xlabel(0(.2)1) ylabel(0 3.5 7)
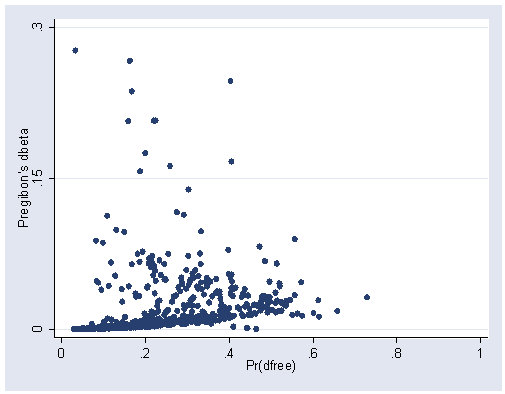
Figure 5.7, page 179.
predict db, db
graph twoway scatter db p, xlabel(0(.2)1) ylabel(0 .15 .3)
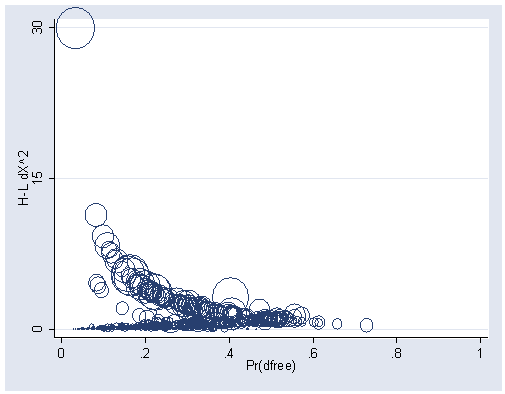
Figure 5.8, page 180.
graph twoway scatter dx p [weight=db], xlabel(0(.2)1) ylabel(0 15 30) msymbol(oh)
Table 5.8, page 182.
predict h, h
predict n, n
list age ndrugtx ivhx2 race treat site dfree n  p db dx dd h if n==31 | n==477 | n==105 | n==468
Covariate pattern 105
Observation 84

         age           26     ndrugtx            0       ivhx2            0
        race            1       treat            0        site            0
       dfree            1           n          105           p     .4030007
          db     .2462623          dx     3.191391          dd     3.915781
           h     .0716367
Covariate pattern 468
Observation 351

         age           40     ndrugtx            0       ivhx2            0
        race            1       treat            0        site            0
       dfree            1           n          468           p     .1675982
          db     .2363966          dx     5.192755          dd     3.735002
           h     .0435421
Covariate pattern 477
Observation 367

         age           41     ndrugtx            0       ivhx2            0
        race            1       treat            0        site            0
       dfree            1           n          477           p     .1626278
          db      .266626          dx     5.403098          dd     3.811839
           h     .0470263
Covariate pattern 31
Observation 519

         age           24     ndrugtx           20       ivhx2            1
        race            0       treat            0        site            1
       dfree            1           n           31           p     .0326259
          db     .2768316          dx     29.92479          dd     6.908623
           h     .0091661
Covariate pattern 105
Observation 548

         age           26     ndrugtx            0       ivhx2            0
        race            1       treat            0        site            0
       dfree            1           n          105           p     .4030007
          db     .2462623          dx     3.191391          dd     3.915781
           h     .0716367
NOTE: There are five cases listed because covariate pattern 105 has two cases; only one of them is listed in the text.
Table 5.9, page 183.
NOTE: The goodness-of-fit values at the bottom of the table are not percent change; they are the actual values obtained from the goodness-of-fit tests.
NOTE: Use the ldev command to get the D value. Use the lfit, group(10) command to get the chi-square value. Use the lfit command to get the C-hat value. All data (note that this column contains the coefficients from the logit):
logit dfree age ndrgfp1 ndrgfp2 ivhx2 ivhx3 race treat site agendrgfp1 racesite

Iteration 0:   log likelihood = -326.86446
Iteration 1:   log likelihood = -300.06724
Iteration 2:   log likelihood = -298.98837
Iteration 3:   log likelihood = -298.98146
Iteration 4:   log likelihood = -298.98146

Logit estimates                                   Number of obs   =        575
                                                  LR chi2(10)     =      55.77
                                                  Prob > chi2     =     0.0000
Log likelihood = -298.98146                       Pseudo R2       =     0.0853

------------------------------------------------------------------------------
       dfree |      Coef.   Std. Err.      z    P>|z|     [95% Conf. Interval]
-------------+----------------------------------------------------------------
         age |   .1166385   .0288749     4.04   0.000     .0600446    .1732323
     ndrgfp1 |   1.669035    .407152     4.10   0.000      .871032    2.467038
     ndrgfp2 |   .4336886   .1169052     3.71   0.000     .2045586    .6628185
       ivhx2 |  -.6346307   .2987192    -2.12   0.034    -1.220109   -.0491518
       ivhx3 |  -.7049475   .2615805    -2.69   0.007    -1.217636   -.1922591
        race |   .6841068   .2641355     2.59   0.010     .1664107    1.201803
       treat |   .4349255   .2037596     2.13   0.033      .035564     .834287
        site |    .516201   .2548881     2.03   0.043     .0166295    1.015773
  agendrgfp1 |  -.0152697   .0060268    -2.53   0.011    -.0270819   -.0034575
    racesite |  -1.429457   .5297806    -2.70   0.007    -2.467808   -.3911062
       _cons |  -6.843864   1.219316    -5.61   0.000     -9.23368   -4.454048
------------------------------------------------------------------------------

* Stata 8 code.
lfit

* Stata 9 code and output.
estat gof

Logistic model for dfree, goodness-of-fit test

       number of observations =       575
 number of covariate patterns =       521
            Pearson chi2(510) =       511.78
                  Prob > chi2 =         0.4695
The ldev command can be installed from the ATS web site by typing search ldev (see How can I use the search command to search for programs and get additional help? for more information about using search).
ldev

Logistic model deviance goodness-of-fit test

         number of observations =     575
   number of covariate patterns =     521
       deviance goodness-of-fit =     530.74
             degrees of freedom =     510
                    Prob > chi2 =       0.2541

* Stata 8 code.
lfit, group(10) table

* Stata 9 code and output.
estat gof, group(10) table

Logistic model for dfree, goodness-of-fit test
(Table collapsed on quantiles of estimated probabilities)

_Group     _Prob     _Obs_1     _Exp_1     _Obs_0     _Exp_0     _Total
     1    0.0939          4        4.1         54       53.9         58
     2    0.1261          5        6.2         52       50.8         57
     3    0.1631          8        8.5         50       49.5         58
     4    0.2036         11       10.4         46       46.6         57
     5    0.2335         16       12.7         42       45.3         58
     6    0.2788         11       14.5         46       42.5         57
     7    0.3240         18       17.5         40       40.5         58
     8    0.3764         24       19.8         33       37.2         57
     9    0.4590         23       23.9         35       34.1         58
    10    0.7283         27       29.3         30       27.7         57

       number of observations =       575
             number of groups =        10
      Hosmer-Lemeshow chi2(8) =         4.39
                  Prob > chi2 =         0.8199
Deleting covariate pattern 31 (note that this column contains percent change between the coefficients from the two logits).
logit dfree age ndrgfp1 ndrgfp2 ivhx2 ivhx3 race treat site agendrgfp1 racesite if n!=31

Iteration 0:   log likelihood = -325.49798
Iteration 1:   log likelihood =  -296.7082
Iteration 2:   log likelihood = -295.42918
Iteration 3:   log likelihood = -295.41908
Iteration 4:   log likelihood = -295.41908

Logit estimates                                   Number of obs   =        574
                                                  LR chi2(10)     =      60.16
                                                  Prob > chi2     =     0.0000
Log likelihood = -295.41908                       Pseudo R2       =     0.0924

------------------------------------------------------------------------------
       dfree |      Coef.   Std. Err.      z    P>|z|     [95% Conf. Interval]
-------------+----------------------------------------------------------------
         age |   .1269757   .0294627     4.31   0.000     .0692298    .1847216
     ndrgfp1 |   1.829975   .4173235     4.39   0.000     1.012036    2.647914
     ndrgfp2 |   .4746444   .1190842     3.99   0.000     .2412436    .7080452
       ivhx2 |  -.6904163   .3028271    -2.28   0.023    -1.283947    -.096886
       ivhx3 |   -.708751   .2629679    -2.70   0.007    -1.224159   -.1933435
        race |   .6927178   .2656414     2.61   0.009     .1720703    1.213365
       treat |   .4574146   .2052736     2.23   0.026     .0550858    .8597434
        site |   .4873447    .257198     1.89   0.058    -.0167541    .9914435
  agendrgfp1 |  -.0167797   .0061338    -2.74   0.006    -.0288017   -.0047577
    racesite |  -1.422103   .5322418    -2.67   0.008    -2.465278   -.3789279
       _cons |  -7.372811   1.253245    -5.88   0.000    -9.829126   -4.916496
------------------------------------------------------------------------------

* Stata 8 code.
lfit

* Stata 9 code and output.
estat gof

Logistic model for dfree, goodness-of-fit test

       number of observations =       574
 number of covariate patterns =       520
            Pearson chi2(509) =       489.94
                  Prob > chi2 =         0.7204

ldev
(1 missing value generated)
(1 missing value generated)
(1 missing value generated)

Logistic model deviance goodness-of-fit test

         number of observations =     574
   number of covariate patterns =     520
       deviance goodness-of-fit =     523.62
             degrees of freedom =     509
                    Prob > chi2 =       0.3175

* Stata 8 code.
lfit, group(10) table

* Stata 9 code and output.
estat gof, group(10) table

Logistic model for dfree, goodness-of-fit test
(Table collapsed on quantiles of estimated probabilities)

_Group     _Prob     _Obs_1     _Exp_1     _Obs_0     _Exp_0     _Total
     1    0.0872          3        3.8         55       54.2         58
     2    0.1217          5        5.9         52       51.1         57
     3    0.1578          7        8.2         51       49.8         58
     4    0.1999         14       10.3         44       47.7         58
     5    0.2322         14       12.1         42       43.9         56
     6    0.2725         11       14.6         47       43.4         58
     7    0.3247         21       17.2         36       39.8         57
     8    0.3775         21       20.3         37       37.7         58
     9    0.4602         23       23.8         34       33.2         57
    10    0.7480         27       29.9         30       27.1         57

       number of observations =       574
             number of groups =        10
      Hosmer-Lemeshow chi2(8) =         5.55
                  Prob > chi2 =         0.6973

di (.1269757-.1166385)
.0103372

di (.0103372/.1166385)*100
8.8625968
NOTE: We will not show all of the rest of the percent change calculations; they can be obtained in the same way as above.
Deleting covariate pattern 477.
logit dfree age ndrgfp1 ndrgfp2 ivhx2 ivhx3 race treat site agendrgfp1 racesite if n!=477

Iteration 0:   log likelihood = -325.49798
Iteration 1:   log likelihood = -298.19394
Iteration 2:   log likelihood = -297.04285
Iteration 3:   log likelihood = -297.03469
Iteration 4:   log likelihood = -297.03469

Logit estimates                                   Number of obs   =        574
                                                  LR chi2(10)     =      56.93
                                                  Prob > chi2     =     0.0000
Log likelihood = -297.03469                       Pseudo R2       =     0.0874

------------------------------------------------------------------------------
       dfree |      Coef.   Std. Err.      z    P>|z|     [95% Conf. Interval]
-------------+----------------------------------------------------------------
         age |   .1228473   .0293551     4.18   0.000     .0653123    .1803822
     ndrgfp1 |    1.77494   .4183485     4.24   0.000      .954992    2.594888
     ndrgfp2 |     .45136   .1183443     3.81   0.000     .2194095    .6833106
       ivhx2 |  -.6374841   .2990411    -2.13   0.033    -1.223594   -.0513744
       ivhx3 |  -.7445476   .2636286    -2.82   0.005     -1.26125   -.2278452
        race |   .6441888   .2660551     2.42   0.015     .1227304    1.165647
       treat |   .4503906   .2045379     2.20   0.028     .0495036    .8512776
        site |   .5162495   .2553121     2.02   0.043      .015847    1.016652
  agendrgfp1 |  -.0175048   .0062929    -2.78   0.005    -.0298386    -.005171
    racesite |  -1.377475   .5319126    -2.59   0.010    -2.420005   -.3349456
       _cons |  -7.070646   1.240009    -5.70   0.000    -9.501018   -4.640273
------------------------------------------------------------------------------

* Stata 8 code.
lfit

* Stata 9 code and output.
estat gof

Logistic model for dfree, goodness-of-fit test

       number of observations =       574
 number of covariate patterns =       520
            Pearson chi2(509) =       511.57
                  Prob > chi2 =         0.4597

ldev
(1 missing value generated)
(1 missing value generated)
(1 missing value generated)

Logistic model deviance goodness-of-fit test

         number of observations =     574
   number of covariate patterns =     520
       deviance goodness-of-fit =     526.85
             degrees of freedom =     509
                    Prob > chi2 =       0.2830

* Stata 8 code.
lfit, group(10) table

* Stata 9 code and output.
estat gof, group(10) table

Logistic model for dfree, goodness-of-fit test
(Table collapsed on quantiles of estimated probabilities)

_Group     _Prob     _Obs_1     _Exp_1     _Obs_0     _Exp_0     _Total
     1    0.0895          4        3.9         54       54.1         58
     2    0.1232          5        6.1         52       50.9         57
     3    0.1625          8        8.4         50       49.6         58
     4    0.2008         11       10.3         46       46.7         57
     5    0.2337         16       12.4         41       44.6         57
     6    0.2756          9       14.8         49       43.2         58
     7    0.3244         20       17.1         37       39.9         57
     8    0.3736         23       20.3         35       37.7         58
     9    0.4559         23       23.5         34       33.5         57
    10    0.7428         27       29.3         30       27.7         57

       number of observations =       574
             number of groups =        10
      Hosmer-Lemeshow chi2(8) =         6.36
                  Prob > chi2 =         0.6074
Deleting covariate pattern 105.
logit dfree age ndrgfp1 ndrgfp2 ivhx2 ivhx3 race treat site agendrgfp1 racesite if n!=105

Iteration 0:   log likelihood =  -324.1264
Iteration 1:   log likelihood =  -298.0818
Iteration 2:   log likelihood =  -297.0549
Iteration 3:   log likelihood = -297.04873
Iteration 4:   log likelihood = -297.04873

Logit estimates                                   Number of obs   =        573
                                                  LR chi2(10)     =      54.16
                                                  Prob > chi2     =     0.0000
Log likelihood = -297.04873                       Pseudo R2       =     0.0835

------------------------------------------------------------------------------
       dfree |      Coef.   Std. Err.      z    P>|z|     [95% Conf. Interval]
-------------+----------------------------------------------------------------
         age |   .1134016   .0288724     3.93   0.000     .0568126    .1699905
     ndrgfp1 |   1.642961   .4065219     4.04   0.000     .8461929     2.43973
     ndrgfp2 |    .442747   .1170361     3.78   0.000     .2133604    .6721336
       ivhx2 |  -.6368155   .2992244    -2.13   0.033    -1.223285   -.0503465
       ivhx3 |  -.7046331   .2620011    -2.69   0.007    -1.218146   -.1911204
        race |   .6258739   .2671909     2.34   0.019     .1021893    1.149558
       treat |   .4669661   .2049928     2.28   0.023     .0651876    .8687445
        site |   .5309903   .2550417     2.08   0.037     .0311177    1.030863
  agendrgfp1 |  -.0139969   .0060693    -2.31   0.021    -.0258925   -.0021013
    racesite |  -1.370085    .531162    -2.58   0.010    -2.411144    -.329027
       _cons |  -6.756569   1.216512    -5.55   0.000    -9.140889    -4.37225
------------------------------------------------------------------------------

* Stata 8 code.
lfit

* Stata 9 code and output.
estat gof

Logistic model for dfree, goodness-of-fit test

       number of observations =       573
 number of covariate patterns =       520
            Pearson chi2(509) =       508.70
                  Prob > chi2 =         0.4954

ldev
(2 missing values generated)
(2 missing values generated)
(2 missing values generated)

Logistic model deviance goodness-of-fit test

         number of observations =     573
   number of covariate patterns =     520
       deviance goodness-of-fit =     526.88
             degrees of freedom =     509
                    Prob > chi2 =       0.2828

* Stata 8 code.
lfit, group(10) table

* Stata 9 code and output.
estat gof, group(10) table

Logistic model for dfree, goodness-of-fit test
(Table collapsed on quantiles of estimated probabilities)

_Group     _Prob     _Obs_1     _Exp_1     _Obs_0     _Exp_0     _Total
     1    0.0947          4        4.1         54       53.9         58
     2    0.1256          6        6.3         51       50.7         57
     3    0.1640          8        8.4         49       48.6         57
     4    0.2022          9       10.5         49       47.5         58
     5    0.2330         17       12.4         40       44.6         57
     6    0.2815         10       14.4         47       42.6         57
     7    0.3198         20       17.3         38       40.7         58
     8    0.3601         23       19.4         34       37.6         57
     9    0.4532         22       23.3         35       33.7         57
    10    0.7128         26       29.0         31       28.0         57

       number of observations =       573
             number of groups =        10
      Hosmer-Lemeshow chi2(8) =         6.69
                  Prob > chi2 =         0.5705
Deleting covariate pattern 468.
logit dfree age ndrgfp1 ndrgfp2 ivhx2 ivhx3 race treat site agendrgfp1 racesite if n!=468

Iteration 0:   log likelihood = -325.49798
Iteration 1:   log likelihood = -298.23262
Iteration 2:   log likelihood = -297.08748
Iteration 3:   log likelihood = -297.07943
Iteration 4:   log likelihood = -297.07943

Logit estimates                                   Number of obs   =        574
                                                  LR chi2(10)     =      56.84
                                                  Prob > chi2     =     0.0000
Log likelihood = -297.07943                       Pseudo R2       =     0.0873

------------------------------------------------------------------------------
       dfree |      Coef.   Std. Err.      z    P>|z|     [95% Conf. Interval]
-------------+----------------------------------------------------------------
         age |   .1222986   .0293131     4.17   0.000      .064846    .1797511
     ndrgfp1 |   1.764847   .4173058     4.23   0.000     .9469426    2.582751
     ndrgfp2 |   .4502113   .1182347     3.81   0.000     .2184756     .681947
       ivhx2 |  -.6392831   .2990409    -2.14   0.033    -1.225393   -.0531736
       ivhx3 |  -.7455178   .2636375    -2.83   0.005    -1.262238   -.2287979
        race |   .6437812    .266046     2.42   0.016     .1223406    1.165222
       treat |   .4506826   .2045295     2.20   0.028     .0498121    .8515532
        site |   .5164371   .2552941     2.02   0.043     .0160699    1.016804
  agendrgfp1 |  -.0172712   .0062674    -2.76   0.006    -.0295551   -.0049874
    racesite |   -1.37849   .5318175    -2.59   0.010    -2.420833   -.3361467
       _cons |  -7.048292   1.238013    -5.69   0.000    -9.474753   -4.621832
------------------------------------------------------------------------------

* Stata 8 code.
lfit

* Stata 9 code and output.
estat gof

Logistic model for dfree, goodness-of-fit test

       number of observations =       574
 number of covariate patterns =       520
            Pearson chi2(509) =       511.61
                  Prob > chi2 =         0.4591

ldev
(1 missing value generated)
(1 missing value generated)
(1 missing value generated)

Logistic model deviance goodness-of-fit test

         number of observations =     574
   number of covariate patterns =     520
       deviance goodness-of-fit =     526.94
             degrees of freedom =     509
                    Prob > chi2 =       0.2821

* Stata 8 code.
lfit, group(10) table

* Stata 9 code and output.
estat gof, group(10) table

Logistic model for dfree, goodness-of-fit test
(Table collapsed on quantiles of estimated probabilities)

_Group     _Prob     _Obs_1     _Exp_1     _Obs_0     _Exp_0     _Total
     1    0.0899          4        4.0         54       54.0         58
     2    0.1232          5        6.1         52       50.9         57
     3    0.1623          8        8.4         50       49.6         58
     4    0.2011         11       10.3         46       46.7         57
     5    0.2332         16       12.6         42       45.4         58
     6    0.2761          9       14.8         49       43.2         58
     7    0.3230         20       16.8         36       39.2         56
     8    0.3740         23       20.3         35       37.7         58
     9    0.4565         23       23.5         34       33.5         57
    10    0.7414         27       29.3         30       27.7         57

       number of observations =       574
             number of groups =        10
      Hosmer-Lemeshow chi2(8) =         6.36
                  Prob > chi2 =         0.6065
Deleting all four covariate patterns.
logit dfree age ndrgfp1 ndrgfp2 ivhx2 ivhx3 race treat site ///
        agendrgfp1 racesite if n!=31 & n!=477 & n!=105 & n!=468

Iteration 0:   log likelihood = -319.98056
Iteration 1:   log likelihood = -290.60629
Iteration 2:   log likelihood =    -289.18
Iteration 3:   log likelihood = -289.16639
Iteration 4:   log likelihood = -289.16638

Logit estimates                                   Number of obs   =        570
                                                  LR chi2(10)     =      61.63
                                                  Prob > chi2     =     0.0000
Log likelihood = -289.16638                       Pseudo R2       =     0.0963

------------------------------------------------------------------------------
       dfree |      Coef.   Std. Err.      z    P>|z|     [95% Conf. Interval]
-------------+----------------------------------------------------------------
         age |   .1375773   .0305755     4.50   0.000     .0776504    .1975042
     ndrgfp1 |   2.042452   .4429761     4.61   0.000     1.174235    2.910669
     ndrgfp2 |   .5253043   .1228263     4.28   0.000     .2845692    .7660395
       ivhx2 |  -.7016545   .3043009    -2.31   0.021    -1.298073   -.1052357
       ivhx3 |   -.796238   .2678256    -2.97   0.003    -1.321167   -.2713095
        race |   .5453942   .2730249     2.00   0.046     .0102753    1.080513
       treat |   .5253459   .2084363     2.52   0.012     .1168182    .9338736
        site |   .5042472   .2584389     1.95   0.051    -.0022837    1.010778
  agendrgfp1 |  -.0204074   .0067651    -3.02   0.003    -.0336668    -.007148
    racesite |  -1.250942   .5386628    -2.32   0.020    -2.306702   -.1951827
       _cons |   -7.79976   1.299528    -6.00   0.000    -10.34679   -5.252732
------------------------------------------------------------------------------

* Stata 8 code.
lfit

* Stata 9 code and output.
estat gof

Logistic model for dfree, goodness-of-fit test

       number of observations =       570
 number of covariate patterns =       517
            Pearson chi2(506) =       482.63
                  Prob > chi2 =         0.7658

ldev
(5 missing values generated)
(5 missing values generated)
(5 missing values generated)

Logistic model deviance goodness-of-fit test

         number of observations =     570
   number of covariate patterns =     517
       deviance goodness-of-fit =     511.11
             degrees of freedom =     506
                    Prob > chi2 =       0.4282

* Stata 8 code.
lfit, group(10) table

* Stata 9 code and output.
estat gof, group(10) table

Logistic model for dfree, goodness-of-fit test
(Table collapsed on quantiles of estimated probabilities)

_Group     _Prob     _Obs_1     _Exp_1     _Obs_0     _Exp_0     _Total
     1    0.0803          3        3.3         54       53.7         57
     2    0.1156          6        5.5         51       51.5         57
     3    0.1521          6        7.7         51       49.3         57
     4    0.1897         10        9.7         47       47.3         57
     5    0.2293         15       12.0         42       45.0         57
     6    0.2712         11       14.1         46       42.9         57
     7    0.3177         23       16.7         34       40.3         57
     8    0.3749         20       19.7         37       37.3         57
     9    0.4547         22       23.5         35       33.5         57
    10    0.7637         26       29.6         31       27.4         57

       number of observations =       570
             number of groups =        10
      Hosmer-Lemeshow chi2(8) =         6.86
                  Prob > chi2 =         0.5523
Table 5.10, page 189.
logit dfree age ndrgfp1 ndrgfp2 ivhx2 ivhx3 race treat site agendrgfp1 racesite

Iteration 0:   log likelihood = -326.86446
Iteration 1:   log likelihood = -300.06724
Iteration 2:   log likelihood = -298.98837
Iteration 3:   log likelihood = -298.98146
Iteration 4:   log likelihood = -298.98146

Logit estimates                                   Number of obs   =        575
                                                  LR chi2(10)     =      55.77
                                                  Prob > chi2     =     0.0000
Log likelihood = -298.98146                       Pseudo R2       =     0.0853

------------------------------------------------------------------------------
       dfree |      Coef.   Std. Err.      z    P>|z|     [95% Conf. Interval]
-------------+----------------------------------------------------------------
         age |   .1166385   .0288749     4.04   0.000     .0600446    .1732323
     ndrgfp1 |   1.669035    .407152     4.10   0.000      .871032    2.467038
     ndrgfp2 |   .4336886   .1169052     3.71   0.000     .2045586    .6628185
       ivhx2 |  -.6346307   .2987192    -2.12   0.034    -1.220109   -.0491518
       ivhx3 |  -.7049475   .2615805    -2.69   0.007    -1.217636   -.1922591
        race |   .6841068   .2641355     2.59   0.010     .1664107    1.201803
       treat |   .4349255   .2037596     2.13   0.033      .035564     .834287
        site |    .516201   .2548881     2.03   0.043     .0166295    1.015773
  agendrgfp1 |  -.0152697   .0060268    -2.53   0.011    -.0270819   -.0034575
    racesite |  -1.429457   .5297806    -2.70   0.007    -2.467808   -.3911062
       _cons |  -6.843864   1.219316    -5.61   0.000     -9.23368   -4.454048
------------------------------------------------------------------------------
Table 5.11, page 190.
logit dfree age ndrgfp1 ndrgfp2 ivhx2 ivhx3 race treat site agendrgfp1 racesite, or

Iteration 0:   log likelihood = -326.86446
Iteration 1:   log likelihood = -300.06724
Iteration 2:   log likelihood = -298.98837
Iteration 3:   log likelihood = -298.98146
Iteration 4:   log likelihood = -298.98146

Logit estimates                                   Number of obs   =        575
                                                  LR chi2(10)     =      55.77
                                                  Prob > chi2     =     0.0000
Log likelihood = -298.98146                       Pseudo R2       =     0.0853

------------------------------------------------------------------------------
       dfree | Odds Ratio   Std. Err.      z    P>|z|     [95% Conf. Interval]
-------------+----------------------------------------------------------------
         age |   1.123713   .0324472     4.04   0.000     1.061884    1.189142
     ndrgfp1 |   5.307045   2.160774     4.10   0.000     2.389375    11.78749
     ndrgfp2 |   1.542938   .1803775     3.71   0.000     1.226983    1.940253
       ivhx2 |   .5301313   .1583604    -2.12   0.034     .2951979    .9520366
       ivhx3 |   .4941345    .129256    -2.69   0.007     .2959289     .825093
        race |   1.982001   .5235167     2.59   0.010     1.181058    3.326108
       treat |   1.544848   .3147776     2.13   0.033     1.036204    2.303171
        site |    1.67565   .4271033     2.03   0.043     1.016768    2.761496
  agendrgfp1 |   .9848463   .0059354    -2.53   0.011     .9732815    .9965485
    racesite |   .2394389   .1268501    -2.70   0.007     .0847705    .6763083
------------------------------------------------------------------------------
Table 5.12, page 192.
quietly logit dfree age ndrgfp1 ndrgfp2 ivhx2 ivhx3 race treat site agendrgfp1 racesite
lincom 1*race, or

 ( 1)  race = 0.0

------------------------------------------------------------------------------
       dfree | Odds Ratio   Std. Err.      z    P>|z|     [95% Conf. Interval]
-------------+----------------------------------------------------------------
         (1) |   1.982001   .5235167     2.59   0.010     1.181058    3.326108
------------------------------------------------------------------------------

lincom 1*race+1*racesite, or

 ( 1)  race + racesite = 0.0

------------------------------------------------------------------------------
       dfree | Odds Ratio   Std. Err.      z    P>|z|     [95% Conf. Interval]
-------------+----------------------------------------------------------------
         (1) |    .474568   .2200132    -1.61   0.108     .1912825    1.177394
------------------------------------------------------------------------------
Figure 5.9, page 194.
NOTE: We were able to get estimates but not the confidence intervals.
logit dfree age ndrgfp1 ndrgfp2 ivhx2 ivhx3 race treat site agendrgfp1 racesite, or

Iteration 0:   log likelihood = -326.86446
Iteration 1:   log likelihood = -300.06724
Iteration 2:   log likelihood = -298.98837
Iteration 3:   log likelihood = -298.98146
Iteration 4:   log likelihood = -298.98146

Logit estimates                                   Number of obs   =        575
                                                  LR chi2(10)     =      55.77
                                                  Prob > chi2     =     0.0000
Log likelihood = -298.98146                       Pseudo R2       =     0.0853

------------------------------------------------------------------------------
       dfree | Odds Ratio   Std. Err.      z    P>|z|     [95% Conf. Interval]
-------------+----------------------------------------------------------------
         age |   1.123713   .0324472     4.04   0.000     1.061884    1.189142
     ndrgfp1 |   5.307045   2.160774     4.10   0.000     2.389375    11.78749
     ndrgfp2 |   1.542938   .1803775     3.71   0.000     1.226983    1.940253
       ivhx2 |   .5301313   .1583604    -2.12   0.034     .2951979    .9520366
       ivhx3 |   .4941345    .129256    -2.69   0.007     .2959289     .825093
        race |   1.982001   .5235167     2.59   0.010     1.181058    3.326108
       treat |   1.544848   .3147776     2.13   0.033     1.036204    2.303171
        site |    1.67565   .4271033     2.03   0.043     1.016768    2.761496
  agendrgfp1 |   .9848463   .0059354    -2.53   0.011     .9732815    .9965485
    racesite |   .2394389   .1268501    -2.70   0.007     .0847705    .6763083
------------------------------------------------------------------------------
NOTE: Below is the code that would be used if we could get the correct confidence intervals.
clear
input or se ntreat
end
serrbar or se treat
Figure 5.10, page 197.
NOTE: We have been unable to recreate these graphs.
Figure 5.11, page 199.
NOTE: We have been unable to recreate these graphs.

