Table 7.1, page 232.
Part 1: on variable lwt.
use lowbwt11, clear
clogit low lwt, group(pair)

(Intermediate results omitted)
Conditional (fixed-effects) logistic regression   Number of obs   =        112
                                                  LR chi2(1)      =       2.51
                                                  Prob > chi2     =     0.1131
Log likelihood = -37.561103                       Pseudo R2       =     0.0323
------------------------------------------------------------------------------
         low |      Coef.   Std. Err.      z    P>|z|     [95% Conf. Interval]
-------------+----------------------------------------------------------------
         lwt |  -.0093749   .0061654    -1.52   0.128    -.0214589    .0027091
------------------------------------------------------------------------------

gen lwt10 = lwt/10
clogit low lwt10, group(pair) or

(Intermediate results omitted)
Conditional (fixed-effects) logistic regression   Number of obs   =        112
                                                  LR chi2(1)      =       2.51
                                                  Prob > chi2     =     0.1131
Log likelihood = -37.561103                       Pseudo R2       =     0.0323
------------------------------------------------------------------------------
         low | Odds Ratio   Std. Err.      z    P>|z|     [95% Conf. Interval]
-------------+----------------------------------------------------------------
       lwt10 |   .9105114   .0561368    -1.52   0.128     .8068732    1.027461
------------------------------------------------------------------------------
Part 2: on variable smoke.
clogit low smoke, group(pair)

(Intermediate results omitted)
Conditional (fixed-effects) logistic regression   Number of obs   =        112
                                                  LR chi2(1)      =       6.79
                                                  Prob > chi2     =     0.0091
Log likelihood = -35.419282                       Pseudo R2       =     0.0875
------------------------------------------------------------------------------
         low |      Coef.   Std. Err.      z    P>|z|     [95% Conf. Interval]
-------------+----------------------------------------------------------------
       smoke |   1.011601   .4128614     2.45   0.014     .2024075    1.820794
------------------------------------------------------------------------------

clogit low smoke, group(pair) or

(Intermediate results omitted)
Conditional (fixed-effects) logistic regression   Number of obs   =        112
                                                  LR chi2(1)      =       6.79
                                                  Prob > chi2     =     0.0091
Log likelihood = -35.419282                       Pseudo R2       =     0.0875
------------------------------------------------------------------------------
         low | Odds Ratio   Std. Err.      z    P>|z|     [95% Conf. Interval]
-------------+----------------------------------------------------------------
       smoke |       2.75   1.135369     2.45   0.014     1.224347    6.176763
------------------------------------------------------------------------------
The code below shows how to compute the number of discordant pairs corresponding to the last column of the table.
sort pair

* Stata 8 code.
egen test = sum(smoke), by(pair)

* Stata 9 code.
egen test = total(smoke), by(pair)

list pair smoke test in 1/20

          pair      smoke       test
  1.         1          0          1
  2.         1          1          1
  3.         2          0          0
  4.         2          0          0
  5.         3          0          0
  6.         3          0          0
  7.         4          0          1
  8.         4          1          1
  9.         5          1          2
 10.         5          1          2
 11.         6          0          1
 12.         6          1          1
 13.         7          0          0
 14.         7          0          0
 15.         8          0          0
 16.         8          0          0
 17.         9          1          1
 18.         9          0          1
 19.        10          1          2
 20.        10          1          2

tab low smoke  if test == 1

           |         smoke
       low |         0          1 |     Total
-----------+----------------------+----------
         0 |        22          8 |        30
         1 |         8         22 |        30
-----------+----------------------+----------
     Total |        30         30 |        60
Part 3: on variable race.
xi3: clogit low c.race, group(pair)
c.race            _Irace_1-3          (naturally coded; _Irace_1 omitted)

Iteration 0:   log likelihood = -38.801591
Iteration 1:   log likelihood = -38.787243
Iteration 2:   log likelihood = -38.787243

Conditional (fixed-effects) logistic regression   Number of obs   =        112
                                                  LR chi2(2)      =       0.06
                                                  Prob > chi2     =     0.9714
Log likelihood = -38.787243                       Pseudo R2       =     0.0007

------------------------------------------------------------------------------
         low |      Coef.   Std. Err.      z    P>|z|     [95% Conf. Interval]
-------------+----------------------------------------------------------------
    _Irace_2 |   .0870496   .5233129     0.17   0.868    -.9386249    1.112724
    _Irace_3 |  -.0290003    .396792    -0.07   0.942    -.8066982    .7486977
------------------------------------------------------------------------------

xi3: clogit low c.race, group(pair) or
c.race            _Irace_1-3          (naturally coded; _Irace_1 omitted)

Iteration 0:   log likelihood = -38.801591
Iteration 1:   log likelihood = -38.787243
Iteration 2:   log likelihood = -38.787243

Conditional (fixed-effects) logistic regression   Number of obs   =        112
                                                  LR chi2(2)      =       0.06
                                                  Prob > chi2     =     0.9714
Log likelihood = -38.787243                       Pseudo R2       =     0.0007

------------------------------------------------------------------------------
         low | Odds Ratio   Std. Err.      z    P>|z|     [95% Conf. Interval]
-------------+----------------------------------------------------------------
    _Irace_2 |   1.090951   .5709087     0.17   0.868     .3911654    3.042636
    _Irace_3 |   .9714162   .3854501    -0.07   0.942     .4463293    2.114245
------------------------------------------------------------------------------
Part 4: on variable ptd.
clogit low ptd, group(pair)

Conditional (fixed-effects) logistic regression   Number of obs   =        112
                                                  LR chi2(1)      =       6.78
                                                  Prob > chi2     =     0.0092
Log likelihood = -35.424856                       Pseudo R2       =     0.0874
------------------------------------------------------------------------------
         low |      Coef.   Std. Err.      z    P>|z|     [95% Conf. Interval]
-------------+----------------------------------------------------------------
         ptd |   1.321756     .56273     2.35   0.019     .2188253    2.424686
------------------------------------------------------------------------------

clogit low ptd, group(pair) or

Conditional (fixed-effects) logistic regression   Number of obs   =        112
                                                  LR chi2(1)      =       6.78
                                                  Prob > chi2     =     0.0092
Log likelihood = -35.424856                       Pseudo R2       =     0.0874
------------------------------------------------------------------------------
         low | Odds Ratio   Std. Err.      z    P>|z|     [95% Conf. Interval]
-------------+----------------------------------------------------------------
         ptd |       3.75   2.110237     2.35   0.019     1.244614    11.29869
------------------------------------------------------------------------------
The code below shows how to compute the number of discordant pairs corresponding to the last column of the table.
sort pair

* Stata 8 code.
egen test = sum(ptd), by(pair)

* Stata 9 code.
egen test = total(ptd), by(pair)

list pair ptd test in 1/20

          pair        ptd       test
  1.         1          0          1
  2.         1          1          1
  3.         2          0          0
  4.         2          0          0
  5.         3          0          0
  6.         3          0          0
  7.         4          0          1
  8.         4          1          1
  9.         5          0          0
 10.         5          0          0
 11.         6          0          0
 12.         6          0          0
 13.         7          0          0
 14.         7          0          0
 15.         8          0          0
 16.         8          0          0
 17.         9          0          0
 18.         9          0          0
 19.        10          0          1
 20.        10          1          1

tab low ptd  if test == 1

           |          ptd
       low |         0          1 |     Total
-----------+----------------------+----------
         0 |        15          4 |        19
         1 |         4         15 |        19
-----------+----------------------+----------
     Total |        19         19 |        38
Part 5: on variable ht.
clogit low ht, group(pair)

Conditional (fixed-effects) logistic regression   Number of obs   =        112
                                                  LR chi2(1)      =       1.65
                                                  Prob > chi2     =     0.1996
Log likelihood = -37.993413                       Pseudo R2       =     0.0212
------------------------------------------------------------------------------
         low |      Coef.   Std. Err.      z    P>|z|     [95% Conf. Interval]
-------------+----------------------------------------------------------------
          ht |   .8472979   .6900656     1.23   0.220    -.5052058    2.199801
-----------------------------------------------------------------------------

clogit low ht, group(pair) or

Conditional (fixed-effects) logistic regression   Number of obs   =        112
                                                  LR chi2(1)      =       1.65
                                                  Prob > chi2     =     0.1996
Log likelihood = -37.993413                       Pseudo R2       =     0.0212
------------------------------------------------------------------------------
         low | Odds Ratio   Std. Err.      z    P>|z|     [95% Conf. Interval]
-------------+----------------------------------------------------------------
          ht |   2.333333   1.610153     1.23   0.220     .6033814    9.023222
------------------------------------------------------------------------------
Part 6: on variable ui.
clogit low ui, group(pair)

Conditional (fixed-effects) logistic regression   Number of obs   =        112
                                                  LR chi2(1)      =       4.19
                                                  Prob > chi2     =     0.0408
Log likelihood =  -36.72325                       Pseudo R2       =     0.0539
------------------------------------------------------------------------------
         low |      Coef.   Std. Err.      z    P>|z|     [95% Conf. Interval]
-------------+----------------------------------------------------------------
          ui |   1.098612   .5773502     1.90   0.057    -.0329732    2.230198
------------------------------------------------------------------------------

clogit low ui, group(pair) or
Conditional (fixed-effects) logistic regression   Number of obs   =        112
                                                  LR chi2(1)      =       4.19
                                                  Prob > chi2     =     0.0408
Log likelihood =  -36.72325                       Pseudo R2       =     0.0539
------------------------------------------------------------------------------
         low | Odds Ratio   Std. Err.      z    P>|z|     [95% Conf. Interval]
-------------+----------------------------------------------------------------
          ui |          3    1.73205     1.90   0.057     .9675645    9.301706
------------------------------------------------------------------------------
Table 7.2, page 232.
xi: clogit low lwt i.race smoke ptd ht ui, group(pair)

Conditional (fixed-effects) logistic regression   Number of obs   =        112
                                                  LR chi2(7)      =      26.04
                                                  Prob > chi2     =     0.0005
Log likelihood = -25.794271                       Pseudo R2       =     0.3355
------------------------------------------------------------------------------
         low |      Coef.   Std. Err.      z    P>|z|     [95% Conf. Interval]
-------------+----------------------------------------------------------------
         lwt |  -.0183757   .0100806    -1.82   0.068    -.0381333    .0013819
    _Irace_2 |   .5713643   .6896449     0.83   0.407    -.7803149    1.923044
    _Irace_3 |  -.0253148   .6992044    -0.04   0.971     -1.39573    1.345101
       smoke |   1.400656   .6278396     2.23   0.026     .1701131    2.631199
         ptd |   1.808009   .7886502     2.29   0.022     .2622829    3.353735
          ht |   2.361152   1.086128     2.17   0.030     .2323797    4.489924
          ui |   1.401929   .6961585     2.01   0.044     .0374836    2.766375
------------------------------------------------------------------------------
Table 7.3, page 233.
clogit low lwt  smoke ptd ht ui, group(pair)

Conditional (fixed-effects) logistic regression   Number of obs   =        112
                                                  LR chi2(5)      =      25.16
                                                  Prob > chi2     =     0.0001
Log likelihood = -26.236872                       Pseudo R2       =     0.3241
------------------------------------------------------------------------------
         low |      Coef.   Std. Err.      z    P>|z|     [95% Conf. Interval]
-------------+----------------------------------------------------------------
         lwt |  -.0150834   .0081465    -1.85   0.064    -.0310503    .0008834
       smoke |   1.479564   .5620191     2.63   0.008     .3780272    2.581102
         ptd |   1.670594   .7468062     2.24   0.025      .206881    3.134308
          ht |   2.329361   1.002549     2.32   0.020     .3644009    4.294322
          ui |   1.344895    .693843     1.94   0.053    -.0150127    2.704802
------------------------------------------------------------------------------
Table 7.4, page 233.
fracpoly clogit low lwt smoke ptd ht ui, degree(2) compare group(pair)

-> gen double Ilwt__1 = X^3-2.057 if e(sample)
-> gen double Ilwt__2 = X^3*ln(X)-.4943 if e(sample)
   (where: X = lwt/100)
Conditional (fixed-effects) logistic regression   Number of obs   =        112
                                                  LR chi2(6)      =      26.39
                                                  Prob > chi2     =     0.0002
Log likelihood = -25.619273                       Pseudo R2       =     0.3400
------------------------------------------------------------------------------
         low |      Coef.   Std. Err.      z    P>|z|     [95% Conf. Interval]
-------------+----------------------------------------------------------------
     Ilwt__1 |   .1293646   .7216141     0.18   0.858    -1.284973    1.543702
     Ilwt__2 |  -.4866156   .9224357    -0.53   0.598    -2.294556    1.321325
       smoke |   1.587445   .5772395     2.75   0.006     .4560765    2.718814
         ptd |   1.482725   .7515386     1.97   0.049     .0097367    2.955714
          ht |   2.776714   1.174591     2.36   0.018     .4745582     5.07887
          ui |   1.441683   .7313612     1.97   0.049     .0082417    2.875125
------------------------------------------------------------------------------
Deviance: 51.23855. Best powers of lwt among 44 models fit: 3 3.
Fractional polynomial model comparisons:
---------------------------------------------------------------
lwt              df       Deviance      Gain   P(term) Powers
---------------------------------------------------------------
Not in model      0         56.299        --     --
Linear            1         52.474     0.000    0.050  1
m = 1             2         51.541     0.933    0.334  3
m = 2             4         51.239     1.235    0.860  3 3
---------------------------------------------------------------
Table 7.5, page 234.
sum lwt, de

                             lwt
-------------------------------------------------------------
      Percentiles      Smallest
 1%           85             80
 5%           91             85
10%           95             89       Obs                 112
25%        106.5             90       Sum of Wgt.         112
50%          120                      Mean           127.1696
                        Largest       Std. Dev.      30.46986
75%        136.5            200
90%          168            215       Variance       928.4124
95%          190            235       Skewness       1.434646
99%          235            241       Kurtosis       5.353944

di (80+106.5)/2
93.25

di (106.5+120)/2
113.25

di (120+136.5)/2
128.25

di (136.5 + 241)/2
188.75

gen lwt1 = (lwt <= 106.5)
gen lwt2 = (lwt >106.5 & lwt <=120)
gen lwt3 = (lwt >120 & lwt <=136.5)
gen lwt4 = (lwt >136.5 )
clogit low lwt2-lwt4 smoke ptd ht ui, group(pair)

Conditional (fixed-effects) logistic regression   Number of obs   =        112
                                                  LR chi2(7)      =      23.55
                                                  Prob > chi2     =     0.0014
Log likelihood = -27.040323                       Pseudo R2       =     0.3034
------------------------------------------------------------------------------
         low |      Coef.   Std. Err.      z    P>|z|     [95% Conf. Interval]
-------------+----------------------------------------------------------------
        lwt2 |  -.3990522   .6634445    -0.60   0.548     -1.69938    .9012751
        lwt3 |  -.4430378   .6717904    -0.66   0.510    -1.759723    .8736472
        lwt4 |  -.8887328   .6254553    -1.42   0.155    -2.114603    .3371371
       smoke |   1.352736   .5567867     2.43   0.015     .2614543    2.444018
         ptd |   1.739829   .7461841     2.33   0.020     .2773346    3.202323
          ht |   1.892555   .9646519     1.96   0.050     .0018721    3.783238
          ui |   1.316209    .688568     1.91   0.056    -.0333594    2.665777
------------------------------------------------------------------------------
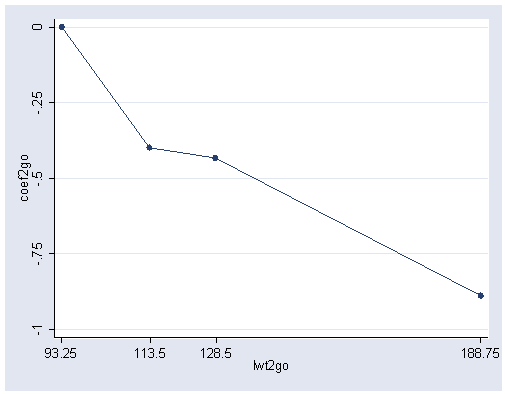
Figure 7.1, page 234.
preserve
clear
input coef2go lwt2go
0 93.25
-.399 113.25
-.433 128.25
-.889 188.75
end

graph twoway scatter coef2go lwt2go, ///
	connect(l) ylabel(-1(.25)0) xlabel(93.25 113.5 128.5 188.75)
restore
Table 7.6, page 235. This is fairly long table comparing a lot of possible interaction terms with model presented in Table 7.3. We only present code for the first row of the table testing interaction term on age and lwt. The other rows of the table can be generated exactly the same way and we omit them here.
gen agelwt = age*lwt
clogit low lwt smoke ptd ht ui, group(pair)

Conditional (fixed-effects) logistic regression   Number of obs   =        112
                                                  LR chi2(5)      =      25.16
                                                  Prob > chi2     =     0.0001
Log likelihood = -26.236872                       Pseudo R2       =     0.3241
------------------------------------------------------------------------------
         low |      Coef.   Std. Err.      z    P>|z|     [95% Conf. Interval]
-------------+----------------------------------------------------------------
         lwt |  -.0150834   .0081465    -1.85   0.064    -.0310503    .0008834
       smoke |   1.479564   .5620191     2.63   0.008     .3780272    2.581102
         ptd |   1.670594   .7468062     2.24   0.025      .206881    3.134308
          ht |   2.329361   1.002549     2.32   0.020     .3644009    4.294322
          ui |   1.344895    .693843     1.94   0.053    -.0150127    2.704802
------------------------------------------------------------------------------

fitstat, saving(m0)

Measures of Fit for clogit of low
Log-Lik Intercept Only:      -38.816     Log-Lik Full Model:          -26.237
D(51):                        52.474     LR(5):                        25.159
                                         Prob > LR:                     0.000
McFadden's R2:                 0.324     McFadden's Adj R2:             0.195
Maximum Likelihood R2:         0.362     Cragg & Uhler's R2:            0.483
Count R2:                      0.750
AIC:                           1.116     AIC*n:                        62.474
BIC:                        -152.819     BIC':                         -5.032
(Indices saved in matrix fs_m0)

clogit low lwt smoke ptd ht ui agelwt, group(pair)

Conditional (fixed-effects) logistic regression   Number of obs   =        112
                                                  LR chi2(6)      =      25.66
                                                  Prob > chi2     =     0.0003
Log likelihood = -25.984088                       Pseudo R2       =     0.3306
------------------------------------------------------------------------------
         low |      Coef.   Std. Err.      z    P>|z|     [95% Conf. Interval]
-------------+----------------------------------------------------------------
         lwt |   .0226658   .0541908     0.42   0.676    -.0835461    .1288778
       smoke |   1.502073   .5683783     2.64   0.008     .3880719    2.616074
         ptd |   1.633939    .751427     2.17   0.030     .1611697    3.106709
          ht |   2.289793   1.004234     2.28   0.023     .3215311    4.258056
          ui |   1.391004    .709504     1.96   0.050     .0004015    2.781606
      agelwt |  -.0016997   .0024358    -0.70   0.485    -.0064739    .0030744
------------------------------------------------------------------------------

fitstat, using(m0)

Measures of Fit for clogit of low
                             Current            Saved       Difference
Model:                        clogit           clogit
N:                                56               56                0
Log-Lik Intercept Only:      -38.816          -38.816            0.000
Log-Lik Full Model:          -25.984          -26.237            0.253
D:                            51.968(50)       52.474(51)        0.506(1)
LR:                           25.664(6)        25.159(5)         0.506(1)
Prob > LR:                     0.000            0.000            0.477
McFadden's R2:                 0.331            0.324            0.007
McFadden's Adj R2:             0.176            0.195           -0.019
Maximum Likelihood R2:         0.368            0.362            0.006
Cragg & Uhler's R2:            0.490            0.483            0.008
Count R2:                      0.768            0.750            0.018
AIC:                           1.142            1.116            0.027
AIC*n:                        63.968           62.474            1.494
BIC:                        -149.299         -152.819            3.520
BIC':                         -1.512           -5.032            3.520
Difference of    3.520 in BIC' provides positive support for saved model.
Note: p-value for difference in LR is only valid if models are nested.
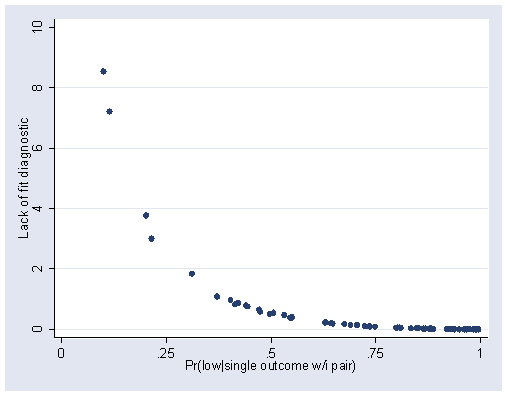
Figure 7.2, page 237.
clogit low lwt smoke ptd ht ui, group(pair)

Conditional (fixed-effects) logistic regression   Number of obs   =        112
                                                  LR chi2(5)      =      25.16
                                                  Prob > chi2     =     0.0001
Log likelihood = -26.236872                       Pseudo R2       =     0.3241
------------------------------------------------------------------------------
         low |      Coef.   Std. Err.      z    P>|z|     [95% Conf. Interval]
-------------+----------------------------------------------------------------
         lwt |  -.0150834   .0081465    -1.85   0.064    -.0310503    .0008834
       smoke |   1.479564   .5620191     2.63   0.008     .3780272    2.581102
         ptd |   1.670594   .7468062     2.24   0.025      .206881    3.134308
          ht |   2.329361   1.002549     2.32   0.020     .3644009    4.294322
          ui |   1.344895    .693843     1.94   0.053    -.0150127    2.704802
------------------------------------------------------------------------------
You can download clfit from within Stata by typing search clfit (see How can I use the search command to search for programs and get additional help? for more information about using search).
clfit
predict p
(option pc1 assumed; conditional probability for single outcome within group)

graph twoway scatter _dx2 p if low == 1, ylabel(0(2)10) xlabel(0(.25)1)
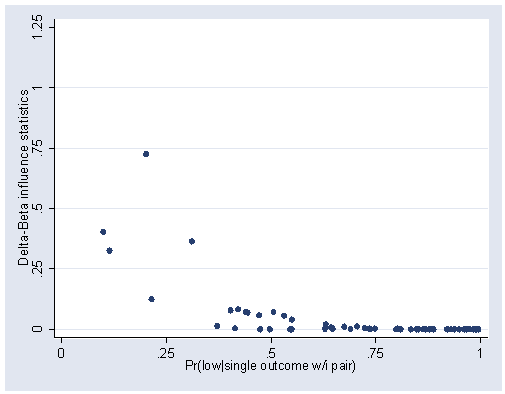
Figure 7.3, page 238.
graph twoway scatter _dbeta p if low == 1, ylabel(0(.25)1.25) xlabel(0(.25)1)
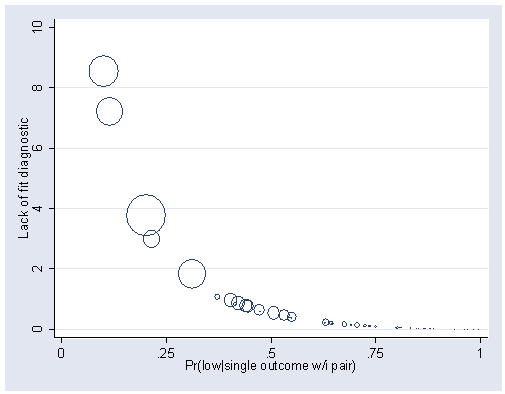
Figure 7.4, page 249.
graph twoway scatter _dx2 p if low==1 [w=_dbeta], ///
	msymbol(oh) ylabel(0(2)10) xlabel(0(.25)1)
Table 7.7, page 240. We first use summarize command to find out the extreme cases using _dbeta.
sum _dbeta, de

               Delta-Beta influence statistics
-------------------------------------------------------------
      Percentiles      Smallest
 1%     2.06e-08       1.06e-09
 5%     8.24e-07       2.06e-08
10%     .0000229       2.90e-08       Obs                 112
25%     .0004128       1.39e-07       Sum of Wgt.         112
50%     .0047458                      Mean           .0326452
                        Largest       Std. Dev.      .0904789
75%     .0285309       .3247977
90%     .0711812       .3630173       Variance       .0081864
95%     .0850838       .4022526       Skewness       5.396415
99%     .4022526       .7241585       Kurtosis       36.17471

format  _hat _dx2 _dbeta p %4.2f
list pair low lwt smoke ptd ht ui p _dbeta _dx2 _hat ///
       if pair==9 | pair == 16 | pair==27 | pair==34

      pair low  lwt smoke ptd ht ui   p  _db~a  _dx2  _hat
 17.   9    0   100   1    0  0  0  0.90  0.00  0.91  0.00
 18.   9    1   148   0    0  0  0  0.10  0.40  8.54  0.04
 31.   16   0   169   0    1  0  1  0.69  0.06  0.74  0.07
 32.   16   1   120   1    0  0  0  0.31  0.36  1.83  0.17
 53.   27   0    95   0    0  1  0  0.80  0.04  0.83  0.04
 54.   27   1   130   1    0  0  0  0.20  0.72  3.77  0.16
 67.   34   0    90   1    1  0  0  0.89  0.00  0.89  0.01
 68.   34   1   128   0    1  0  0  0.11  0.32  7.21  0.04
Table 7.8, page 241. We will only perform analysis on deleting pair number 9. The other analyses are the same.
clogit low lwt smoke ptd ht ui , group(pair)

Conditional (fixed-effects) logistic regression   Number of obs   =        112
                                                  LR chi2(5)      =      25.16
                                                  Prob > chi2     =     0.0001
Log likelihood = -26.236872                       Pseudo R2       =     0.3241
------------------------------------------------------------------------------
         low |      Coef.   Std. Err.      z    P>|z|     [95% Conf. Interval]
-------------+----------------------------------------------------------------
         lwt |  -.0150834   .0081465    -1.85   0.064    -.0310503    .0008834
       smoke |   1.479564   .5620191     2.63   0.008     .3780272    2.581102
         ptd |   1.670594   .7468062     2.24   0.025      .206881    3.134308
          ht |   2.329361   1.002549     2.32   0.020     .3644009    4.294322
          ui |   1.344895    .693843     1.94   0.053    -.0150127    2.704802
------------------------------------------------------------------------------

matrix all=e(b)
clogit  low lwt smoke ptd ht ui if pair~=9, group(pair)

Conditional (fixed-effects) logistic regression   Number of obs   =        110
                                                  LR chi2(5)      =      28.91
                                                  Prob > chi2     =     0.0000
Log likelihood = -23.665784                       Pseudo R2       =     0.3792
------------------------------------------------------------------------------
         low |      Coef.   Std. Err.      z    P>|z|     [95% Conf. Interval]
-------------+----------------------------------------------------------------
         lwt |  -.0196132    .009098    -2.16   0.031     -.037445   -.0017814
       smoke |   1.878073   .6545208     2.87   0.004     .5952357     3.16091
         ptd |   1.883064   .8279104     2.27   0.023     .2603895    3.505739
          ht |   2.719296   1.118355     2.43   0.015     .5273607    4.911231
          ui |   1.497879    .731723     2.05   0.041      .063728    2.932029
------------------------------------------------------------------------------

matrix del9 = e(b)
matrix diff = J(1,5,0)
local i = 1
while `i' <= 5 {
         matrix diff[1,`i']= 100*abs((all[1,`i']-del9[1,`i'])/all[1,`i'])
         local i = `i' + 1
     }
matrix list diff

diff[1,5]
           c1         c2         c3         c4         c5
r1  30.031356  26.934178  12.718221  16.739972  11.375172
Table 7.9, page 242.
gen lwt10 = lwt/10
clogit  low lwt10 smoke ptd ht ui, group(pair)

Conditional (fixed-effects) logistic regression   Number of obs   =        112
                                                  LR chi2(5)      =      25.16
                                                  Prob > chi2     =     0.0001
Log likelihood = -26.236872                       Pseudo R2       =     0.3241
------------------------------------------------------------------------------
         low |      Coef.   Std. Err.      z    P>|z|     [95% Conf. Interval]
-------------+----------------------------------------------------------------
       lwt10 |  -.1508343   .0814652    -1.85   0.064    -.3105031    .0088345
       smoke |   1.479564   .5620191     2.63   0.008     .3780272    2.581102
         ptd |   1.670594   .7468062     2.24   0.025      .206881    3.134307
          ht |   2.329361   1.002549     2.32   0.020     .3644009    4.294322
          ui |   1.344895    .693843     1.94   0.053    -.0150127    2.704802
------------------------------------------------------------------------------

clogit low lwt10 smoke ptd ht ui, group(pair) or

Conditional (fixed-effects) logistic regression   Number of obs   =        112
                                                  LR chi2(5)      =      25.16
                                                  Prob > chi2     =     0.0001
Log likelihood = -26.236872                       Pseudo R2       =     0.3241
------------------------------------------------------------------------------
         low | Odds Ratio   Std. Err.      z    P>|z|     [95% Conf. Interval]
-------------+----------------------------------------------------------------
       lwt10 |   .8599902   .0700592    -1.85   0.064     .7330781    1.008874
       smoke |   4.391033   2.467844     2.63   0.008     1.459403    13.21168
         ptd |   5.315325   3.969518     2.24   0.025     1.229836    22.97272
          ht |   10.27138   10.29757     2.32   0.020     1.439651    73.28251
          ui |   3.837782   2.662818     1.94   0.053     .9850994    14.95135
------------------------------------------------------------------------------

use https://stats.idre.ucla.edu/stat/stata/examples/alr2/bbdm13, clear
Table 7.11, page 246.
clogit fndx chk , group(str)

Conditional (fixed-effects) logistic regression   Number of obs   =        200
                                                  LR chi2(1)      =      12.99
                                                  Prob > chi2     =     0.0003
Log likelihood = -62.817366                       Pseudo R2       =     0.0937
------------------------------------------------------------------------------
        fndx |      Coef.   Std. Err.      z    P>|z|     [95% Conf. Interval]
-------------+----------------------------------------------------------------
         chk |  -1.245445     .38154    -3.26   0.001     -1.99325   -.4976404
------------------------------------------------------------------------------

clogit fndx chk , group(str)  or

Conditional (fixed-effects) logistic regression   Number of obs   =        200
                                                  LR chi2(1)      =      12.99
                                                  Prob > chi2     =     0.0003
Log likelihood = -62.817366                       Pseudo R2       =     0.0937
------------------------------------------------------------------------------
        fndx | Odds Ratio   Std. Err.      z    P>|z|     [95% Conf. Interval]
-------------+----------------------------------------------------------------
         chk |   .2878128   .1098121    -3.26   0.001     .1362519    .6079635
------------------------------------------------------------------------------

clogit fndx agmn, group(str)

Conditional (fixed-effects) logistic regression   Number of obs   =        200
                                                  LR chi2(1)      =      21.76
                                                  Prob > chi2     =     0.0000
Log likelihood = -58.432931                       Pseudo R2       =     0.1570
------------------------------------------------------------------------------
        fndx |      Coef.   Std. Err.      z    P>|z|     [95% Conf. Interval]
-------------+----------------------------------------------------------------
        agmn |   .4717591   .1109862     4.25   0.000     .2542301     .689288
------------------------------------------------------------------------------

gen agmn2 = agmn/2
clogit fndx agmn2, group(str)  or

Conditional (fixed-effects) logistic regression   Number of obs   =        200
                                                  LR chi2(1)      =      21.76
                                                  Prob > chi2     =     0.0000
Log likelihood = -58.432931                       Pseudo R2       =     0.1570
------------------------------------------------------------------------------
        fndx | Odds Ratio   Std. Err.      z    P>|z|     [95% Conf. Interval]
-------------+----------------------------------------------------------------
       agmn2 |   2.569004   .5702478     4.25   0.000     1.662729    3.969245
------------------------------------------------------------------------------

clogit fndx wt, group(str)

Conditional (fixed-effects) logistic regression   Number of obs   =        200
                                                  LR chi2(1)      =      25.53
                                                  Prob > chi2     =     0.0000
Log likelihood = -56.551372                       Pseudo R2       =     0.1841
------------------------------------------------------------------------------
        fndx |      Coef.   Std. Err.      z    P>|z|     [95% Conf. Interval]
-------------+----------------------------------------------------------------
          wt |   -.035159   .0085993    -4.09   0.000    -.0520132   -.0183047
------------------------------------------------------------------------------

gen wt10 = wt/10
clogit fndx wt10, group(str) or

Conditional (fixed-effects) logistic regression   Number of obs   =        200
                                                  LR chi2(1)      =      25.53
                                                  Prob > chi2     =     0.0000
Log likelihood = -56.551373                       Pseudo R2       =     0.1841
------------------------------------------------------------------------------
        fndx | Odds Ratio   Std. Err.      z    P>|z|     [95% Conf. Interval]
-------------+----------------------------------------------------------------
        wt10 |   .7035688   .0605018    -4.09   0.000     .5944419    .8327291
------------------------------------------------------------------------------

recode mst 2 3 = 2
(6 changes made)

xi: clogit fndx i.mst, group(str)

Conditional (fixed-effects) logistic regression   Number of obs   =        200
                                                  LR chi2(3)      =       7.28
                                                  Prob > chi2     =     0.0635
Log likelihood = -65.674935                       Pseudo R2       =     0.0525
------------------------------------------------------------------------------
        fndx |      Coef.   Std. Err.      z    P>|z|     [95% Conf. Interval]
-------------+----------------------------------------------------------------
     _Imst_2 |  -.3584355   .5605431    -0.64   0.523     -1.45708    .7402089
     _Imst_4 |  -.7510264   .7904422    -0.95   0.342    -2.300265    .7982119
     _Imst_5 |   1.248429   .6058547     2.06   0.039     .0609759    2.435883
------------------------------------------------------------------------------

xi: clogit fndx i.mst, group(str) or

Conditional (fixed-effects) logistic regression   Number of obs   =        200
                                                  LR chi2(3)      =       7.28
                                                  Prob > chi2     =     0.0635
Log likelihood = -65.674935                       Pseudo R2       =     0.0525
------------------------------------------------------------------------------
        fndx | Odds Ratio   Std. Err.      z    P>|z|     [95% Conf. Interval]
-------------+----------------------------------------------------------------
     _Imst_2 |   .6987687     .39169    -0.64   0.523     .2329154    2.096373
     _Imst_4 |    .471882   .3729954    -0.95   0.342     .1002323    2.221565
     _Imst_5 |   3.484865   2.111322     2.06   0.039     1.062873     11.4259
------------------------------------------------------------------------------
Table 7.12, page 247. Notice that variable mst has been recoded in the previous example.
xi: clogit fndx chk agmn wt i.mst, group(str)

Conditional (fixed-effects) logistic regression   Number of obs   =        200
                                                  LR chi2(6)      =      48.20
                                                  Prob > chi2     =     0.0000
Log likelihood = -45.214824                       Pseudo R2       =     0.3477
------------------------------------------------------------------------------
        fndx |      Coef.   Std. Err.      z    P>|z|     [95% Conf. Interval]
-------------+----------------------------------------------------------------
         chk |  -1.121849   .4474471    -2.51   0.012    -1.998829   -.2448688
        agmn |   .3561333   .1291722     2.76   0.006     .1029605    .6093061
          wt |  -.0283565   .0099776    -2.84   0.004    -.0479122   -.0088009
     _Imst_2 |  -.2030472   .6472909    -0.31   0.754    -1.471714     1.06562
     _Imst_4 |  -.4915826   .8173094    -0.60   0.548     -2.09348    1.110314
     _Imst_5 |   1.472195   .7582064     1.94   0.052    -.0138621    2.958252
------------------------------------------------------------------------------
Table 7.13, page 247.
gen nvmr = (mst==5)
clogit fndx chk agmn wt nvmr, group(str)

Conditional (fixed-effects) logistic regression   Number of obs   =        200
                                                  LR chi2(4)      =      47.75
                                                  Prob > chi2     =     0.0000
Log likelihood = -45.439011                       Pseudo R2       =     0.3445
------------------------------------------------------------------------------
        fndx |      Coef.   Std. Err.      z    P>|z|     [95% Conf. Interval]
-------------+----------------------------------------------------------------
         chk |  -1.161303   .4469763    -2.60   0.009    -2.037361    -.285246
        agmn |   .3592472   .1278849     2.81   0.005     .1085973     .609897
          wt |  -.0282355   .0099785    -2.83   0.005     -.047793   -.0086781
        nvmr |   1.593384   .7360284     2.16   0.030     .1507946    3.035973
------------------------------------------------------------------------------
We use clfit command to generate the diagnostic statistics and graph them against the predicted probability. As we mentioned before, you can download the program from the internet within Stata.
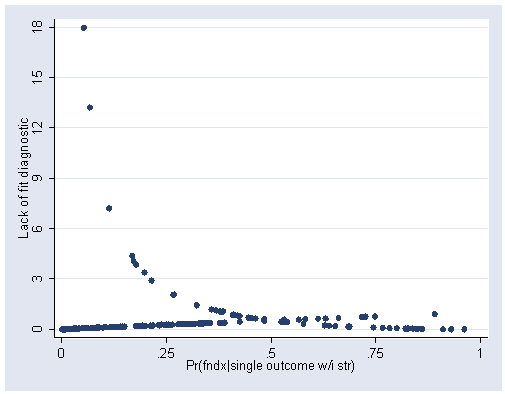
Figure 7.5, page 253.
clogit fndx chk agmn wt nvmr, group(str)

Conditional (fixed-effects) logistic regression   Number of obs   =        200
                                                  LR chi2(4)      =      47.75
                                                  Prob > chi2     =     0.0000
Log likelihood = -45.439011                       Pseudo R2       =     0.3445
------------------------------------------------------------------------------
        fndx |      Coef.   Std. Err.      z    P>|z|     [95% Conf. Interval]
-------------+----------------------------------------------------------------
         chk |  -1.161303   .4469763    -2.60   0.009    -2.037361    -.285246
        agmn |   .3592472   .1278849     2.81   0.005     .1085973     .609897
          wt |  -.0282355   .0099785    -2.83   0.005     -.047793   -.0086781
        nvmr |   1.593384   .7360284     2.16   0.030     .1507946    3.035973
------------------------------------------------------------------------------
clfit
predict p
(option pc1 assumed; conditional probability for single outcome within group)

graph twoway scatter _dx2 p if _dx2 <= 20, ylabel(0(3)18) xlabel(0(.25)1)
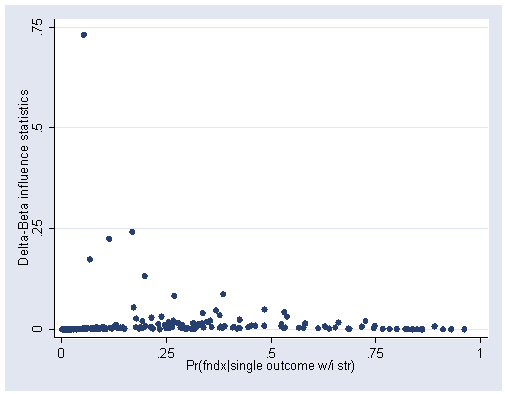
Figure 7.6, page 254.
graph twoway scatter _dbeta p if _dx2 <= 20, ylabel(0(.25).75) xlabel(0(.25)1)
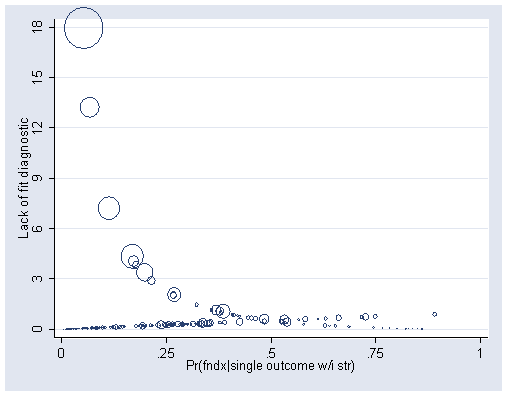
Figure 7.7, page 255.
graph twoway scatter _dx2 p [weight = _dbeta] if _dx2 <= 20 ///
	, msymbol(oh) ylabel(0(3)18) xlabel(0(.25)1)
Table 7.14, page 256. You can download hilo from within Stata by typing search hilo to get the extreme values for variable _dx2 (see How can I use the search command to search for programs and get additional help? for more information about using search).
hilo _dx2, show(5) high
5 highest observations on _dx2

      _dx2
 4.3509183
 7.2066903
 13.215487
 17.962026
 84.545673

tab str if _dx2 >=4.3
        str |      Freq.     Percent        Cum.
------------+-----------------------------------
         10 |          1       20.00       20.00
         12 |          1       20.00       40.00
         18 |          1       20.00       60.00
         24 |          1       20.00       80.00
         31 |          1       20.00      100.00
------------+-----------------------------------
      Total |          5      100.00

format p _dbeta _dx2 _hat %4.2f
list str obs chk agmn wt nvmr p _dbeta _dx2 _hat if str == 10 | str == 12 | str ==18 | str == 24 | str ==31

           str        obs        chk       agmn         wt       nvmr     p  _db~a  _dx2  _hat
 37.        10          1          2         12        105          0  0.11  0.22  7.21  0.033
 38.        10          2          1         13        115          0  0.39  0.01  0.40  0.02
 39.        10          3          2         12        120          0  0.07  0.00  0.07  0.02
 40.        10          4          1         16        150          0  0.42  0.02  0.45  0.05
 45.        12          1          2         10        170          0  0.01  0.71  84.55  0.01
 46.        12          2          1         13        140          0  0.26  0.02  0.27  0.06
 47.        12          3          1         11        240          0  0.01  0.00  0.01  0.01
 48.        12          4          2         16        100          0  0.73  0.02  0.75  0.03
 69.        18          1          2         14        135          0  0.05  0.73  17.96  0.04
 70.        18          2          1         14        132          1  0.89  0.01  0.90  0.01
 71.        18          3          1         11        205          0  0.01  0.00  0.01  0.01
 72.        18          4          1         10        127          0  0.05  0.00  0.05  0.03
 93.        24          1          2         15        145          0  0.07  0.17  13.22  0.01
 94.        24          2          1         13        140          0  0.12  0.00  0.12  0.01
 95.        24          3          1         17        155          0  0.33  0.01  0.34  0.03
 96.        24          4          1         15        116          0  0.48  0.01  0.49  0.02
121.        31          1          2         16        156          0  0.17  0.24  4.35  0.05
122.        31          2          2         12        161          0  0.03  0.00  0.03  0.01
123.        31          3          1         13        150          0  0.22  0.00  0.22  0.01
124.        31          4          1         13        115          0  0.58  0.01  0.60  0.02
Table 7.15, page 257. The analyses in this table is very similar to each other. We will perform the analysis corresponding to the first row and omit all the others.
clogit fndx chk agmn wt nvmr, group(str)

Conditional (fixed-effects) logistic regression   Number of obs   =        200
                                                  LR chi2(4)      =      47.75
                                                  Prob > chi2     =     0.0000
Log likelihood = -45.439011                       Pseudo R2       =     0.3445
------------------------------------------------------------------------------
        fndx |      Coef.   Std. Err.      z    P>|z|     [95% Conf. Interval]
-------------+----------------------------------------------------------------
         chk |  -1.161303   .4469763    -2.60   0.009    -2.037361    -.285246
        agmn |   .3592472   .1278849     2.81   0.005     .1085973     .609897
          wt |  -.0282355   .0099785    -2.83   0.005     -.047793   -.0086781
        nvmr |   1.593384   .7360284     2.16   0.030     .1507946    3.035973
------------------------------------------------------------------------------

matrix all=e(b)
clogit fndx chk agmn wt nvmr if str~=10, group(str)

Conditional (fixed-effects) logistic regression   Number of obs   =        196
                                                  LR chi2(4)      =      49.65
                                                  Prob > chi2     =     0.0000
Log likelihood = -43.104413                       Pseudo R2       =     0.3654
------------------------------------------------------------------------------
        fndx |      Coef.   Std. Err.      z    P>|z|     [95% Conf. Interval]
-------------+----------------------------------------------------------------
         chk |  -1.342017   .4759564    -2.82   0.005    -2.274874   -.4091592
        agmn |      .4044   .1360889     2.97   0.003     .1376707    .6711294
          wt |  -.0254958   .0100782    -2.53   0.011    -.0452487   -.0057429
        nvmr |   1.685185   .7548999     2.23   0.026     .2056084    3.164762
------------------------------------------------------------------------------

matrix del10 = e(b)
/*The following is from the do-file editor*/
matrix diff = J(1,4,0)
local i = 1
while `i' <= 4 {
         matrix diff[1,`i']= 100*((del10[1,`i']-all[1,`i'])/all[1,`i'])
         local i = `i' + 1
}
matrix list diff

diff[1,4]
            c1          c2          c3          c4
r1   15.561224   12.568742  -9.7031755    5.761404
Table 7.16 on page 258.
clogit fndx chk agmn wt nvmr, group(str) or

Conditional (fixed-effects) logistic regression   Number of obs   =        200
                                                  LR chi2(4)      =      47.75
                                                  Prob > chi2     =     0.0000
Log likelihood = -45.439011                       Pseudo R2       =     0.3445
------------------------------------------------------------------------------
        fndx | Odds Ratio   Std. Err.      z    P>|z|     [95% Conf. Interval]
-------------+----------------------------------------------------------------
         chk |   .3130778   .1399384    -2.60   0.009     .1303723    .7518293
        agmn |   1.432251   .1831633     2.81   0.005     1.114713    1.840242
          wt |   .9721594   .0097007    -2.83   0.005     .9533311    .9913594
        nvmr |    4.92037   3.621532     2.16   0.030     1.162758    20.82123
------------------------------------------------------------------------------

