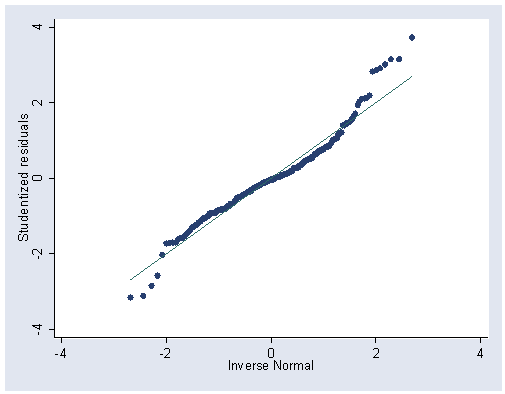
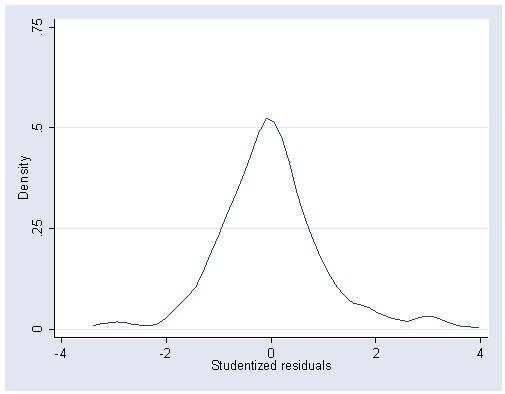
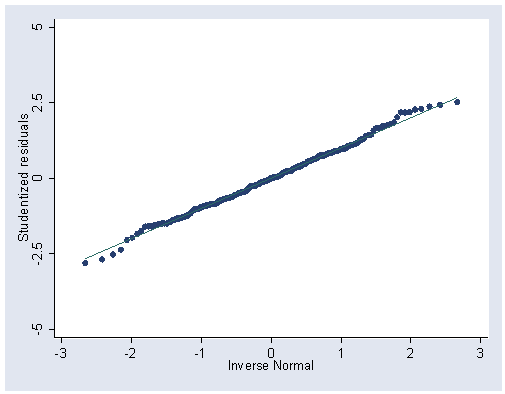
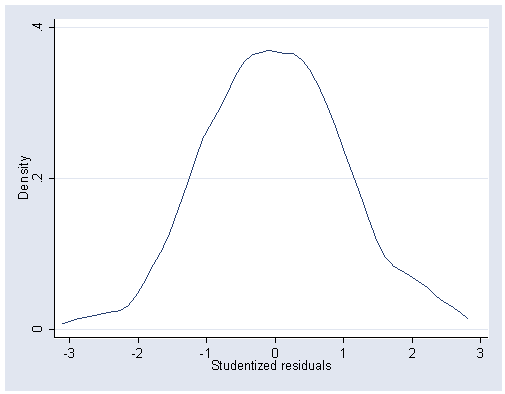
Figure 12.1, figure 12.2 and table 12.1, page 297-299 on data file ornstein. We skip the section on confidence envelopes. We only have the usual normal quantile plots without the confidence envelopes.
use https://stats.idre.ucla.edu/stat/stata/examples/ara/ornstein, clear

tab sector, gen(sect) /*generate dummy variables*/
(Output omitted here)

tab nation, gen(nat)/*generate dummy variables*/
(Output omitted here)

gen asset1=sqrt(assets)/*generate a new regressor*/
regress intrlcks asset1 nat2-nat4 sect1-sect5 sect7-sect10

  Source |       SS       df       MS                  Number of obs =     248
---------+------------------------------               F( 13,   234) =   34.11
   Model |  41816.5529    13  3216.65791               Prob > F      =  0.0000
Residual |  22069.8342   234  94.3155309               R-squared     =  0.6545
---------+------------------------------               Adj R-squared =  0.6354
   Total |  63886.3871   247   258.64934               Root MSE      =  9.7116

------------------------------------------------------------------------------
intrlcks |      Coef.   Std. Err.       t     P>|t|       [95% Conf. Interval]
---------+--------------------------------------------------------------------
  asset1 |   .2517892   .0185222     13.594   0.000       .2152976    .2882808
    nat2 |  -1.158915   2.664005     -0.435   0.664      -6.407413    4.089584
    nat3 |  -4.444009   2.649276     -1.677   0.095       -9.66349    .7754719
    nat4 |  -8.089053   1.481003     -5.462   0.000      -11.00686   -5.171248
   sect1 |  -1.199539    2.04038     -0.588   0.557      -5.219402    2.820323
   sect2 |  -14.37594   5.576992     -2.578   0.011      -25.36347   -3.388413
   sect3 |   -5.12563   4.698778     -1.091   0.276      -14.38294    4.131683
   sect4 |  -5.698507   2.925712     -1.948   0.053      -11.46261     .065596
   sect5 |  -2.430237   4.014109     -0.605   0.545      -10.33865    5.478175
   sect7 |  -.8668517    2.63433     -0.329   0.742      -6.056886    4.323183
   sect8 |   .3422809   2.012105      0.170   0.865      -3.621874    4.306436
   sect9 |  -.3810376   2.819743     -0.135   0.893      -5.936365     5.17429
  sect10 |   5.151303   2.682082      1.921   0.056      -.1328104    10.43542
   _cons |   4.190453   1.846039      2.270   0.024       .5534732    7.827433
------------------------------------------------------------------------------

predict student, rstudent
qnorm student
Figure 12.1 (b) on page 297.
kdensity student, ylabel(0(.25).75)
gen inlck=sqrt(intrlcks+1)
regress inlck asset1 nat2-nat4 sect1-sect5 sect7-sect10

  Source |       SS       df       MS                  Number of obs =     248
---------+------------------------------               F( 13,   234) =   24.89
   Model |  477.296638    13   36.715126               Prob > F      =  0.0000
Residual |  345.199855   234  1.47521306               R-squared     =  0.5803
---------+------------------------------               Adj R-squared =  0.5570
   Total |  822.496493   247  3.32994531               Root MSE      =  1.2146

------------------------------------------------------------------------------
   inlck |      Coef.   Std. Err.       t     P>|t|       [95% Conf. Interval]
---------+--------------------------------------------------------------------
  asset1 |   .0260108   .0023165     11.229   0.000        .021447    .0305747
    nat2 |  -.1139589   .3331737     -0.342   0.733      -.7703624    .5424445
    nat3 |  -.5266014   .3313317     -1.589   0.113      -1.179376    .1261729
    nat4 |  -1.105112   .1852217     -5.966   0.000      -1.470027    -.740197
   sect1 |  -.0567192   .2551801     -0.222   0.824      -.5594633    .4460249
   sect2 |  -2.250759   .6974864     -3.227   0.001      -3.624915   -.8766039
   sect3 |  -.7399749   .5876526     -1.259   0.209      -1.897741     .417791
   sect4 |  -.0880438   .3659042     -0.241   0.810      -.8089313    .6328437
   sect5 |  -.2453168   .5020245     -0.489   0.626      -1.234382    .7437487
   sect7 |   .1479077   .3294624      0.449   0.654      -.5011839    .7969993
   sect8 |   .3562041   .2516439      1.416   0.158       -.139573    .8519811
   sect9 |   .3540146   .3526512      1.004   0.316      -.3407624    1.048792
  sect10 |   .7860363   .3354345      2.343   0.020       .1251788    1.446894
   _cons |   2.329308   .2308748     10.089   0.000       1.874449    2.784167
------------------------------------------------------------------------------

predict student1, rstudent

qnorm student1, ylabel(-5(2.5)5) xlabel(-3(1)3)
Figure 12.2 (b), page 299.
kdensity student1, xlabel(-3(1)3) ylabel(0 .2 .4)
Remark: Combining the results from the two regression procedures, we get the result for Table 12.1, page 298.
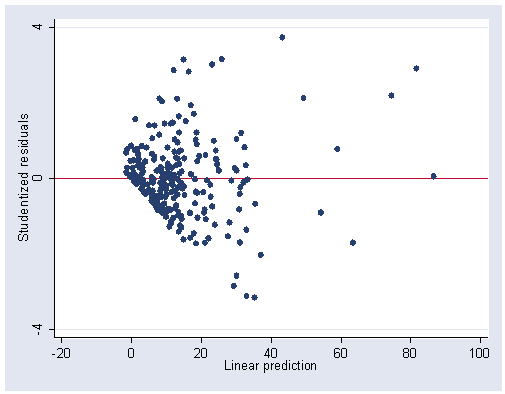
Figure 12.3 (a) on page 303 on data file ornstein.
regress intrlcks asset1 nat2-nat4 sect1-sect5 sect7-sect10
(Output omitted here.)

predict fitted1, xb
 /*use student residuals from the first regression in previous section*/

graph twoway scatter student fitted1, yline(0) ylabel(-4 0 4) xlabel(-20(20)100)
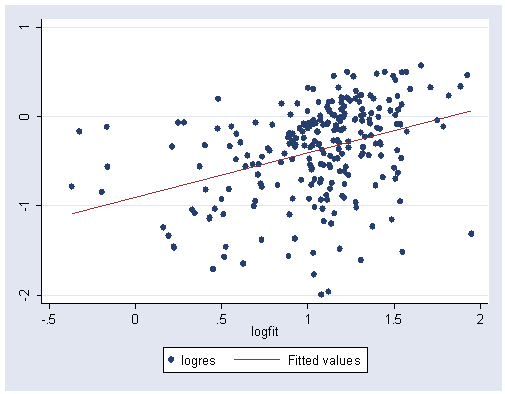
Figure 12.3 (b) on page 303.
gen logfit=log10(2+fitted1)
gen logres = log10(abs(student))
graph twoway (scatter logres logfit)(lfit logres logfit), ylabel(-2(1)1)
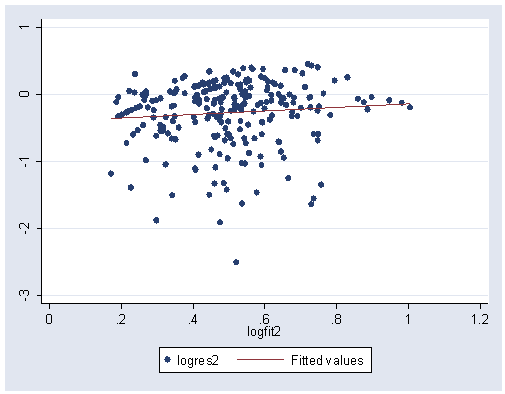
regress inlck asset1 nat2-nat4 sect1-sect5 sect7-sect10
(Output omitted here)

predict fitted2, xb
gen logfit2=log10(fitted2)
gen logres2=log10(abs(student1))
graph twoway (scatter logres2 logfit2)(lfit logres2 logfit2), ylabel(-3(1)1) xlabel(0(.2)1.2)
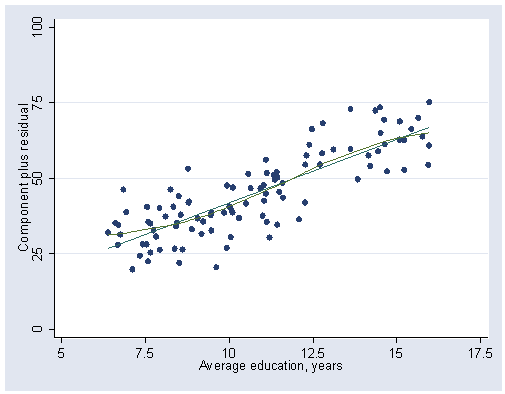
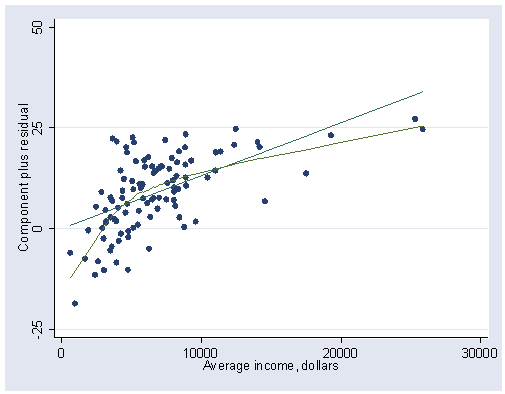
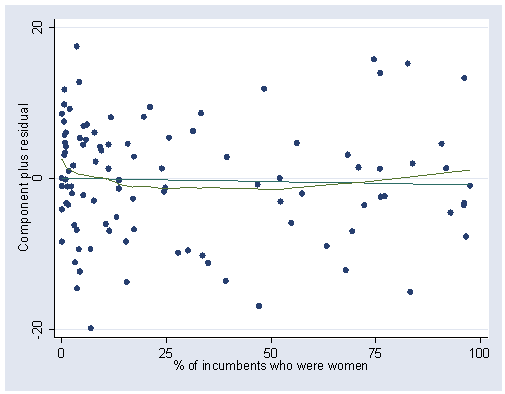
Figure 12.6 (a), (b) and (c) on page 312. Notice that procedure cprplot gives partial residual plot and we use the lowess option to get the nonparametric-regression smoothing shown in the book.
use https://stats.idre.ucla.edu/stat/stata/examples/ara/prestige, clear
(From Fox, Applied Regression Analysis.  Use 'notes' command for source of data)

regress prestige percwomn educat income
(Output omitted here.)

cprplot educat, lowess ylabel(0(25)100) xlabel(5(2.5)17.5)
cprplot income, lowess ylabel(-25(25)50) xlabel(0(10000)30000)
cprplot percwomn, lowess ylabel(-20 0 20) xlabel(0(25)100)
Formula in the middle of page 313 still using the data file prestige.
gen loginc=log10(income)/log10(2)
gen edu2=educat*educat
gen edu3=edu2*educat
gen w2=percwomn*percwomn
regress prestige loginc percwomn w2 educat edu2 edu3

  Source |       SS       df       MS                  Number of obs =     102
---------+------------------------------               F(  6,    95) =   94.46
   Model |  25603.6492     6  4267.27487               Prob > F      =  0.0000
Residual |  4291.77689    95  45.1765988               R-squared     =  0.8564
---------+------------------------------               Adj R-squared =  0.8474
   Total |  29895.4261   101  295.994318               Root MSE      =  6.7214

------------------------------------------------------------------------------
prestige |      Coef.   Std. Err.       t     P>|t|       [95% Conf. Interval]
---------+--------------------------------------------------------------------
  loginc |   8.783331   1.272748      6.901   0.000       6.256608    11.31005
percwomn |   -.179323    .085088     -2.108   0.038      -.3482439    -.010402
      w2 |   .0025001   .0009245      2.704   0.008       .0006648    .0043354
  educat |  -29.92002   15.25152     -1.962   0.053      -60.19811    .3580668
    edu2 |   2.915935   1.414413      2.062   0.042       .1079704    5.723901
    edu3 |  -.0806755   .0422082     -1.911   0.059      -.1644694    .0031185
   _cons |   20.83852   56.89955      0.366   0.715      -92.12136    133.7984
------------------------------------------------------------------------------

predict res2, r
summarize income percwomn /*get mean for income and percwomn*/

Variable |     Obs        Mean   Std. Dev.       Min        Max
---------+-----------------------------------------------------
  income |     102    6797.902   4245.922        611      25879
percwomn |     102    28.97902   31.72493          0      97.51

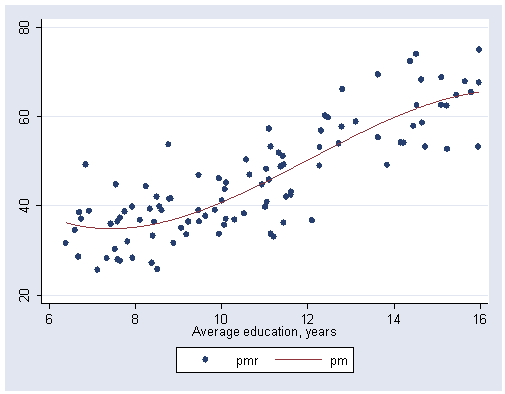
gen pm=20.8+8.78*log10(6797.902)/log10(2)-0.179*28.979+0.0025*28.979*28.979-29.9*educat+2.91*edu2-.0807*edu3
gen pmr=res2 + pm
graph twoway scatter pmr pm educat, connect(i l) sort msymbol(O i O)
Table 12.2 on page 319.
use https://stats.idre.ucla.edu/stat/stata/examples/ara/vocab, clear
(From Fox, Applied Regression Analysis.  Use 'notes' command for source of data)

regress vocab educ

  Source |       SS       df       MS                  Number of obs =     968
---------+------------------------------               F(  1,   966) =  318.92
   Model |  1175.11129     1  1175.11129               Prob > F      =  0.0000
Residual |  3559.41351   966  3.68469307               R-squared     =  0.2482
---------+------------------------------               Adj R-squared =  0.2474
   Total |  4734.52479   967  4.89609596               Root MSE      =  1.9196
(Further output omitted.)

xi: regress vocab i.educ

i.educ                Ieduc_0-20   (naturally coded; Ieduc_0 omitted)

  Source |       SS       df       MS                  Number of obs =     968
---------+------------------------------               F( 19,   948) =   18.13
   Model |  1261.69388    19  66.4049413               Prob > F      =  0.0000
Residual |  3472.83091   948  3.66332374               R-squared     =  0.2665
---------+------------------------------               Adj R-squared =  0.2518
   Total |  4734.52479   967  4.89609596               Root MSE      =   1.914

(Further output omitted)
With the results from these two regressions, we can calculate the nonlinear effect as follows.
display 1261.69399-1175.11129/*Sum of Squares for nonlinear effect*/
86.5827

display (86.57/18)/(3472.8/948)/*F-value*/
1.3128753

display fprob(18, 948, 1.31)/*p-value*/
.17255134
The first part is on Box-Cox transformation on the dependent variable using the data file ornstein, calculation on page 323 and 324.
use https://stats.idre.ucla.edu/stat/stata/examples/ara/ornstein, clear

gen dep=intrlcks+1 /*This is the dependent variable used through the example.*/
gen asset1=sqrt(assets)  /*regressor obtained from independent variable assets. */
gen logy=ln(dep)  /*To get geometric mean suggested in the footnote.*/
egen c1=mean(logy)  /*Contiue on geometric mean*/
gen c=exp(c1)
display c  /* showing geometric mean of the dependent variable*/
8.2501268

gen cv=dep*(ln(dep/c)-1)  /*generate constructed variable*/
xi: regress dep asset1 i.nation i.sector cv

i.nation              Inatio_1-4   (Inatio_1 for nation==CAN omitted)
i.sector              Isect_1-10   (Isect_1 for sector==AGR omitted)

  Source |       SS       df       MS                  Number of obs =     248
---------+------------------------------               F( 14,   233) =  103.67
   Model |  55048.7339    14  3932.05242               Prob > F      =  0.0000
Residual |  8837.65321   233  37.9298421               R-squared     =  0.8617
---------+------------------------------               Adj R-squared =  0.8534
   Total |  63886.3871   247   258.64934               Root MSE      =  6.1587

------------------------------------------------------------------------------
     dep |      Coef.   Std. Err.       t     P>|t|       [95% Conf. Interval]
---------+--------------------------------------------------------------------
  asset1 |   .0699101   .0152576      4.582   0.000       .0398497    .0999705
Inatio_2 |  -.1373967   1.690291     -0.081   0.935      -3.467603     3.19281.....(continued)
      cv |   .5850363   .0313226     18.678   0.000       .5233246     .646748
   _cons |   11.38911   1.132516     10.056   0.000        9.15783    13.62039
------------------------------------------------------------------------------

test cv=0

 ( 1)  cv = 0.0

       F(  1,   233) =  348.86
            Prob > F =    0.0000

display 1-_coef[cv]
.41496366
A couple of new programs have been developed for Stata that deal with Box-Cox and Box-Tidwell transform. We will show how to use them here. The first procedure is boxcox, which is available in Stata 7. This procedure finds the maximum likelihood estimate of the parameter(s) of Box-Cox transform.
xi: boxcox dep asset1 i.nation i.sector, model(lhsonly)

i.nation          _Ination_1-4        (_Ination_1 for nation==CAN omitted)
i.sector          _Isector_1-10       (_Isector_1 for sector==AGR omitted)
Estimating comparison model

Iteration 0:   log likelihood = -1040.2744
Iteration 1:   log likelihood = -917.82824
Iteration 2:   log likelihood =  -909.0709
Iteration 3:   log likelihood = -909.05843
Iteration 4:   log likelihood = -909.05843

Estimating full model

Iteration 0:   log likelihood =  -908.4755
Iteration 1:   log likelihood = -820.15739
Iteration 2:   log likelihood = -819.63494
Iteration 3:   log likelihood =  -819.6349

                                                  Number of obs   =        248
                                                  LR chi2(13)     =     178.85
Log likelihood = -819.6349                        Prob > chi2     =      0.000

------------------------------------------------------------------------------
         dep |      Coef.   Std. Err.      z    P>|z|     [95% Conf. Interval]
-------------+----------------------------------------------------------------
      /theta |   .3063002   .0528239     5.80   0.000     .2027673    .4098331
------------------------------------------------------------------------------

Estimates of scale-variant parameters
----------------------------
             |      Coef.
-------------+--------------
Notrans      |
      asset1 |   .0299857
  _Ination_2 |  -.1459837
  _Ination_3 |  -.6117602
  _Ination_4 |  -1.407129
  _Isector_2 |  -2.923013
  _Isector_3 |  -.9114291
  _Isector_4 |   .1482129
  _Isector_5 |  -.2716637
  _Isector_6 |   .0036382
  _Isector_7 |   .3405276
  _Isector_8 |   .5982639
  _Isector_9 |   .6550884
 _Isector_10 |   1.048606
       _cons |   2.115848
-------------+--------------
      /sigma |   1.525277
----------------------------

---------------------------------------------------------
   Test         Restricted     LR statistic      P-Value
    H0:       log likelihood       chi2       Prob > chi2
---------------------------------------------------------
theta = -1      -1063.8257       488.38           0.000
theta =  0      -835.82415        32.38           0.000
theta =  1       -908.4755       177.68           0.000
---------------------------------------------------------
The Box-Tidwell transformation on page 325 using data file prestige.
use https://stats.idre.ucla.edu/stat/stata/examples/ara/prestige, clear

gen w2=percwomn*percwomn
gen linc =income*ln(income)
gen ledu =educat*ln(educat)
regress prestige percwomn w2 educat income
(Output omitted.)

gen b1=_coef[educat]
gen b2=_coef[income]
regress prestige percwomn w2 educat income linc ledu
(Output omitted.)

gen d1=_coef[ledu]
gen d2=_coef[linc]
display 1+d1/b1 /*frist-step approximation on educat*/
2.2435437

display 1+d2/b2 /*first-step approximation on income*/
-.91030351
We now use the procedure boxtid to get the fully iterated MLEs of the transformation parameters for educat and income. The boxtid command can be downloaded within Stata by typing search boxtid (see How can I use the search command to search for programs and get additional help? for more information about using search), as shown below.
boxtid regress prestige percwomn w2 educat income, df(percwomn w2:1)

Iteration 0:  Deviance =  675.2403
Iteration 1:  Deviance =  674.8334 (change = -.4068906)
Iteration 2:  Deviance =  674.8169 (change = -.0164992)
Iteration 3:  Deviance =  674.8155 (change = -.0014157)
Iteration 4:  Deviance =  674.8154 (change = -.0001051)
-> gen double Ieduc__1 = educat^2.1939-182.7 if e(sample)
-> gen double Ieduc__2 = educat^2.1939*ln(educat)-433.7 if e(sample)
-> gen double Iinco__1 = X^-0.0375-1.015 if e(sample)
-> gen double Iinco__2 = X^-0.0375*ln(X)+.3916 if e(sample)
   (where: X = income/10000)
-> gen double Iperc__1 = percwomn-28.98 if e(sample)
-> gen double Iw2__1 = w2-1836 if e(sample)

[Total iterations: 8]

Box-Tidwell regression model

  Source |       SS       df       MS                  Number of obs =     102
---------+------------------------------               F(  6,    95) =   90.29
   Model |  25435.2987     6  4239.21644               Prob > F      =  0.0000
Residual |  4460.12743    95  46.9487098               R-squared     =  0.8508
---------+------------------------------               Adj R-squared =  0.8414
   Total |  29895.4261   101  295.994318               Root MSE      =  6.8519

------------------------------------------------------------------------------
prestige |      Coef.   Std. Err.       t     P>|t|       [95% Conf. Interval]
---------+--------------------------------------------------------------------
Ieduc__1 |   .0984751   .1767093      0.557   0.579      -.2523372    .4492873
Ieduc_p1 |  -.0001244    .060728     -0.002   0.998      -.1206846    .1204359
Iinco__1 |  -333.2435   1640.086     -0.203   0.839      -3589.226    2922.739
Iinco_p1 |   .1065035   59.25056      0.002   0.999      -117.5207    117.7337
Iperc__1 |  -.1658225   .0903862     -1.835   0.070      -.3452618    .0136168
  Iw2__1 |   .0024899    .000972      2.562   0.012       .0005603    .0044195
   _cons |   47.51562   1.063237     44.690   0.000       45.40483    49.62641
------------------------------------------------------------------------------
educat   |   3.806089   .3444647     11.049   Nonlin. dev. 5.019   (P = 0.031)
      p1 |   2.193927   .6218453      3.528
------------------------------------------------------------------------------
income   |   .0011613     .00028      4.147   Nonlin. dev. 26.178  (P = 0.000)
      p1 |  -.0375134   .1638984     -0.229
------------------------------------------------------------------------------
Deviance:  674.815.
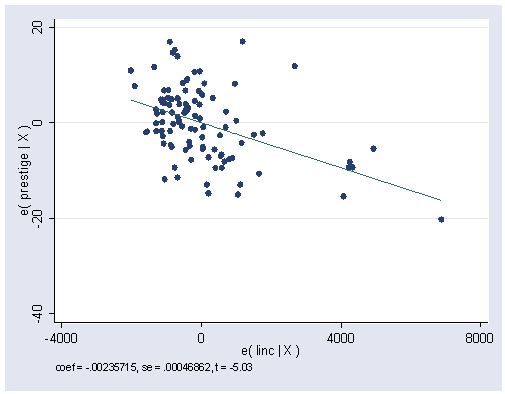
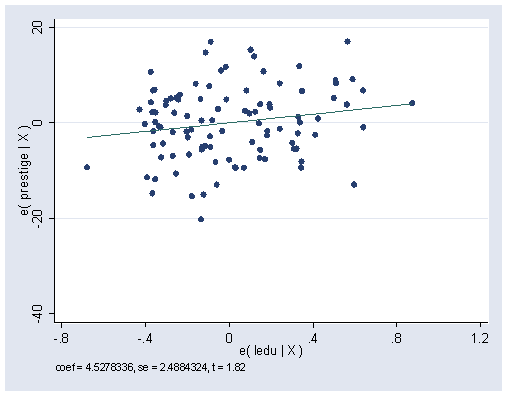
Figure 12.10. (a) and (b) on page 326 using the data file prestige. The constructed-variable plot in this case is the added variable plot for the constructed variable X*log(X).
regress prestige percwomn w2 educat income
(Output omitted)

avplot linc, ylabel(-40(20)20) xlabel(-4000(4000)8000)
avplot ledu, ylabel(-40(20)20) xlabel(-.8(.4)1.2)
use https://stats.idre.ucla.edu/stat/stata/examples/ara/ornstein, clear

gen asset1=sqrt(assets)
gen y=intrlcks+1
xi: regress y asset1 i.nation i.sector  /*generate residuals*/
(Output omitted)

predict res, r
predict fitted, xb
gen res2=res*res
egen m= mean(res2)
gen u=res2/m  /*generate U_i**/
regress u fitted

  Source |       SS       df       MS                  Number of obs =     248
---------+------------------------------               F(  1,   246) =   45.73
   Model |   147.64882     1   147.64882               Prob > F      =  0.0000
Residual |  794.296284   246  3.22884668               R-squared     =  0.1567
---------+------------------------------               Adj R-squared =  0.1533
   Total |  941.945104   247  3.81354293               Root MSE      =  1.7969

------------------------------------------------------------------------------
       u |      Coef.   Std. Err.       t     P>|t|       [95% Conf. Interval]
---------+--------------------------------------------------------------------
  fitted |   .0594211   .0087872      6.762   0.000       .0421134    .0767288
   _cons |   .1336017   .1715663      0.779   0.437      -.2043246    .4715279
------------------------------------------------------------------------------

display 147.6488/2
73.8244

egen ybar=mean(fitted)
display 1-0.5*0.0594*ybar
.56695483

xi: regress u asset1 i.nation i.sector

i.nation              Inatio_1-4   (Inatio_1 for nation==CAN omitted)
i.sector              Isect_1-10   (Isect_1 for sector==AGR omitted)

  Source |       SS       df       MS                  Number of obs =     248
---------+------------------------------               F( 13,   234) =    4.04
   Model |  172.590223    13   13.276171               Prob > F      =  0.0000
Residual |   769.35488   234  3.28784137               R-squared     =  0.1832
---------+------------------------------               Adj R-squared =  0.1379
   Total |  941.945104   247  3.81354293               Root MSE      =  1.8132

(More output omitted)

