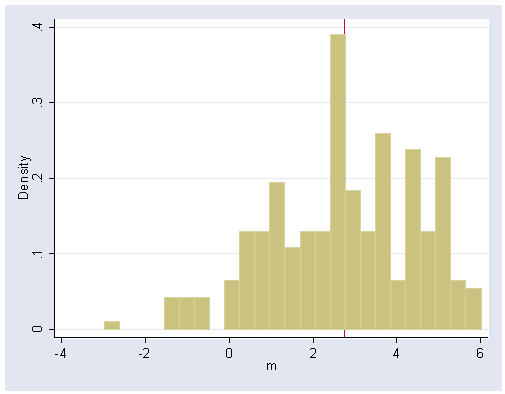
The first example is of income of four married couples from table 16.1. First we create a data set of four variables with 256 observations of table 16.2 using the command cross. Then we use the egen command to generate a variable with the mean across each row.
input a1
6
-3
5
3
end

save a1
rename a1 a2
save a2
rename a2 a3
save a3
rename a3 a4
save a4
use a1, clear
cross using a2
cross using a3
cross using a4
count

* Stata 8 code.
egen m=rmean(a1 a2 a3 a4)

* Stata 9 code.
egen m=rowmean(a1 a2 a3 a4)

list in 1/10

            a1         a2         a3         a4          m
  1.         6          6          6          6          6
  2.        -3          6          6          6       3.75
  3.         5          6          6          6       5.75
  4.         3          6          6          6       5.25
  5.         6         -3          6          6       3.75
  6.         6          5          6          6       5.75
  7.         6          3          6          6       5.25
  8.        -3         -3          6          6        1.5
  9.        -3          5          6          6        3.5
 10.        -3          3          6          6          3

sum m

Variable |     Obs        Mean   Std. Dev.       Min        Max
---------+-----------------------------------------------------
       m |     256        2.75   1.748949         -3          6

di sqrt(r(Var)*255/256)
1.74553
Figure 16.1, page 498.
histogram m, xline(2.75) bin(25)
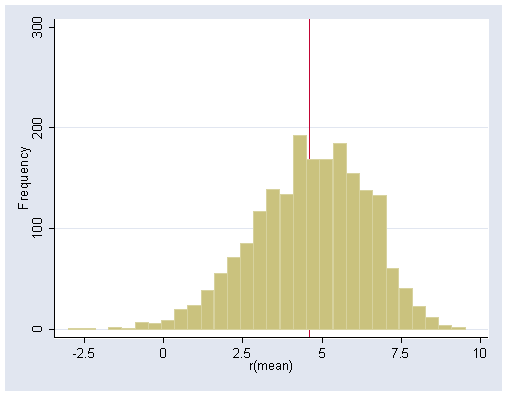
The second example of 10 married couples is based on Table 16.3, page 499. First we create a data set based on Table 16.3. Then we run Stata bootstrapping command bootstrap to get bootstrap estimate of our statistic. We save the result of in a data file called bmean. Then we use bmean to graph the frequency graph (figure 16.2).
clear
input husinc wifinc
24 18
14 17
40 35
44 41
24 18
19 9
21 10
22 30
30 23
24 15
end

label variable husinc "Husband's Income"
label variable wifinc "Wife's Income"
gen diff=husinc-wifinc

* Stata 8 code.
bs "sum diff" "r(mean)", reps(2000) saving(bmean) replace

* Stata 9 code and output.
bootstrap r(mean), reps(2000) saving(bmean, replace) nodots: summarize diff

Bootstrap results                               Number of obs      =        10
                                                Replications       =      2000

      command:  summarize diff
        _bs_1:  r(mean)

------------------------------------------------------------------------------
             |   Observed   Bootstrap                         Normal-based
             |      Coef.   Std. Err.      z    P>|z|     [95% Conf. Interval]
-------------+----------------------------------------------------------------
       _bs_1 |        4.6   1.839707     2.50   0.012     .9942402     8.20576
------------------------------------------------------------------------------

estat bootstrap, all

Bootstrap results                               Number of obs      =        10
                                                Replications       =      2000

      command:  summarize diff
        _bs_1:  r(mean)

------------------------------------------------------------------------------
             |    Observed               Bootstrap
             |       Coef.       Bias    Std. Err.  [95% Conf. Interval]
-------------+----------------------------------------------------------------
       _bs_1 |         4.6     .04165   1.8397072    .9942402    8.20576   (N)
             |                                             .8        7.9   (P)
             |                                             .6        7.8  (BC)
------------------------------------------------------------------------------


use bmean, clear
(bs: sum diff)

histogram _bs_1, ylabel(0(100)300) xlabel(-2.5(2.5)10) xline(4.6) freq bin(30)
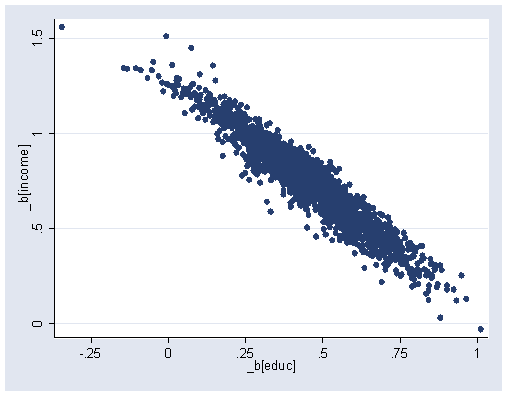
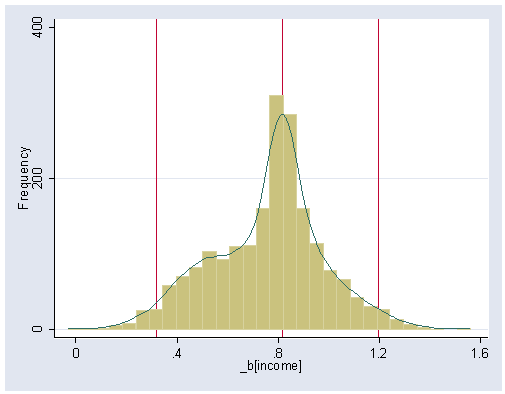
Bootstrapping regression using the data file duncan. The results below are different from table 16.5 since the robust regression procedure in Stata switches from Huber to biweight during the calculation.
use https://stats.idre.ucla.edu/stat/stata/examples/ara/duncan, clear
(From Fox, Applied Regression Analysis.  Use 'notes' command for source of data)

* Stata 8 code.
bs "rreg prestige income educ" "_b[_cons] _b[income] _b[educ]", reps(2000) saving(bsreg)replace

* Stata 9 code and output.
bootstrap _b[_cons] _b[income] _b[educ], nodots reps(2000) saving(bsreg): rreg prestige income educ

Bootstrap results                               Number of obs      =        45
                                                Replications       =      2000

      command:  rreg prestige income educ
        _bs_1:  _b[_cons]
        _bs_2:  _b[income]
        _bs_3:  _b[educ]

------------------------------------------------------------------------------
             |   Observed   Bootstrap                         Normal-based
             |      Coef.   Std. Err.      z    P>|z|     [95% Conf. Interval]
-------------+----------------------------------------------------------------
       _bs_1 |  -7.494021   3.271312    -2.29   0.022    -13.90567   -1.082367
       _bs_2 |   .8173336   .2216021     3.69   0.000     .3830014    1.251666
       _bs_3 |   .4048997   .1729308     2.34   0.019     .0659615    .7438378
------------------------------------------------------------------------------

estat bootstrap, all

Bootstrap results                               Number of obs      =        45
                                                Replications       =      2000

      command:  rreg prestige income educ
        _bs_1:  _b[_cons]
        _bs_2:  _b[income]
        _bs_3:  _b[educ]

------------------------------------------------------------------------------
             |    Observed               Bootstrap
             |       Coef.       Bias    Std. Err.  [95% Conf. Interval]
-------------+----------------------------------------------------------------
       _bs_1 |  -7.4940207   .3841781   3.2713122   -13.90567  -1.082367   (N)
             |                                      -13.74599  -.7356365   (P)
             |                                       -14.3746  -1.428915  (BC)
       _bs_2 |   .81733357  -.0648613   .22160211    .3830014   1.251666   (N)
             |                                       .3127698   1.181602   (P)
             |                                       .3954319   1.298244  (BC)
       _bs_3 |   .40489969   .0430808   .17293081    .0659615   .7438378   (N)
             |                                       .0976094   .7941965   (P)
             |                                       .0023464    .725504  (BC)
------------------------------------------------------------------------------
(N)    normal confidence interval
(P)    percentile confidence interval
(BC)   bias-corrected confidence interval
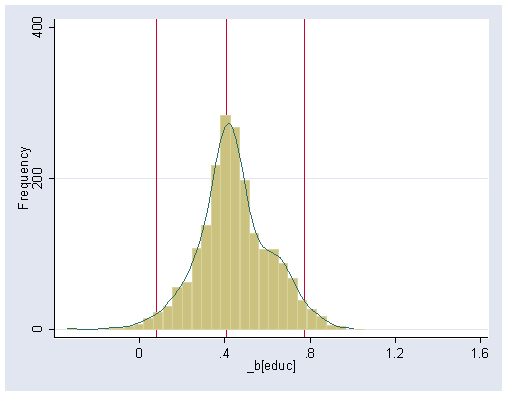
Figure 16.3 (a), page 508. Confidence interval used where based of the percentile estimates.
use bsreg, clear
(bs: rreg prestige income educ)

histogram _bs_2, kdensity bin(30) ylabel(0 200 400) xlabel(0(.4)1.6) frequency xline(.318 .817 1.197)
histogram _bs_3, kdensity bin(30) ylabel(0 200 400) xlabel(0(.4)1.6) frequency xline(.075 .405 .771)
graph twoway scatter _bs_2 _bs_3, ylabel(0(.5)1.5) xlabel(-.25(.25)1)