Table in the middle of page 160 on data file duncan.
use https://stats.idre.ucla.edu/stat/stata/examples/ara/duncan, clear
(From Fox, Applied Regression Analysis.  Use 'notes' command for source of data)

sort occ_type
by occ_type: summarize prestige

-> occ_type=      bc
Variable |     Obs        Mean   Std. Dev.       Min        Max
---------+-----------------------------------------------------
prestige |      21     22.7619   18.05521          3         67

-> occ_type=    prof
Variable |     Obs        Mean   Std. Dev.       Min        Max
---------+-----------------------------------------------------
prestige |      18    80.44444   14.10558         45         97

-> occ_type=      wc
Variable |     Obs        Mean   Std. Dev.       Min        Max
---------+-----------------------------------------------------
prestige |       6    36.66667   11.79265         16         52
Figure 8.1, page 161 using teh data file duncan.
graph box prestige, over(occ_type) ylabel(0 50 100)
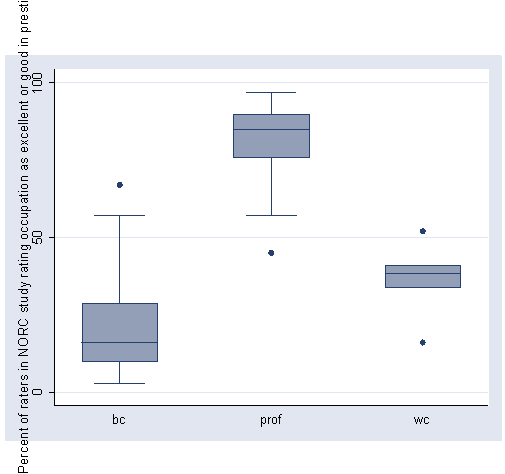
Table in the middle of page 161 using the data file duncan.
anova prestige occ_type
                           Number of obs =      45     R-squared     =  0.7574
                           Root MSE      = 15.8847     Adj R-squared =  0.7459

                  Source |  Partial SS    df       MS           F     Prob > F
              -----------+----------------------------------------------------
                   Model |  33090.0571     2  16545.0286      65.57     0.0000
                         |
                occ_type |  33090.0571     2  16545.0286      65.57     0.0000
                         |
                Residual |  10597.5873    42  252.323507
              -----------+----------------------------------------------------
                   Total |  43687.6444    44   992.90101
Table 8.2 on page 167 using the data file moore.
use https://stats.idre.ucla.edu/stat/stata/examples/ara/moore, clear
(From Fox, Applied Regression Analysis.  Use 'notes' command for source of data)

table status fcat, contents(n conform mean conform sd conform)

----------+-----------------------------
Status of |     F-scale categorized
partner   |     high       low    medium
----------+-----------------------------
     high |        7         5        11
          | 11.85714      17.4  14.27273
          | 3.933979  4.505552  3.951985
          |
      low |        8        10         4
          |   12.625       8.9      7.25
          | 7.347254  2.643651  3.947573
----------+-----------------------------
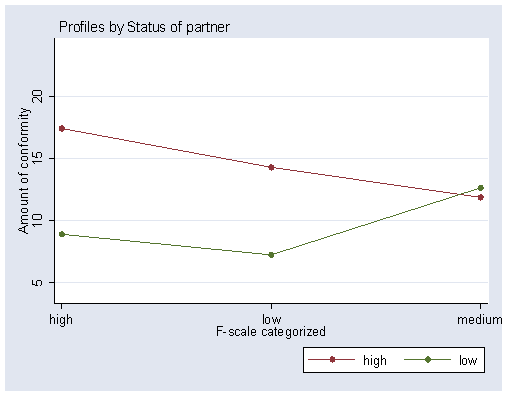
Figure 8.5 on page 169 using the data file moore. In the first part, we use a anovaplot program. Next, we will try to create the graph directly.
Using anovaplot program. You can download anovaplot from within Stata by typing search anovaplot (see How can I use the search command to search for programs and get additional help? for more information about using search).
recode fcat 1=3 2=1 3=2
anovaplot, scatter(msymbol(none)) ylabel(5(5)20)
Next we do it directly.
use https://stats.idre.ucla.edu/stat/stata/examples/ara/moore, clear
(From Fox, Applied Regression Analysis.  Use 'notes' command for source of data)

recode fcat 1=3 2=1 3=2
label define flab 1 low 2 medium 3 high
label value fcat flab
egen xmeanh = mean(conform) if (status==1), by(fcat)
egen xmeanl = mean(conform) if (status==2), by(fcat)
graph twoway (scatter xmeanl fcat, connect(l) sort)  ///
	(scatter xmeanh fcat, connect(l) sort), xlabel(1 2 3) ylabel(5(5)20)
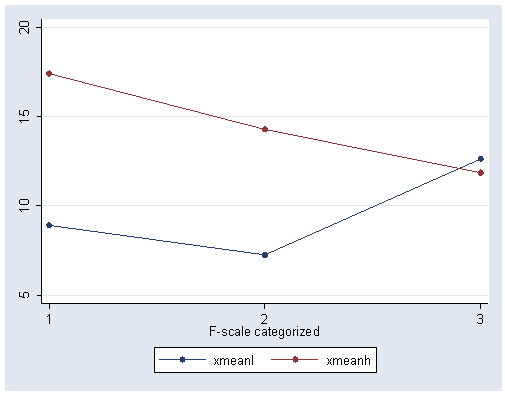
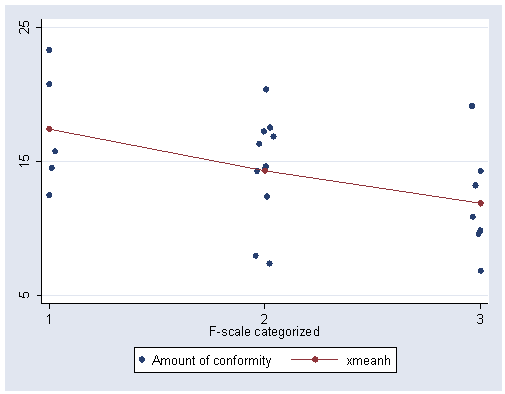
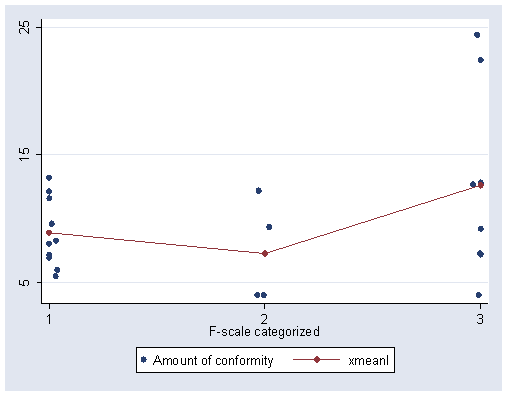
Figure 8.6 on page 170 using the data file moore.
graph twoway (scatter conform fcat if status ==1, jitter(5)) ///
	(scatter xmeanh fcat, connect(l) sort), xlabel(1 2 3) ylabel(5 15 25)
graph twoway (scatter conform fcat if status ==2, jitter(5)) ///
	(scatter xmeanl fcat, connect(l) sort), xlabel(1 2 3) ylabel(5 15 25)
Results on page 177 using the data file moore.
use https://stats.idre.ucla.edu/stat/stata/examples/ara/moore, clear
(From Fox, Applied Regression Analysis.  Use 'notes' command for source of data )

gen c1=1 if  (fcat==1)
gen c2=0 if  (fcat==1)
replace c1=0 if  (fcat==2)
replace c2=1 if  (fcat==2)
replace c1=-1 if (fcat==3)
replace c2=-1 if (fcat==3)
gen r=1 if(status==1)
replace r=-1 if(status==2)
gen rc1=r*c1
gen rc2=r*c2
The anova procedures below give the sum of squares on page 177 and the tests yield table 8.6 on page 178. Also notice that the F-values for the case alpha|beta and the case beta|alpha are different from the results in the book as different degree of freedom has been used in both cases.
anova conform r c1 c2 rc1 rc2 , se cont(r c1 c2 rc1 rc2)

                           Number of obs =      45     R-squared     =  0.3237
                           Root MSE      = 4.57912     Adj R-squared =  0.2370

                  Source |    Seq. SS     df       MS           F     Prob > F
              -----------+----------------------------------------------------
                   Model |  391.436039     5  78.2872078       3.73     0.0074
                         |
                       r |  204.332411     1  204.332411       9.74     0.0034
                      c1 |  7.92747828     1  7.92747828       0.38     0.5422
                      c2 |  3.68722176     1  3.68722176       0.18     0.6773
                     rc1 |  111.656569     1  111.656569       5.33     0.0264
                     rc2 |  63.8323592     1  63.8323592       3.04     0.0889
                         |
                Residual |  817.763961    39  20.9683067
              -----------+----------------------------------------------------
                   Total |     1209.20    44  27.4818182

test r

                  Source |  Partial SS    df       MS           F     Prob > F
              -----------+----------------------------------------------------
                       r |   239.56237     1   239.56237      11.42     0.0017
                Residual |  817.763961    39  20.9683067


test rc1 rc2

                  Source |  Partial SS    df       MS           F     Prob > F
              -----------+----------------------------------------------------
                 rc1 rc2 |  175.488928     2  87.7444639       4.18     0.0226
                Residual |  817.763961    39  20.9683067


test c1 c2

                  Source |  Partial SS    df       MS           F     Prob > F
              -----------+----------------------------------------------------
                   c1 c2 |  36.0187056     2  18.0093528       0.86     0.4315
                Residual |  817.763961    39  20.9683067


anova conform r c1 c2, se cont(r c1 c2)

                           Number of obs =      45     R-squared     =  0.1786
                           Root MSE      = 4.92196     Adj R-squared =  0.1185

                  Source |    Seq. SS     df       MS           F     Prob > F
              -----------+----------------------------------------------------
                   Model |  215.947111     3  71.9823704       2.97     0.0428
                         |
                       r |  204.332411     1  204.332411       8.43     0.0059
                      c1 |  7.92747828     1  7.92747828       0.33     0.5704
                      c2 |  3.68722176     1  3.68722176       0.15     0.6985
                         |
                Residual |  993.252889    41  24.2256802
              -----------+----------------------------------------------------
                   Total |     1209.20    44  27.4818182


test r

                  Source |  Partial SS    df       MS           F     Prob > F
              -----------+----------------------------------------------------
                       r |  212.213778     1  212.213778       8.76     0.0051
                Residual |  993.252889    41  24.2256802


test c1 c2

                  Source |  Partial SS    df       MS           F     Prob > F
              -----------+----------------------------------------------------
                   c1 c2 |     11.6147     2  5.80735002       0.24     0.7879
                Residual |  993.252889    41  24.2256802


anova conform r rc1 rc2, se cont(r rc1 rc2)

                           Number of obs =      45     R-squared     =  0.2939
                           Root MSE      = 4.56333     Adj R-squared =  0.2423

                  Source |    Seq. SS     df       MS           F     Prob > F
              -----------+----------------------------------------------------
                   Model |  355.417333     3  118.472444       5.69     0.0024
                         |
                       r |  204.332411     1  204.332411       9.81     0.0032
                     rc1 |  85.0926235     1  85.0926235       4.09     0.0498
                     rc2 |  65.9922988     1  65.9922988       3.17     0.0825
                         |
                Residual |  853.782667    41  20.8239675
              -----------+----------------------------------------------------
                   Total |     1209.20    44  27.4818182


anova conform c1 c2 rc1 rc2, se cont(c1 c2 rc1 rc2)

                           Number of obs =      45     R-squared     =  0.1256
                           Root MSE      = 5.14132     Adj R-squared =  0.0382

                  Source |    Seq. SS     df       MS           F     Prob > F
              -----------+----------------------------------------------------
                   Model |  151.873669     4  37.9684173       1.44     0.2398
                         |
                      c1 |  .133333333     1  .133333333       0.01     0.9437
                      c2 |        3.60     1        3.60       0.14     0.7140
                     rc1 |  82.6026667     1  82.6026667       3.12     0.0847
                     rc2 |  65.5376692     1  65.5376692       2.48     0.1232
                         |
                Residual |  1057.32633    40  26.4331583
              -----------+----------------------------------------------------
                   Total |     1209.20    44  27.4818182


anova conform r, se cont(r)

                           Number of obs =      45     R-squared     =  0.1690
                           Root MSE      = 4.83415     Adj R-squared =  0.1497

                  Source |    Seq. SS     df       MS           F     Prob > F
              -----------+----------------------------------------------------
                   Model |  204.332411     1  204.332411       8.74     0.0050
                         |
                       r |  204.332411     1  204.332411       8.74     0.0050
                         |
                Residual |  1004.86759    43  23.3690137
              -----------+----------------------------------------------------
                   Total |     1209.20    44  27.4818182


anova conform c1 c2, se cont(c1 c2)

                           Number of obs =      45     R-squared     =  0.0031
                           Root MSE      = 5.35739     Adj R-squared = -0.0444

                  Source |    Seq. SS     df       MS           F     Prob > F
              -----------+----------------------------------------------------
                   Model |  3.73333333     2  1.86666667       0.07     0.9371
                         |
                      c1 |  .133333333     1  .133333333       0.00     0.9460
                      c2 |        3.60     1        3.60       0.13     0.7250
                         |
                Residual |  1205.46667    42  28.7015873
              -----------+----------------------------------------------------
                   Total |     1209.20    44  27.4818182
Result in the middle of page 192 using the data file moore.
use https://stats.idre.ucla.edu/stat/stata/examples/ara/moore, clear
(From Fox, Applied Regression Analysis.  Use 'notes' command for source of data> )

gen d=1 if(status==2)
(23 missing values generated)

replace d=0 if(status==1)
(23 real changes made)

gen intfd=fscore*d
reg conform fscore d intfd

  Source |       SS       df       MS                  Number of obs =      45
---------+------------------------------               F(  3,    41) =    5.70
   Model |  355.782627     3  118.594209               Prob > F      =  0.0023
Residual |  853.417373    41  20.8150579               R-squared     =  0.2942
---------+------------------------------               Adj R-squared =  0.2426
   Total |     1209.20    44  27.4818182               Root MSE      =  4.5624

------------------------------------------------------------------------------
 conform |      Coef.   Std. Err.       t     P>|t|       [95% Conf. Interval]
---------+--------------------------------------------------------------------
  fscore |  -.1510988   .0717105     -2.107   0.041      -.2959211   -.0062766
       d |  -15.53408   4.400445     -3.530   0.001      -24.42096   -6.647198
   intfd |   .2611023   .0969992      2.692   0.010       .0652084    .4569961
   _cons |   20.79348   3.262732      6.373   0.000       14.20425     27.3827
------------------------------------------------------------------------------
Result on page 194 using the same data file as above.
gen s=1 if(status==2)
(23 missing values generated)

replace s=-1 if(status==1)
(23 real changes made)

gen intfs=fscore*s
reg conform fscore s intfs

  Source |       SS       df       MS                  Number of obs =      45
---------+------------------------------               F(  3,    41) =    5.70
   Model |  355.782627     3  118.594209               Prob > F      =  0.0023
Residual |  853.417373    41  20.8150579               R-squared     =  0.2942
---------+------------------------------               Adj R-squared =  0.2426
   Total |     1209.20    44  27.4818182               Root MSE      =  4.5624

------------------------------------------------------------------------------
 conform |      Coef.   Std. Err.       t     P>|t|       [95% Conf. Interval]
---------+--------------------------------------------------------------------
  fscore |  -.0205477   .0484996     -0.424   0.674      -.1184946    .0773992
       s |  -7.767039   2.200223     -3.530   0.001      -12.21048   -3.323599
   intfs |   .1305511   .0484996      2.692   0.010       .0326042    .2284981
   _cons |   13.02644   2.200223      5.921   0.000       8.582997    17.46988
------------------------------------------------------------------------------
Table in the middle of page 197 using teh data file friendly.
use https://stats.idre.ucla.edu/stat/stata/examples/ara/friendly, clear
(From Fox, Applied Regression Analysis.  Use 'notes' command for source of data )

sort cond
by cond: summarize correct

-> cond=Before
Variable |     Obs        Mean   Std. Dev.       Min        Max
---------+-----------------------------------------------------
 correct |      10        36.6   5.337498         24         40

-> cond=Meshed
Variable |     Obs        Mean   Std. Dev.       Min        Max
---------+-----------------------------------------------------
 correct |      10        36.6   3.025815         30         40

-> cond=SFR
Variable |     Obs        Mean   Std. Dev.       Min        Max
---------+-----------------------------------------------------
 correct |      10        30.3   7.334091         21         39
Figure 8.8 on page 198.
use https://stats.idre.ucla.edu/stat/stata/examples/ara/friendly, clear
(From Fox, Applied Regression Analysis.  Use 'notes' command for source of data )

egen cm=mean(correct), by(cond)
encode cond, gen (x)
graph twoway (scatter correct x, jitter(5)) (scatter cm x, connect(l) sort), xlabel(1 2 3)
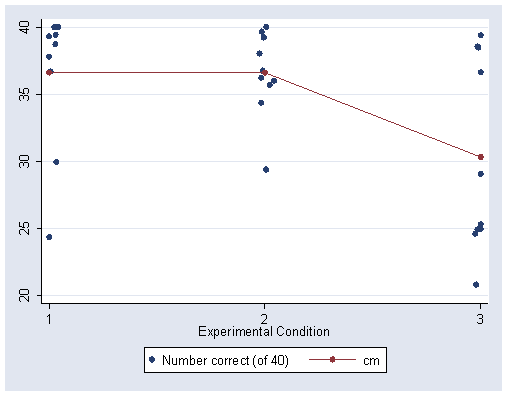
Table at bottom of page 199 First we do the encoding based on the scheme on page 198.
use https://stats.idre.ucla.edu/stat/stata/examples/ara/friendly, clear
(From Fox, Applied Regression Analysis.  Use 'notes' command for source of data )

gen c1=1 if(cond=="SFR")
(20 missing values generated)

gen c2=0 if(cond=="SFR")
(20 missing values generated)

replace c1=-1/2 if(cond=="Before")
(10 real changes made)

replace c2=1 if(cond=="Before")
(10 real changes made)

replace c1=-1/2 if(cond=="Meshed")
(10 real changes made)

replace c2=-1 if(cond=="Meshed")
(10 real changes made)

reg correct c1 c2

  Source |       SS       df       MS                  Number of obs =      30
---------+------------------------------               F(  2,    27) =    4.34
   Model |      264.60     2      132.30               Prob > F      =  0.0232
Residual |      822.90    27  30.4777778               R-squared     =  0.2433
---------+------------------------------               Adj R-squared =  0.1873
   Total |     1087.50    29       37.50               Root MSE      =  5.5207

------------------------------------------------------------------------------
 correct |      Coef.   Std. Err.       t     P>|t|       [95% Conf. Interval]
---------+--------------------------------------------------------------------
      c1 |       -4.2    1.42543     -2.946   0.007      -7.124742   -1.275258
      c2 |          0   1.234459      0.000   1.000      -2.532901    2.532901
   _cons |       34.5   1.007932     34.229   0.000        32.4319     36.5681
------------------------------------------------------------------------------

anova correct c1 c2, se cont(c1 c2)

                          Number of obs =      30     R-squared     =  0.2433
                           Root MSE      = 5.52067     Adj R-squared =  0.1873

                  Source |    Seq. SS     df       MS           F     Prob > F
              -----------+----------------------------------------------------
                   Model |      264.60     2      132.30       4.34     0.0232
                         |
                      c1 |      264.60     1      264.60       8.68     0.0065
                      c2 |        0.00     1        0.00       0.00     1.0000
                         |
                Residual |      822.90    27  30.4777778
              -----------+----------------------------------------------------
                   Total |     1087.50    29       37.50