Regression analysis middle of page 269. Make measwt by female interaction and then run regression with the interaction.
use https://stats.idre.ucla.edu/stat/stata/examples/ara/davis, clear

generate measwt_f = measwt * female
regress reptwt measwt female measwt_f

  Source |       SS       df       MS                  Number of obs =     183
---------+------------------------------               F(  3,   179) =  470.41
   Model |  30654.7294     3  10218.2431               Prob > F      =  0.0000
Residual |  3888.25423   179  21.7220907               R-squared     =  0.8874
---------+------------------------------               Adj R-squared =  0.8856
   Total |  34542.9836   182  189.796613               Root MSE      =  4.6607

------------------------------------------------------------------------------
  reptwt |      Coef.   Std. Err.       t     P>|t|       [95% Conf. Interval]
---------+--------------------------------------------------------------------
  measwt |   .9898221   .0425995     23.236   0.000       .9057602    1.073884
  female |   39.96412   3.929322     10.171   0.000       32.21037    47.71787
measwt_f |  -.7253627   .0559804    -12.957   0.000      -.8358292   -.6148963
   _cons |    1.35864   3.277192      0.415   0.679      -5.108262    7.825541
------------------------------------------------------------------------------
Save version with error (for use later) as davis_er.
save davis_er, replace
file davis_er.dta saved
Regression at bottom of 269. Fix error in case 12, and run the regression from above again. Fix error in case 12.
generate t = measwt in 12
(199 missing values generated)

replace measwt = measht in 12
(1 real change made)

replace measht = t in 12
(1 real change made)

drop t
Make measwt by female interaction again.
replace measwt_f = measwt * female
Run regression.
regress reptwt measwt female measwt_f

  Source |       SS       df       MS                  Number of obs =     183
---------+------------------------------               F(  3,   179) = 2228.78
   Model |  33642.3446     3  11214.1149               Prob > F      =  0.0000
Residual |  900.638968   179  5.03150261               R-squared     =  0.9739
---------+------------------------------               Adj R-squared =  0.9735
   Total |  34542.9836   182  189.796613               Root MSE      =  2.2431

------------------------------------------------------------------------------
  reptwt |      Coef.   Std. Err.       t     P>|t|       [95% Conf. Interval]
---------+--------------------------------------------------------------------
  measwt |   .9898221   .0205023     48.279   0.000       .9493648    1.030279
  female |   1.982518   2.450282      0.809   0.420      -2.852638    6.817673
measwt_f |  -.0566831   .0384548     -1.474   0.142      -.1325662    .0191999
   _cons |    1.35864   1.577248      0.861   0.390      -1.753752    4.471032
------------------------------------------------------------------------------
Save corrected version (for use later) as davis_co.
save davis_co, replace
file davis_co.dta saved
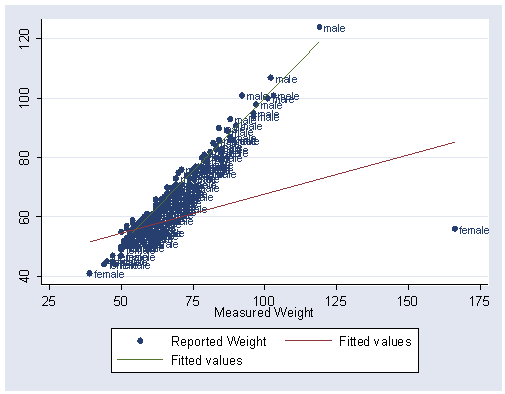
Page 270, figure 11.2. Show graph similar to figure 11.2 showing outlier. Use the data file with the error.
use https://stats.idre.ucla.edu/stat/stata/examples/ara/davis_er, clear
Run the regression.
regress reptwt measwt female measwt_f

  Source |       SS       df       MS                  Number of obs =     183
---------+------------------------------               F(  3,   179) =  470.41
   Model |  30654.7294     3  10218.2431               Prob > F      =  0.0000
Residual |  3888.25423   179  21.7220907               R-squared     =  0.8874
---------+------------------------------               Adj R-squared =  0.8856
   Total |  34542.9836   182  189.796613               Root MSE      =  4.6607

------------------------------------------------------------------------------
  reptwt |      Coef.   Std. Err.       t     P>|t|       [95% Conf. Interval]
---------+--------------------------------------------------------------------
  measwt |   .9898221   .0425995     23.236   0.000       .9057602    1.073884
  female |   39.96412   3.929322     10.171   0.000       32.21037    47.71787
measwt_f |  -.7253627   .0559804    -12.957   0.000      -.8358292   -.6148963
   _cons |    1.35864   3.277192      0.415   0.679      -5.108262    7.825541
------------------------------------------------------------------------------
predict yhat
graph twoway (scatter reptwt measwt, mlabel(female)) (line yhat measwt if female == 1, sort) ///
	(line yhat measwt if female == 0, sort), xlabel(25(25)175)
Middle of page 270, regression analysis. (Note errata: last term should be reptwt x female). Stata results match the results in Fox.
generate reptwt_f = reptwt * female
(17 missing values generated)

regress measwt reptwt female reptwt_f

  Source |       SS       df       MS                  Number of obs =     183
---------+------------------------------               F(  3,   179) =  139.07
   Model |  29786.3783     3  9928.79278               Prob > F      =  0.0000
Residual |  12779.4359   179  71.3934965               R-squared     =  0.6998
---------+------------------------------               Adj R-squared =  0.6947
   Total |  42565.8142   182    233.8781               Root MSE      =  8.4495

------------------------------------------------------------------------------
  measwt |      Coef.   Std. Err.       t     P>|t|       [95% Conf. Interval]
---------+--------------------------------------------------------------------
  reptwt |   .9689183   .0764096     12.681   0.000       .8181387    1.119698
  female |   2.074211   9.297269      0.223   0.824      -16.27214    20.42056
reptwt_f |  -.0095251   .1468546     -0.065   0.948      -.2993141    .2802639
   _cons |    1.79428   5.923944      0.303   0.762       -9.89547    13.48403
------------------------------------------------------------------------------
Page 271, make hat value and show largest hat values.
Run the regression.
regress reptwt measwt female measwt_f

  Source |       SS       df       MS                  Number of obs =     183
---------+------------------------------               F(  3,   179) =  470.41
   Model |  30654.7294     3  10218.2431               Prob > F      =  0.0000
Residual |  3888.25423   179  21.7220907               R-squared     =  0.8874
---------+------------------------------               Adj R-squared =  0.8856
   Total |  34542.9836   182  189.796613               Root MSE      =  4.6607

------------------------------------------------------------------------------
  reptwt |      Coef.   Std. Err.       t     P>|t|       [95% Conf. Interval]
---------+--------------------------------------------------------------------
  measwt |   .9898221   .0425995     23.236   0.000       .9057602    1.073884
  female |   39.96412   3.929322     10.171   0.000       32.21037    47.71787
measwt_f |  -.7253627   .0559804    -12.957   0.000      -.8358292   -.6148963
   _cons |    1.35864   3.277192      0.415   0.679      -5.108262    7.825541
------------------------------------------------------------------------------
Generate hat values, calling the result myhat.
predict myhat, hat
Middle of page 271, get the largest hat value, .714.
summarize myhat, detail

                          Leverage
-------------------------------------------------------------
      Percentiles      Smallest
 1%     .0099067       .0099067
 5%     .0099302       .0099067
10%     .0101496       .0099067       Obs                 200
25%     .0110274       .0099067       Sum of Wgt.         200

50%     .0131432                      Mean           .0212232
                        Largest       Std. Dev.      .0514178
75%     .0185647       .0687759
90%     .0285695       .0732077       Variance       .0026438
95%     .0456122       .1668405       Skewness       12.45924
99%     .1200241       .7141857       Kurtosis       166.9527
Lower part of page 271, subject 12 has the hat value over .7.
list subject myhat if myhat > .7

       subject      myhat
 12.        12   .7141857
Page 274, middle of page. Make studentized residual and show largest value.
Make residual.
predict res, rstud
(17 missing values generated)
Get the largest studentized residual, -24.3.
summarize res, detail

                    Studentized residuals
-------------------------------------------------------------
      Percentiles      Smallest
 1%    -2.349376      -24.30446
 5%    -1.466444      -2.349376
10%    -.9816217      -2.189853       Obs                 183
25%    -.5037653      -1.959426       Sum of Wgt.         183

50%    -.0284926                      Mean          -.0961781
                        Largest       Std. Dev.      2.008318
75%     .4462518       2.393195
90%     1.040694        2.90657       Variance       4.033341
95%     1.566641       3.081378       Skewness      -9.557869
99%     3.081378       3.496628       Kurtosis       116.8471
Subject 12 had the largest residual.
list subject res if res < -24.3

       subject        res
 12.        12  -24.30446
Middle of page 276, computing DFBETA and making index plot (plot described but not shown). The dfbeta command computes the DFBETA for measwt (called DFmeaswt), for female (called DFfemale, and for measwt_f (called DF1).
dfbeta
(17 missing values generated)
DFmeaswt:  DFbeta(measwt)
(17 missing values generated)
DFfemale:  DFbeta(female)
(17 missing values generated)
DF1:       DFbeta(measwt_f)
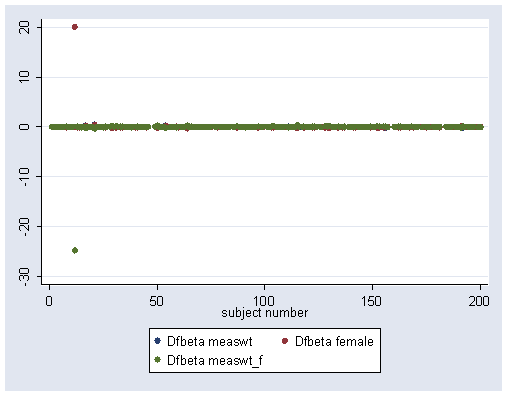
Index plot shows an observation influencing female and influencing female*measwt.
rename DFmeaswt_f DF1

graph twoway scatter DFmeaswt DFfemale DF1 subject
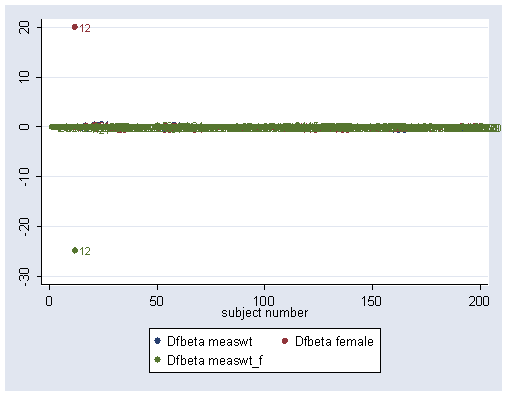
Show same plot, but use subject number as symbol to identify which subject has influential data. It is subject 12.
graph twoway scatter DFmeaswt DFfemale DF1 subject, mlabel(subject subject subject)
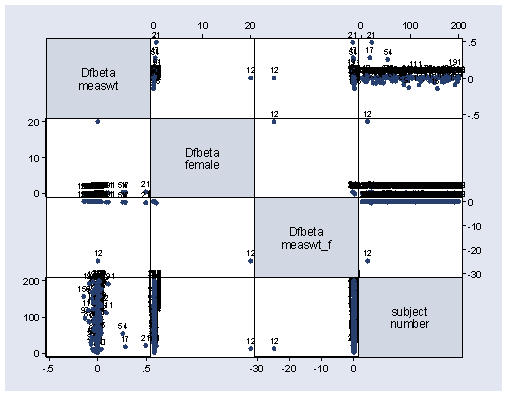
Scatterplot of dfbetas, suggested near bottom page 276.
graph matrix DFmeaswt DFfemale DF1 subject, mlabel(subject)
Bottom part of page 277, computing and showing Cook’s D, DFFITS, DFBETAS.
Already computed DFBETA above using dfbeta command.
Compute Cook’s D.
predict d, cooksd
(17 missing values generated)
Compute DFFITS.
predict dfit, dfits
(17 missing values generated)
Use summarize to get largest values of cooks d, dffits, dfbeta like bottom of 277.
summarize d dfit DFmeaswt DFfemale DF1 , detail

                          Cook's D
-------------------------------------------------------------
      Percentiles      Smallest
 1%     2.11e-06       2.11e-06
 5%     .0000228       2.11e-06
10%      .000026       2.11e-06       Obs                 183
25%     .0001244       .0000157       Sum of Wgt.         183

50%     .0007961                      Mean           .4738773
                        Largest       Std. Dev.      6.351621
75%     .0032174       .0651359
90%     .0096058       .0701759       Variance       40.34309
95%     .0199879       .0856294       Skewness       13.41655
99%     .0856294       85.92735       Kurtosis       181.0043

                            Dfits
-------------------------------------------------------------
      Percentiles      Smallest
 1%    -.4308479      -38.41931
 5%    -.1958499      -.4308479
10%    -.1174221       -.296132       Obs                 183
25%    -.0592021      -.2823458       Sum of Wgt.         183

50%    -.0028959                      Mean          -.2012365
                        Largest       Std. Dev.      2.843795
75%     .0560052       .5108672
90%     .1362741       .5115646       Variance       8.087169
95%     .2121069        .540725       Skewness      -13.37203
99%      .540725       .6033236       Kurtosis        180.215

                          DFmeaswt
-------------------------------------------------------------
      Percentiles      Smallest
 1%    -.1318417      -.1449406
 5%     -.059406      -.1318417
10%    -.0427876      -.0978029       Obs                 183
25%    -.0000766      -.0921938       Sum of Wgt.         183

50%    -5.92e-16                      Mean           .0003997
                        Largest       Std. Dev.      .0540191
75%     1.22e-16       .1096412
90%     .0141305       .2565254       Variance       .0029181
95%     .0314289       .2809305       Skewness       5.222216
99%     .2809305       .4918421       Kurtosis       45.52623

                          DFfemale
-------------------------------------------------------------
      Percentiles      Smallest
 1%    -.2217265      -.2219922
 5%    -.1140623      -.2217265
10%     -.063526      -.2097966       Obs                 183
25%    -.0294111      -.1823008       Sum of Wgt.         183

50%    -.0050063                      Mean           .0941992
                        Largest       Std. Dev.      1.482754
75%     .0039615       .1956965
90%     .0166306       .2036534       Variance       2.198559
95%     .0342111       .3870315       Skewness       13.38578
99%     .3870315       20.02775       Kurtosis       180.4558

                             DF1
-------------------------------------------------------------
      Percentiles      Smallest
 1%    -.3742779       -24.7525
 5%    -.0256302      -.3742779
10%    -.0133058      -.2137802       Obs                 183
25%    -.0021874      -.1952085       Sum of Wgt.         183

50%     .0054611                      Mean          -.1163372
                        Largest       Std. Dev.      1.832269
75%     .0328629       .2331503
90%     .0701569       .2636165       Variance        3.35721
95%     .1102957       .2943538       Skewness      -13.39209
99%     .2943538       .3174025       Kurtosis       180.5693
We can see these values for subject 12.
list d dfit DFmeaswt DFfemale DF1 if subject==12

             d       dfit   DFmeaswt   DFfemale        DF1
 12.  85.92735  -38.41931   8.62e-13   20.02775   -24.7525
Top of page 279, computing COVRATIO. We can compute a variable covrat containing the COVRATIO.
predict covrat, covratio
(17 missing values generated)
Look at summary stats for covrat.
summarize covrat

Variable |     Obs        Mean   Std. Dev.       Min        Max
---------+-----------------------------------------------------
  covrat |     183    1.018453   .0833018   .0102869    1.19215
You can see that subject 12 has smallest covrat.
list subject covrat if covrat < .02

       subject     covrat
 12.        12   .0102869
Page 283 bottom, and figure 11.5 page 284, partial regression plots.
use https://stats.idre.ucla.edu/stat/stata/examples/ara/duncan, clear
Fit regression at bottom of page 283.
regress prestige income educ

  Source |       SS       df       MS                  Number of obs =      45
---------+------------------------------               F(  2,    42) =  101.22
   Model |  36180.9458     2  18090.4729               Prob > F      =  0.0000
Residual |  7506.69865    42   178.73092               R-squared     =  0.8282
---------+------------------------------               Adj R-squared =  0.8200
   Total |  43687.6444    44   992.90101               Root MSE      =  13.369

------------------------------------------------------------------------------
prestige |      Coef.   Std. Err.       t     P>|t|       [95% Conf. Interval]
---------+--------------------------------------------------------------------
  income |   .5987328   .1196673      5.003   0.000       .3572343    .8402313
    educ |   .5458339   .0982526      5.555   0.000       .3475521    .7441158
   _cons |  -6.064663   4.271941     -1.420   0.163      -14.68579    2.556463
------------------------------------------------------------------------------
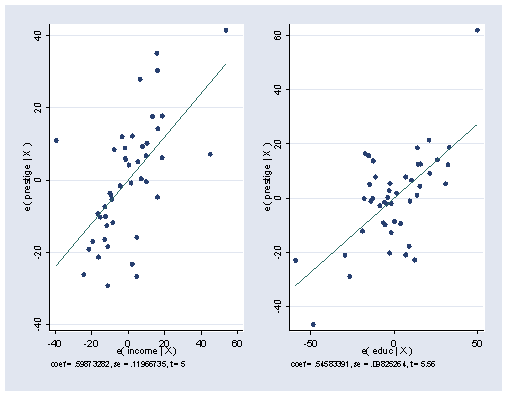
Figure 11.5 on page 284 can be obtained by using the avplots command.
avplots
Middle of page 284 influence statistics, and figure 11.6 on page 285.
Make and show hat, residual, Cook’s D.
predict hat1, hat
predict res, rstud
predict d, cooksd
summarize hat1 res d, detail

                          Leverage
-------------------------------------------------------------
      Percentiles      Smallest
 1%     .0241298       .0241298
 5%     .0262859       .0246816
10%     .0327049       .0262859       Obs                  45
25%     .0467892        .031326       Sum of Wgt.          45

50%       .05732                      Mean           .0666667
                        Largest       Std. Dev.      .0438265
75%     .0705812       .0878518
90%      .082588       .1730582       Variance       .0019208
95%     .1730582       .1945416       Skewness       3.050461
99%     .2690896       .2690896       Kurtosis       13.16723

                    Studentized residuals
-------------------------------------------------------------
      Percentiles      Smallest
 1%    -2.397022      -2.397022
 5%    -1.760491      -1.930919
10%    -1.433249      -1.760491       Obs                  45
25%    -.4980818      -1.704032       Sum of Wgt.          45

50%     .0505098                      Mean            .006828
                        Largest       Std. Dev.      1.055861
75%     .5083882       1.602429
90%     1.068858       1.887047       Variance       1.114843
95%     1.887047       2.043805       Skewness        .296872
99%     3.134519       3.134519       Kurtosis       3.928454

                          Cook's D
-------------------------------------------------------------
      Percentiles      Smallest
 1%     1.20e-08       1.20e-08
 5%     .0000537       .0000128
10%     .0001334       .0000537       Obs                  45
25%     .0016885       .0000784       Sum of Wgt.          45

50%     .0058424                      Mean           .0317011
                        Largest       Std. Dev.      .0898235
75%     .0236292       .0809681
90%     .0585235       .0989846       Variance       .0080683
95%     .0989846       .2236412       Skewness       5.064094
99%     .5663797       .5663797       Kurtosis       29.68371
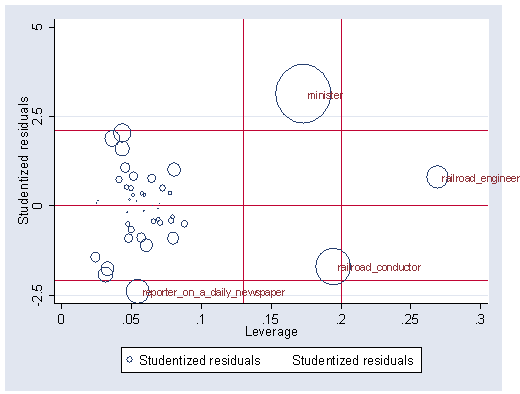
Figure 11.6on page 285. Scatterplot of rstud and hat weighted by cooksd. Observations with a hat value larger than 0.13 had their occupational title specified by the mlabel(occtitle) option.
graph twoway (scatter res hat1 [w=d],msymbol(Oh)) ///
		 (scatter res hat1 if res <= -2.1 | hat1 >= .13, mlabel(occtitle) msymbol(i)), ///
		 xlabel(0(.05).3) ylabel(-2.5(2.5)5) yline(-2.1 0 2.1) xline(.13 .20)

