Table 13.2, page 341.
clear
input id years dead
1 2 1
2 6 1
3 2 0
4 3 0
5 1 1
end
ltable years dead, noadj intervals(0,1,2,6)

                 Beg.                                 Std.
   Interval     Total   Deaths   Lost    Survival    Error     [95% Conf. Int.]
-------------------------------------------------------------------------------
    1     2         5        1      0     0.8000    0.1789     0.2038    0.9692
    2     6         4        1      2     0.6000    0.2191     0.1257    0.8818
    6     .         1        1      0     0.0000         .          .         .
-------------------------------------------------------------------------------
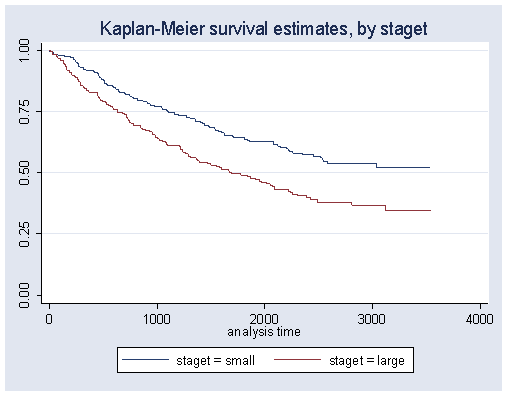
Figure 13.6, page 342.
use https://stats.idre.ucla.edu/stat/stata/examples/cama4/surv, clear

stset days, failure(death)
sts graph, by(staget)
Table 13.3, page 347.
tab death staget, col

status at end of |      tumor size
observation time |     small      large |     Total
-----------------+----------------------+----------
alive (censored) |       122         75 |       197
                 |     57.28      39.89 |     49.13
-----------------+----------------------+----------
            dead |        91        113 |       204
                 |     42.72      60.11 |     50.87
-----------------+----------------------+----------
           Total |       213        188 |       401
                 |    100.00     100.00 |    100.00


tab death perfbl, col

                 | perfomance status at
status at end of |       baseline
observation time |      good       poor |     Total
-----------------+----------------------+----------
alive (censored) |       174         22 |       196
                 |     51.63      35.48 |     49.12
-----------------+----------------------+----------
            dead |       163         40 |       203
                 |     48.37      64.52 |     50.88
-----------------+----------------------+----------
           Total |       337         62 |       399
                 |    100.00     100.00 |    100.00


tab death treat, col

status at end of |       treatment
observation time | saline (c  bcg (expe |     Total
-----------------+----------------------+----------
alive (censored) |        99         98 |       197
                 |     50.77      47.57 |     49.13
-----------------+----------------------+----------
            dead |        96        108 |       204
                 |     49.23      52.43 |     50.87
-----------------+----------------------+----------
           Total |       195        206 |       401
                 |    100.00     100.00 |    100.00


tab death poinf, col

                 |    post-operative
status at end of |       infection
observation time |        no        yes |     Total
-----------------+----------------------+----------
alive (censored) |       191          5 |       196
                 |     50.26      25.00 |     49.00
-----------------+----------------------+----------
            dead |       189         15 |       204
                 |     49.74      75.00 |     51.00
-----------------+----------------------+----------
           Total |       380         20 |       400
                 |    100.00     100.00 |    100.00
Table 13.4, page 348.
NOTE: The intercept given in the output is slightly different from that shown in the text. We suspect that the difference is caused by a change in the algorithms used by the different statistical packages.
stset days, failure(death)
streg staget perfbl poinf treat, dist(weibull) nohr time

         failure _d:  death
   analysis time _t:  days


Fitting constant-only model:

Iteration 0:   log likelihood = -528.69151
Iteration 1:   log likelihood =  -527.0816
Iteration 2:   log likelihood =  -527.0782
Iteration 3:   log likelihood =  -527.0782

Fitting full model:

Iteration 0:   log likelihood =  -527.0782
Iteration 1:   log likelihood = -515.54616
Iteration 2:   log likelihood = -512.77675
Iteration 3:   log likelihood = -512.74783
Iteration 4:   log likelihood = -512.74781

Weibull regression -- accelerated failure-time form

No. of subjects =          398                     Number of obs   =       398
No. of failures =          203
Time at risk    =       693517
                                                   LR chi2(4)      =     28.66
Log likelihood  =   -512.74781                     Prob > chi2     =    0.0000

------------------------------------------------------------------------------
          _t |      Coef.   Std. Err.      z    P>|z|     [95% Conf. Interval]
-------------+----------------------------------------------------------------
      staget |  -.5874447   .1573837    -3.73   0.000    -.8959111   -.2789782
      perfbl |  -.5986494   .2028811    -2.95   0.003    -.9962891   -.2010098
       poinf |  -.7124162   .3088923    -2.31   0.021    -1.317834   -.1069984
       treat |  -.0831065   .1545574    -0.54   0.591    -.3860334    .2198205
       _cons |   8.642305   .1583925    54.56   0.000     8.331862    8.952749
-------------+----------------------------------------------------------------
       /ln_p |  -.0855928   .0623351    -1.37   0.170    -.2077675    .0365818
-------------+----------------------------------------------------------------
           p |   .9179679   .0572217                      .8123959    1.037259
         1/p |   1.089363   .0679056                      .9640792    1.230927
------------------------------------------------------------------------------
Table 13.5, page 349.
cox days staget perfbl poinf treat, dead(death)

Iteration 0:   log likelihood = -1131.8837
Iteration 1:   log likelihood = -1119.5607
Iteration 2:   log likelihood = -1117.9168
Iteration 3:   log likelihood = -1117.8838
Iteration 4:   log likelihood = -1117.8838
Refining estimates:
Iteration 0:   log likelihood = -1117.8838

Cox regression -- Breslow method for ties
Entry time 0                                      Number of obs   =        398
                                                  LR chi2(4)      =      28.00
                                                  Prob > chi2     =     0.0000
Log likelihood = -1117.8838                       Pseudo R2       =     0.0124

------------------------------------------------------------------------------
        days |
       death |      Coef.   Std. Err.      z    P>|z|     [95% Conf. Interval]
-------------+----------------------------------------------------------------
      staget |   .5365369   .1421111     3.78   0.000     .2580043    .8150695
      perfbl |   .5308045   .1852409     2.87   0.004      .167739      .89387
       poinf |   .6668952   .2804013     2.38   0.017     .1173187    1.216472
       treat |   .0703558   .1418181     0.50   0.620    -.2076026    .3483142
------------------------------------------------------------------------------
We have skipped the examples on pages 350-354 because they use a simulated data set.
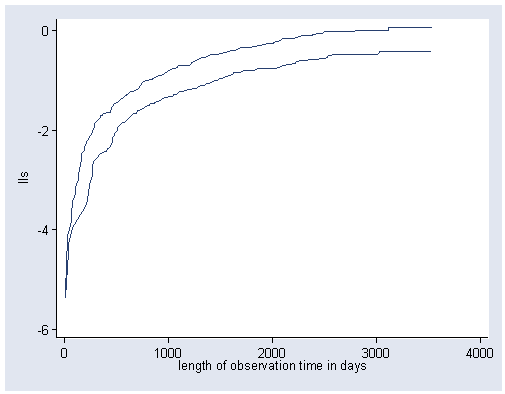
Figure 13.9, page 357.
sts gen s=s, by(staget)
gen lls = ln(-ln(s))
graph twoway scatter lls days, connect(L) msymbol(none) sort(staget days) ylabel( , angle(0) nogrid)


