Table 14.2, page 380.
NOTE: The values shown in the text are listed as eigenvectors in the Stata output.
use https://stats.idre.ucla.edu/stat/stata/examples/cama4/depress, clear

factor c1-c20, factors(5) pc

(obs=294)

            (principal components; 5 components retained)
Component    Eigenvalue     Difference    Proportion    Cumulative
------------------------------------------------------------------
     1        7.05542         5.56985      0.3528         0.3528
     2        1.48557         0.25406      0.0743         0.4270
     3        1.23151         0.16582      0.0616         0.4886
     4        1.06569         0.05305      0.0533         0.5419
     5        1.01263         0.04517      0.0506         0.5925
     6        0.96746         0.02064      0.0484         0.6409
     7        0.94682         0.17758      0.0473         0.6883
     8        0.76924         0.07460      0.0385         0.7267
     9        0.69464         0.03451      0.0347         0.7614
    10        0.66013         0.05249      0.0330         0.7945
    11        0.60764         0.05830      0.0304         0.8248
    12        0.54934         0.01270      0.0275         0.8523
    13        0.53663         0.02792      0.0268         0.8791
    14        0.50872         0.05781      0.0254         0.9046
    15        0.45090         0.07572      0.0225         0.9271
    16        0.37518         0.05400      0.0188         0.9459
    17        0.32118         0.02662      0.0161         0.9619
    18        0.29456         0.02619      0.0147         0.9767
    19        0.26837         0.07000      0.0134         0.9901
    20        0.19838               .      0.0099         1.0000

               Eigenvectors
    Variable |      1          2          3          4          5
-------------+------------------------------------------------------
          c1 |   0.27744   -0.14498   -0.05770    0.00272   -0.08827
          c2 |   0.31318    0.02714   -0.03163   -0.24781   -0.02440
          c3 |   0.26780   -0.15472   -0.03459   -0.24725    0.21831
          c4 |   0.24355   -0.31940   -0.17694    0.07155    0.17293
          c5 |   0.28678   -0.04972   -0.13839   -0.27935    0.04111
          c6 |   0.22057    0.05340   -0.22421   -0.18229    0.33987
          c7 |   0.28437   -0.16436    0.01896    0.07606    0.08700
          c8 |   0.10810   -0.30452   -0.11033    0.55670    0.09761
          c9 |   0.17578   -0.16900    0.39623    0.01463   -0.53548
         c10 |   0.27662   -0.04542    0.08346   -0.00842   -0.36505
         c11 |   0.24327   -0.10482    0.13140   -0.04138   -0.24193
         c12 |   0.17902    0.22998   -0.16343   -0.14506   -0.03684
         c13 |   0.12591    0.21263   -0.26453    0.54002   -0.09529
         c14 |   0.18025    0.40148    0.10141    0.24611    0.08471
         c15 |   0.20036    0.20978   -0.27032   -0.03121   -0.08341
         c16 |   0.19243    0.41745    0.18501    0.04674    0.03993
         c17 |   0.20968    0.39048    0.08602    0.06840    0.04991
         c18 |   0.17171    0.01533   -0.20193    0.06286   -0.27522
         c19 |   0.13149    0.05687    0.63261    0.02318    0.33492
         c20 |   0.23570   -0.22826    0.19325    0.24043    0.29094
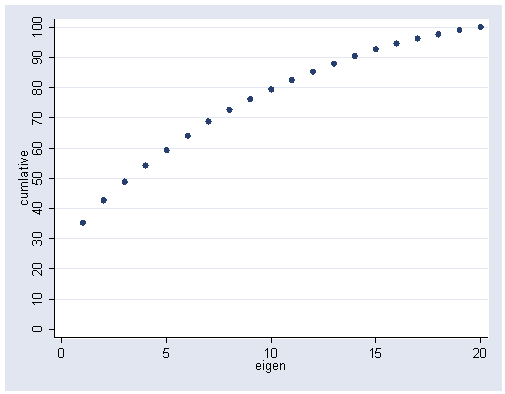
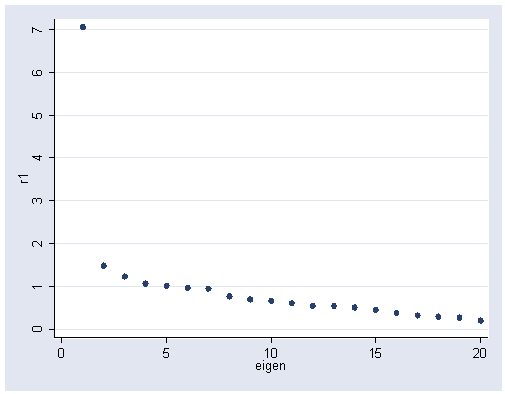
Figure 14.5, page 381.
Panel A:
matrix E1 = get(Ev)
matrix E2 = E1'
svmat E2, name(col)
gen eigen = _n if r1 != .
gen c = sum(r1) if r1 != .
gen cumlative = (c/20)*100
graph twoway scatter cumlative eigen, ylabel(0(10)100)
Panel B:
NOTE: The following graph can easily be reproduced using the greigen command, however, the greigen command only uses the first 13 eigenvalues.
graph twoway scatter r1 eigen, ylabel(0(1)7)


