Table 10.1, page 265.
use https://stats.idre.ucla.edu/stat/stata/examples/chp/p233, clear

drop if year >= 60
regress import doprod stock consum, beta

  Source |       SS       df       MS                  Number of obs =      11
---------+------------------------------               F(  3,     7) =  285.61
   Model |  204.776154     3  68.2587179               Prob > F      =  0.0000
Residual |  1.67295319     7  .238993312               R-squared     =  0.9919
---------+------------------------------               Adj R-squared =  0.9884
   Total |  206.449107    10  20.6449107               Root MSE      =  .48887

------------------------------------------------------------------------------
  import |      Coef.   Std. Err.       t     P>|t|                       Beta
---------+--------------------------------------------------------------------
  doprod |  -.0513959   .0702801     -0.731   0.488                  -.3393412
   stock |   .5869492   .0946185      6.203   0.000                   .2130485
  consum |   .2868483   .1022083      2.807   0.026                    1.30268
   _cons |  -10.12798   1.212161     -8.355   0.000                          .
------------------------------------------------------------------------------
Equations 10.6 and 10.7, page 265.
Note: The signs of the coefficients for the third eigenvector are different from those given in 10.7. This difference is merely a reflection of the signs and does not change the meaning of the analysis.
factor doprod stock consum, pc factors(3)

(obs=11)

            (principal components; 3 components retained)
Component    Eigenvalue     Difference    Proportion    Cumulative
------------------------------------------------------------------
     1        1.99915         1.00100      0.6664         0.6664
     2        0.99815         0.99546      0.3327         0.9991
     3        0.00269               .      0.0009         1.0000

            Eigenvectors
 Variable |      1          2          3
----------+--------------------------------
   doprod |   0.70633   -0.03569    0.70698
    stock |   0.04350    0.99903    0.00697
   consum |   0.70654   -0.02583   -0.70720

score c1 c2 c3

            (based on unrotated principal components)
            Scoring Coefficients
 Variable |      1          2          3
----------+--------------------------------
   doprod |   0.70633   -0.03569    0.70698
    stock |   0.04350    0.99903    0.00697
   consum |   0.70654   -0.02583   -0.70720

matrix ld = get(Ld)   /* save loading matrix for later analyses */
Table 10.2, page 265.
Note: The variable import has been transformed into a standard score zimport.
egen zimport = std(import)

regress z c1 c2 c3, noconst

  Source |       SS       df       MS                  Number of obs =      11
---------+------------------------------               F(  3,     8) =  326.41
   Model |  9.91896497     3  3.30632166               Prob > F      =  0.0000
Residual |  .081034631     8  .010129329               R-squared     =  0.9919
---------+------------------------------               Adj R-squared =  0.9889
   Total |   9.9999996    11  .909090872               Root MSE      =  .10064

------------------------------------------------------------------------------
 zimport |      Coef.   Std. Err.       t     P>|t|       [95% Conf. Interval]
---------+--------------------------------------------------------------------
      c1 |   .6899821   .0225096     30.653   0.000       .6380749    .7418892
      c2 |   .1913035    .031856      6.005   0.000       .1178434    .2647636
      c3 |  -1.159675   .6135396     -1.890   0.095        -2.5745    .2551501
------------------------------------------------------------------------------
Standardized coefficients for Table 10.3, page 268.
Note 1: We will use Stata’s matrix commands for these computations.
matrix b = get(_b)

matrix v = b'
matrix v[2,1] = 0
matrix v[3,1] = 0
matrix list v

v[3,1]
           y1
c1  .68998207
c2          0
c3          0

matrix pc1 = ld*v
matrix list pc1  /* standardized coefficients for first pc */

pc1[3,1]
           y1
r1  .48735532
r2  .03001462
r3    .487503

matrix v = b'
matrix v[3,1] = 0
matrix list v

v[3,1]
           y1
c1  .68998207
c2  .19130349
c3          0

matrix pc2 = ld*v
matrix list pc2  /* standardized coefficients for first and second pc */

pc2[3,1]
           y1
r1  .48052795
r2  .22113237
r3  .48256155

matrix v = b'
matrix list v

v[3,1]
            y1
c1   .68998207
c2   .19130349
c3  -1.1596748

matrix pc3 = ld*v
matrix list pc3  /* standardized coefficients for all pcs */

pc3[3,1]
            y1
r1  -.33934136
r2   .21304848
r3   1.3026802
use https://stats.idre.ucla.edu/stat/stata/examples/chp/p270, clear

list
             u         c1         c2         c3         c4
  1.      .955      1.467      1.903       -.53      .0389
  2.     -.746      2.136       .238       -.29       -.03
  3.    -2.323      -1.13       .184       -.01      -.094
  4.      -.82        .66      1.577       .179      -.033
  5.      .471      -.359       .484       -.74       .019
  6.     -.299      -.967        .17       .086      -.012
  7.       .21      -.931     -2.135      -.173       .008
  8.      .558      2.232      -.692        .46       .023
  9.    -1.119       .352     -1.432      -.032      -.045
 10.      .496     -1.663      1.828       .851        .02
 11.      .781      1.641     -1.295       .494       .031
 12.      .918     -1.693      -.392       -.02       .037
 13.      .918     -1.746      -.438      -.275       .037
Table 10.5, page 270.
regress u c1 c2 c3 c4

      Source |       SS       df       MS              Number of obs =      13
-------------+------------------------------           F(  4,     8) =63662.46
       Model |  11.9971847     4  2.99929618           Prob > F      =  0.0000
    Residual |    .0003769     8  .000047112           R-squared     =  1.0000
-------------+------------------------------           Adj R-squared =  1.0000
       Total |  11.9975616    12  .999796801           Root MSE      =  .00686

------------------------------------------------------------------------------
           u |      Coef.   Std. Err.      t    P>|t|     [95% Conf. Interval]
-------------+----------------------------------------------------------------
          c1 |  -.0017999    .001325    -1.36   0.211    -.0048552    .0012555
          c2 |  -.0025529   .0015783    -1.62   0.144    -.0061924    .0010866
          c3 |   .0016481   .0045872     0.36   0.729    -.0089299    .0122262
          c4 |    24.7659   .0490776   504.63   0.000     24.65273    24.87908
       _cons |   .0001904   .0019037     0.10   0.923    -.0041995    .0045803
------------------------------------------------------------------------------
Table 10.6, page 270.
regress u c1 c2 c3

      Source |       SS       df       MS              Number of obs =      13
-------------+------------------------------           F(  3,     9) =    0.00
       Model |  .000054633     3  .000018211           Prob > F      =  1.0000
    Residual |   11.997507     9  1.33305633           R-squared     =  0.0000
-------------+------------------------------           Adj R-squared = -0.3333
       Total |  11.9975616    12  .999796801           Root MSE      =  1.1546

------------------------------------------------------------------------------
           u |      Coef.   Std. Err.      t    P>|t|     [95% Conf. Interval]
-------------+----------------------------------------------------------------
          c1 |  -.0012226   .2228739    -0.00   0.996    -.5053984    .5029532
          c2 |  -.0001243   .2654817    -0.00   1.000    -.6006856    .6004371
          c3 |   .0025214   .7716171     0.00   0.997    -1.742998    1.748041
       _cons |  -8.83e-08    .320223    -0.00   1.000    -.7243949    .7243948
------------------------------------------------------------------------------
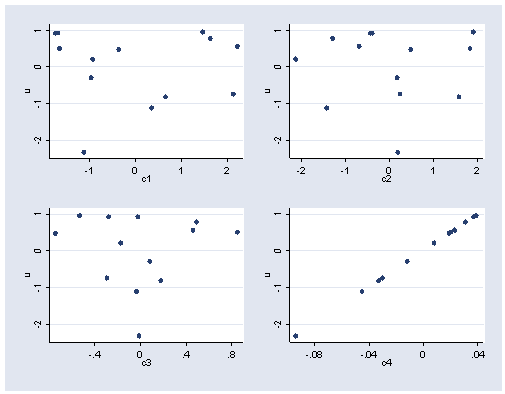
Figure 10.1, page 271.
graph twoway scatter u c1, nodraw ylabel(-2(1)1) xlabel(-1(1)2) saving(f101)
graph twoway scatter u c2, nodraw ylabel(-2(1)1) xlabel(-2(1)2) saving(f102)
graph twoway scatter u c3, nodraw ylabel(-2(1)1) xlabel(-.4(.4).8) saving(f103)
graph twoway scatter u c4, nodraw ylabel(-2(1)1) xlabel(-.08(.04).04) saving(f104)
graph combine f101.gph f102.gph f103.gph f104.gph

