Note: Variables in book are labeled incorrectly. The first variable is achv followed by fam, peer and school.
Tables 9.1 and 9.2, pages 228 and 229.
use https://stats.idre.ucla.edu/stat/stata/examples/chp/p228, clear
list

         achv        fam       peer     school
  1.   -.43148     .60814     .03509     .16607
  2.    .79969     .79369     .47924     .53356
  3.   -.92467     -.8263    -.61951    -.78635
  4.  -2.19081    -1.2531   -1.21675   -1.04076
  5.  -2.84818     .17399    -.18517     .14229
  6.   -.66233     .20246     .12764     .27311
  7.   2.63674     .24184    -.09022     .04967
  8.   2.35847     .59421      .2175     .51876
  9.   -.91305    -.61561    -.48971    -.63219
 10.    .59445     .99391     .62228     .93368
..
 [remainder of output omitted]
Table 9.3, page 229.
regress achv fam peer  school

      Source |       SS       df       MS              Number of obs =      70
-------------+------------------------------           F(  3,    66) =    5.72
       Model |  73.5062325     3  24.5020775           Prob > F      =  0.0015
    Residual |  282.873224    66  4.28595794           R-squared     =  0.2063
-------------+------------------------------           Adj R-squared =  0.1702
       Total |  356.379456    69  5.16491966           Root MSE      =  2.0703

------------------------------------------------------------------------------
        achv |      Coef.   Std. Err.      t    P>|t|     [95% Conf. Interval]
-------------+----------------------------------------------------------------
         fam |    1.10126   1.410562     0.78   0.438    -1.715017    3.917537
        peer |   2.322057   1.481287     1.57   0.122    -.6354284    5.279542
      school |  -2.280996   2.220448    -1.03   0.308    -6.714263    2.152272
       _cons |  -.0699591   .2506421    -0.28   0.781    -.5703821    .4304639
------------------------------------------------------------------------------
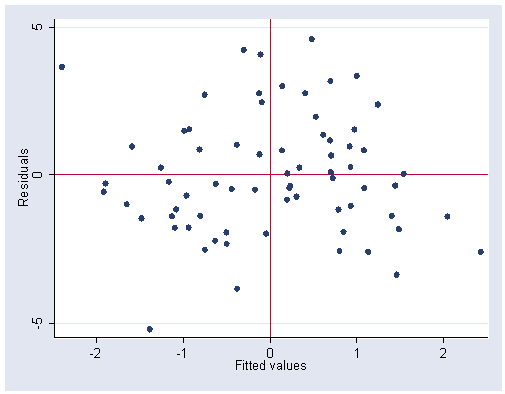
Figure 9.1, page 229.
Note: The rvfplot command uses the raw residuals and not standardized residuals.
rvfplot, yline(0) xline(0)
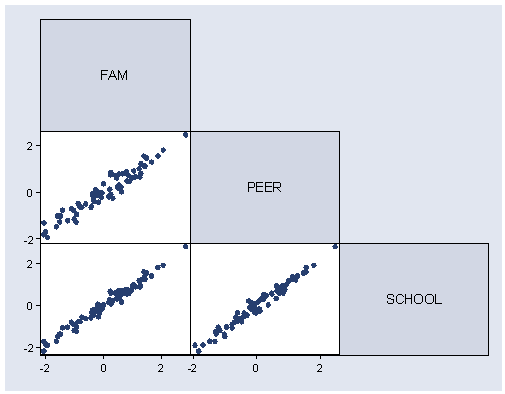
Figure 9,2, page 231.
corr fam peer school

(obs=70)

         |      fam     peer   school
---------+---------------------------
     fam |   1.0000
    peer |   0.9601   1.0000
  school |   0.9857   0.9822   1.0000

graph matrix fam peer school, half
Table 9.12, part 1, page 242.
Note: The collin command can be downloaded from UCLA ATS from within Stata (see How can I use the search command to search for programs and get additional help? for more information about using search).
collin fam peer school

  Collinearity Diagnostics

                        SQRT                           Cond
  Variable       VIF    VIF    Tolerance  Eigenval     Index
-------------------------------------------------------------
       fam     37.58    6.13    0.0266     2.9520     1.0000
      peer     30.21    5.50    0.0331     0.0400     8.5856
    school     83.16    9.12    0.0120     0.0080    19.2584
-------------------------------------------------------------
  Mean VIF     50.32              Condition Number   19.2584
Table 9.5, page 233.
use https://stats.idre.ucla.edu/stat/stata/examples/chp/p233, clear
generate index = _n
list

         year     import     doprod      stock     consum      index
  1.       49       15.9      149.3        4.2      108.1          1
  2.       50       16.4      161.2        4.1      114.8          2
  3.       51         19      171.5        3.1      123.2          3
  4.       52       19.1      175.5        3.1      126.9          4
  5.       53       18.8      180.8        1.1      132.1          5
  6.       54       20.4      190.7        2.2      137.7          6
  7.       55       22.7      202.1        2.1        146          7
  8.       56       26.5      212.4        5.6      154.1          8
  9.       57       28.1      226.1          5      162.3          9
 10.       58       27.6      231.9        5.1      164.3         10
 11.       59       26.3        239         .7      167.6         11
 12.       60       31.1        258        5.6      176.8         12
 13.       61       33.3      269.8        3.9      186.6         13
 14.       62         37      288.4        3.1      199.7         14
 15.       63       43.3      304.5        4.6      213.9         15
 16.       64         49      323.4          7      223.8         16
 17.       65       50.3      336.8        1.2        232         17
 18.       66       56.6      353.9        4.5      242.9         18
Table 9.6, page 234.
regress import doprod stock consum

  Source |       SS       df       MS                  Number of obs =      18
---------+------------------------------               F(  3,    14) =  168.45
   Model |  2576.92062     3   858.97354               Prob > F      =  0.0000
Residual |  71.3903825    14  5.09931304               R-squared     =  0.9730
---------+------------------------------               Adj R-squared =  0.9673
   Total |    2648.311    17     155.783               Root MSE      =  2.2582

------------------------------------------------------------------------------
  import |      Coef.   Std. Err.       t     P>|t|       [95% Conf. Interval]
---------+--------------------------------------------------------------------
  doprod |   .0322051   .1868844      0.172   0.866      -.3686221    .4330324
   stock |   .4141991   .3222598      1.285   0.220      -.2769794    1.105378
  consum |    .242746   .2853608      0.851   0.409      -.3692921    .8547841
   _cons |   -19.7251   4.125254     -4.782   0.000      -28.57289   -10.87731
------------------------------------------------------------------------------
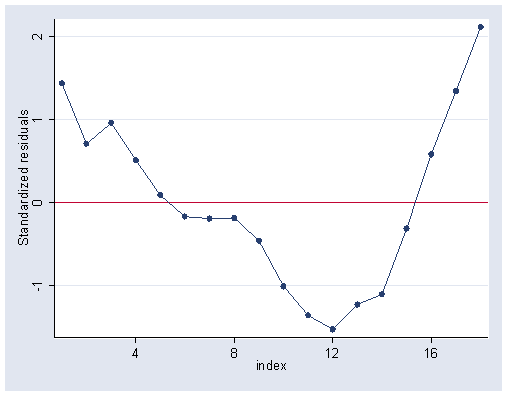
Figure 9.3, page 234.
predict r, rstandard
graph twoway scatter r index, connect(l) yline(0) ylabel(-1(1)2) xlabel(4(4)16)
Table 9.7, page 235.
drop if year>=60
regress import doprod stock consum

  Source |       SS       df       MS                  Number of obs =      11
---------+------------------------------               F(  3,     7) =  285.61
   Model |  204.776154     3  68.2587179               Prob > F      =  0.0000
Residual |  1.67295319     7  .238993312               R-squared     =  0.9919
---------+------------------------------               Adj R-squared =  0.9884
   Total |  206.449107    10  20.6449107               Root MSE      =  .48887

------------------------------------------------------------------------------
  import |      Coef.   Std. Err.       t     P>|t|       [95% Conf. Interval]
---------+--------------------------------------------------------------------
  doprod |  -.0513959   .0702801     -0.731   0.488       -.217582    .1147901
   stock |   .5869492   .0946185      6.203   0.000       .3632119    .8106865
  consum |   .2868483   .1022083      2.807   0.026       .0451642    .5285325
   _cons |  -10.12798   1.212161     -8.355   0.000      -12.99429    -7.26168
------------------------------------------------------------------------------
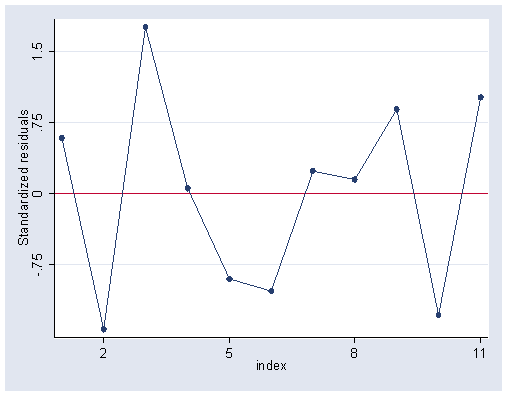
Figure 9.4, page 234.
predict r1, rstandard
graph twoway scatter r1 index, connect(l) yline(0) ylabel(-.75(.75)1.5) xlabel(2(3)11)
Table 9.8, page 237.
Note: Output has been edited to include just the constant and the coefficients.
regress import doprod

  doprod |   .1461991
   _cons |  -6.558102

regress import stock

   stock |    .690809
   _cons |   19.61124

regress import consum

  consum |   .2140041
   _cons |  -8.013247

regress import doprod stock

  doprod |   .1453144
   stock |   .6224793
   _cons |  -8.440141

regress import doprod consum

  doprod |  -.1087521
  consum |   .3716812
   _cons |  -8.884304

regress import stock consum

   stock |   .5960524
  consum |   .2123046
   _cons |  -9.742739

regress import doprod stock consum

  doprod |  -.0513959
   stock |   .5869492
  consum |   .2868483
   _cons |  -10.12798
Table 9.12, part 2, page 242.
Note: These results are for the entire sample from 1949-1966.
collin doprod stock consum

  Collinearity Diagnostics

                        SQRT                           Cond
  Variable       VIF    VIF    Tolerance  Eigenval     Index
-------------------------------------------------------------
    doprod    469.74   21.67    0.0021     2.0839     1.0000
     stock      1.05    1.02    0.9525     0.9150     1.5091
    consum    469.37   21.66    0.0021     0.0011    44.2258
-------------------------------------------------------------
  Mean VIF    313.39              Condition Number   44.2258
use https://stats.idre.ucla.edu/stat/stata/examples/chp/p238
Table 9.9, page 238.
generate index = _n
list index s_t a_t p_t e_t

         index        s_t        a_t        p_t        e_t
  1.         1   20.11371    1.98786          1         .3
  2.         2   15.10439    1.94418          0         .3
  3.         3   18.68375    2.19954         .8        .35
  4.         4   16.05173    2.00107          0        .35
  5.         5   21.30101    1.69292        1.3         .3
  6.         6   17.85004    1.74334         .3        .32
  7.         7   18.87558    2.06907          1        .31
  8.         8   21.26599    1.01709          1        .41
  9.         9   20.48473    2.01906         .9        .45
 10.        10   20.54032    1.06139          1        .45
..
 [remainder of output omitted]

list index a_t1 p_t1

         index       a_t1       p_t1
  1.         1    2.01722          0
  2.         2    1.98786          1
  3.         3    1.94418          0
  4.         4    2.19954         .8
  5.         5    2.00107          0
  6.         6    1.69292        1.3
  7.         7    1.74334         .3
  8.         8    2.06907          1
  9.         9    1.01709          1
 10.        10    2.01906         .9
..
 [remainder of output omitted]
Table 9.11, page 239.
corr a_t p_t e_t a_t1

(obs=22)

         |      a_t      p_t      e_t     a_t1     p_t1
---------+---------------------------------------------
     a_t |   1.0000
     p_t |  -0.3570   1.0000
     e_t |  -0.1285   0.0626   1.0000
    a_t1 |  -0.1397  -0.3165  -0.1664   1.0000
    p_t1 |  -0.4960  -0.2964   0.2081  -0.3578   1.0000
Table 9.10, page 239.
regress s_t a_t p_t e_t a_t1 p_t1

  Source |       SS       df       MS                  Number of obs =      22
---------+------------------------------               F(  5,    16) =   35.30
   Model |  307.571804     5  61.5143607               Prob > F      =  0.0000
Residual |  27.8786967    16  1.74241854               R-squared     =  0.9169
---------+------------------------------               Adj R-squared =  0.8909
   Total |    335.4505    21  15.9738333               Root MSE      =    1.32

------------------------------------------------------------------------------
     s_t |      Coef.   Std. Err.       t     P>|t|       [95% Conf. Interval]
---------+--------------------------------------------------------------------
     a_t |   5.360753   4.027685      1.331   0.202      -3.177559    13.89906
     p_t |   8.372322   3.586411      2.334   0.033       .7694711    15.97517
     e_t |   22.52103   2.142351     10.512   0.000       17.97945    27.06261
    a_t1 |    3.85457   3.577717      1.077   0.297      -3.729852    11.43899
    p_t1 |   4.124796   3.895108      1.059   0.305      -4.132463    12.38206
   _cons |  -14.19368    18.7151     -0.758   0.459      -53.86792    25.48057
------------------------------------------------------------------------------
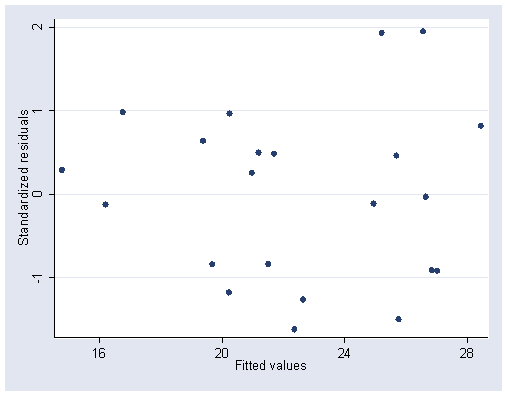
Figure 9.5, page 239.
predict p
predict r, rstandard
graph twoway scatter r p, ylabel(-1(1)2) xlabel(16(4)28)
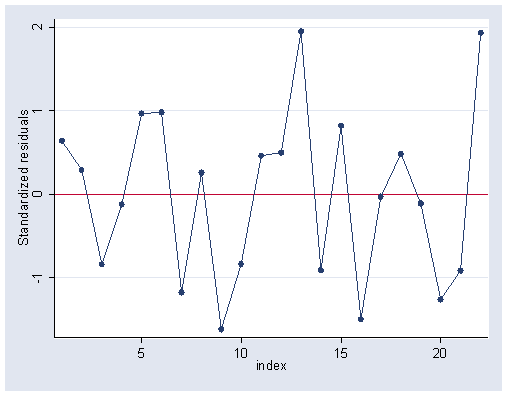
Figure 9.6, page 240.
graph r index, c(l) yline(0) ylabel xlabel
Table 9.12, part 3, page 242.
collin a_t p_t e_t a_t1 p_t1

  Collinearity Diagnostics

                        SQRT                           Cond
  Variable       VIF    VIF    Tolerance  Eigenval     Index
-------------------------------------------------------------
       a_t     36.94    6.08    0.0271     1.7010     1.0000
       p_t     33.47    5.79    0.0299     1.2882     1.1491
       e_t      1.08    1.04    0.9294     1.1447     1.2190
      a_t1     25.92    5.09    0.0386     0.8589     1.4072
      p_t1     43.52    6.60    0.0230     0.0073    15.2946
-------------------------------------------------------------
  Mean VIF     28.19              Condition Number   15.2946
Table 9.13, page 247.
use https://stats.idre.ucla.edu/stat/stata/examples/chp/p233, clear

drop if year >= 60
generate index = _n
factor doprod stock consum, pc factors(3)
score c1 c2 c3
list c1 c2 c3

            c1         c2         c3
  1. -2.125887    .638658   .0207224
  2. -1.618927   .5555392    .071113
  3. -1.115168  -.0729797   .0217302
  4. -.8942966    -.08237  -.0108132
  5. -.6442078  -1.306685  -.0725826
  6. -.1903517  -.6591474  -.0265525
  7.   .359622  -.7436745   -.042781
  8.  .9718018   1.354059  -.0628627
  9.  1.559316   .9640456  -.0235742
 10.  1.766995   1.015217   .0449881
 11.  1.931103  -1.662662   .0806126
Formula middle page 250.
Note: Constrained regression is similar to table 9.14, page 250.
constraint define 1  doprod =  consum
cnsreg import doprod stock consum, c(1)

Constrained linear regression                          Number of obs =      11
                                                       F(  2,     8) =  314.45
                                                       Prob > F      =  0.0000
                                                       Root MSE      =  .56934
 ( 1)  doprod - consum = 0.0
------------------------------------------------------------------------------
  import |      Coef.   Std. Err.       t     P>|t|       [95% Conf. Interval]
---------+--------------------------------------------------------------------
  doprod |   .0863804   .0035597     24.266   0.000       .0781717     .094589
   stock |   .6116376   .1092145      5.600   0.001       .3597885    .8634867
  consum |   .0863804   .0035597     24.266   0.000       .0781717     .094589
   _cons |  -9.006805   1.245017     -7.234   0.000      -11.87782   -6.135791
------------------------------------------------------------------------------
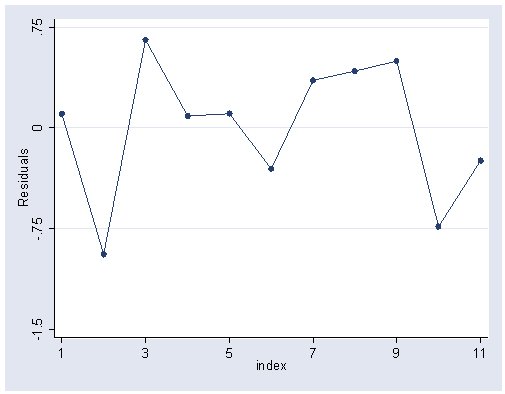
Figure 9.7, page 251.
Note: These residuals are raw residuals not standardized.
predict r, residual
graph twoway scatter r index, c(l) ylabel(-1.5(.75).75) xlabel(1(2)11)
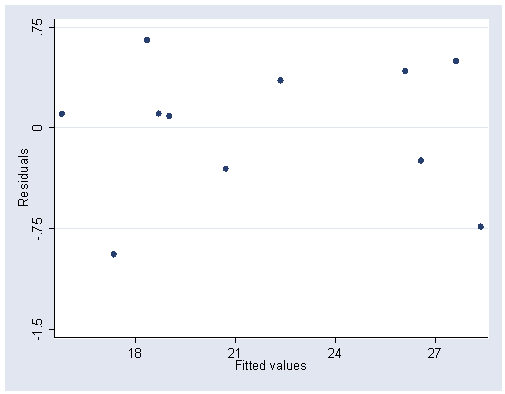
Figure 9.8, page 251.
predict p
graph twoway scatter r p, ylabel(-1.5(.75).75) xlabel(18(3)27)
Table 9.15, page 253.
gen new = 2/3*doprod
regress import doprod stock new

  Source |       SS       df       MS                  Number of obs =      11
---------+------------------------------               F(  2,     8) =  228.27
   Model |  202.893726     2  101.446863               Prob > F      =  0.0000
Residual |  3.55538138     8  .444422672               R-squared     =  0.9828
---------+------------------------------               Adj R-squared =  0.9785
   Total |  206.449107    10  20.6449107               Root MSE      =  .66665

------------------------------------------------------------------------------
  import |      Coef.   Std. Err.       t     P>|t|       [95% Conf. Interval]
---------+--------------------------------------------------------------------
  doprod |   .1453144   .0070296     20.672   0.000       .1291042    .1615247
   stock |   .6224793   .1278671      4.868   0.001       .3276172    .9173413
     new |  (dropped)
   _cons |  -8.440141   1.435179     -5.881   0.000      -11.74967   -5.130612
------------------------------------------------------------------------------
Equations 9.27 and 9.32, pages 253 and 254.
use https://stats.idre.ucla.edu/stat/stata/examples/chp/p238, clear

factor a_t p_t e_t a_t1 p_t1, pc factors(5)  /* Stata 8 */

pca a_t p_t e_t a_t1 p_t1  /* Stata 9 */

(obs=22)

            (principal components; 5 components retained)
Component    Eigenvalue     Difference    Proportion    Cumulative
------------------------------------------------------------------
     1        1.70095         0.41275      0.3402         0.3402
     2        1.28821         0.14356      0.2576         0.5978
     3        1.14465         0.28574      0.2289         0.8268
     4        0.85892         0.85164      0.1718         0.9985
     5        0.00727               .      0.0015         1.0000

            Eigenvectors
 Variable |      1          2          3          4          5
----------+------------------------------------------------------
      a_t |  -0.53245   -0.02379    0.66774    0.07442    0.51432
      p_t |   0.23245    0.82494   -0.15779   -0.03711    0.48904
      e_t |   0.38909   -0.02208    0.21721    0.89490   -0.00971
     a_t1 |  -0.39523   -0.25964   -0.69191    0.33802    0.42824
     p_t1 |   0.59571   -0.50100    0.05747   -0.27925    0.55932

score c1 c2 c3 c4 c5  /* Stata 8 */

predict c1 c2 c3 c4 c5, score  /* Stata 9 */

            (based on unrotated principal components)
            Scoring Coefficients
 Variable |      1          2          3          4          5
----------+------------------------------------------------------
      a_t |  -0.53245   -0.02379    0.66774    0.07442    0.51432
      p_t |   0.23245    0.82494   -0.15779   -0.03711    0.48904
      e_t |   0.38909   -0.02208    0.21721    0.89490   -0.00971
     a_t1 |  -0.39523   -0.25964   -0.69191    0.33802    0.42824
     p_t1 |   0.59571   -0.50100    0.05747   -0.27925    0.55932
Table 9.16, pages 256.
regress s_t a_t p_t e_t a_t1 p_t1, beta

  Source |       SS       df       MS                  Number of obs =      22
---------+------------------------------               F(  5,    16) =   35.30
   Model |  307.571804     5  61.5143607               Prob > F      =  0.0000
Residual |  27.8786967    16  1.74241854               R-squared     =  0.9169
---------+------------------------------               Adj R-squared =  0.8909
   Total |    335.4505    21  15.9738333               Root MSE      =    1.32

------------------------------------------------------------------------------
     s_t |      Coef.   Std. Err.       t     P>|t|                       Beta
---------+--------------------------------------------------------------------
     a_t |   5.360753   4.027685      1.331   0.202                   .5830283
     p_t |   8.372322   3.586411      2.334   0.033                   .9734163
     e_t |   22.52103   2.142351     10.512   0.000                   .7858832
    a_t1 |    3.85457   3.577717      1.077   0.297                   .3952874
    p_t1 |   4.124796   3.895108      1.059   0.305                    .503494
   _cons |  -14.19368    18.7151     -0.758   0.459                          .
------------------------------------------------------------------------------
Table 9.17, pages 257.
Note 1: The egen command was used to obtain the standard score for s_t.
Note 2: These results are slightly different from those in the book, although the r-squared, adjusted r-squared and standard error of estimate are identical to three decimal places.
egen zs_t = std(s_t)
regress zs_t c1 c2 c3 c4 c5, hascons
(note: hascons false)
      Source |       SS       df       MS              Number of obs =      22
-------------+------------------------------           F(  5,    16) =   35.30
       Model |  19.2547272     5  3.85094544           Prob > F      =  0.0000
    Residual |  1.74527279    16  .109079549           R-squared     =  0.9169
-------------+------------------------------           Adj R-squared =  0.8909
       Total |          21    21           1           Root MSE      =  .33027
------------------------------------------------------------------------------
        zs_t |      Coef.   Std. Err.      t    P>|t|     [95% Conf. Interval]
-------------+----------------------------------------------------------------
          c1 |   .3653279   .0552606     6.61   0.000     .2481806    .4824751
          c2 |   .4169108   .0634993     6.57   0.000     .2822982    .5515234
          c3 |   .1618494   .0673636     2.40   0.029     .0190449    .3046538
          c4 |   .7035709   .0777655     9.05   0.000     .5387155    .8684264
          c5 |   1.219158   .8451888     1.44   0.168    -.5725626    3.010878
       _cons |   1.99e-09   .0704142     0.00   1.000    -.1492715    .1492715
------------------------------------------------------------------------------

