Page 130, Table 5.1
use "a:table5.dta", clear
rename col1 town
rename col2 hours
list
     +---------------+
     |  town   hours |
     |---------------|
  1. |     A      35 |
  2. |     A      28 |
  3. |     A      26 |
  4. |     A      41 |
  5. |     A      43 |
     |---------------|
  6. |     A      29 |
  7. |     A      32 |
  8. |     A      37 |
  9. |     A      36 |
 10. |     A      25 |
     |---------------|
 11. |     A      29 |
 12. |     A      31 |
 13. |     A      39 |
 14. |     A      38 |
 15. |     A      40 |
     |---------------|
 16. |     A      45 |
 17. |     A      28 |
 18. |     A      27 |
 19. |     A      35 |
 20. |     A      34 |
     |---------------|
 21. |     B      27 |
 22. |     B       4 |
 23. |     B      49 |
 24. |     B      10 |
 25. |     B      15 |
     |---------------|
 26. |     B      41 |
 27. |     B      25 |
 28. |     B      30 |
 29. | RURAL       8 |
 30. | RURAL      15 |
     |---------------|
 31. | RURAL      21 |
 32. | RURAL       7 |
 33. | RURAL      14 |
 34. | RURAL      30 |
 35. | RURAL      20 |
     |---------------|
 36. | RURAL      11 |
 37. | RURAL      12 |
 38. | RURAL      32 |
 39. | RURAL      34 |
 40. | RURAL      24 |
     +---------------+
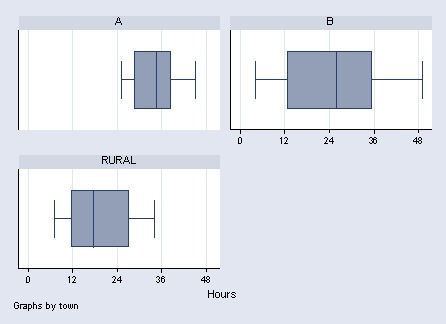
Page 131, Figure 5.1
graph hbox hours, by(town) ylabel(0(12)48) ytitle("Hours")
Page 131, the middle of the page
NOTE: Stata 9 does not seem to use string variables as strata variables. We will use the encode command to create a numeric variable that we will call t1 for use as the strata variable.
gen wt = 155/20
replace wt = 62/8 if town == "B"
replace wt = 93/12 if town == "RURAL"
encode town, gen(t1)

svyset [pweight=wt], strata(t1)

      pweight: wt
          VCE: linearized
     Strata 1: t1
         SU 1: <observations>
        FPC 1: <zero>

svy: mean hours
(running mean on estimation sample)

Survey: Mean estimation

Number of strata =       3          Number of obs    =      40
Number of PSUs   =      40          Population size  =     310
                                    Design df        =      37

--------------------------------------------------------------
             |             Linearized
             |       Mean   Std. Err.     [95% Conf. Interval]
-------------+------------------------------------------------
       hours |     27.675   1.503762      24.62809    30.72191
--------------------------------------------------------------

estat effects

----------------------------------------------------------
             |             Linearized
             |       Mean   Std. Err.       Deff      Deft
-------------+--------------------------------------------
       hours |     27.675   1.503762     .706547   .840563

sort t1
by t1:  tabstat hours, s(n mean p50 sd)

-------------------------------------------------------------------------------------------------------------
-> t1 = A

    variable |         N      mean       p50        sd
-------------+----------------------------------------
       hours |        20      33.9      34.5   5.94625
------------------------------------------------------

-------------------------------------------------------------------------------------------------------------
-> t1 = B

    variable |         N      mean       p50        sd
-------------+----------------------------------------
       hours |         8    25.125        26  15.24502
------------------------------------------------------

-------------------------------------------------------------------------------------------------------------
-> t1 = RURAL

    variable |         N      mean       p50        sd
-------------+----------------------------------------
       hours |        12        19      17.5   9.36143
------------------------------------------------------
Page 135, at the bottom
svy: total hours
(running total on estimation sample)

Survey: Total estimation

Number of strata =       3          Number of obs    =      40
Number of PSUs   =      40          Population size  =     310
                                    Design df        =      37

--------------------------------------------------------------
             |             Linearized
             |      Total   Std. Err.     [95% Conf. Interval]
-------------+------------------------------------------------
       hours |    8579.25   466.1662      7634.708    9523.792
--------------------------------------------------------------

