Table 4.1, page 75.
use https://stats.idre.ucla.edu/stat/stata/examples/icda/snoring, clear

tab snoring heart [fw=count], row

+----------------+
| Key            |
|----------------|
|   frequency    |
| row percentage |
+----------------+
           |         heart
   snoring |         0          1 |     Total
-----------+----------------------+----------
         0 |     1,355         24 |     1,379
           |     98.26       1.74 |    100.00
-----------+----------------------+----------
         2 |       603         35 |       638
           |     94.51       5.49 |    100.00
-----------+----------------------+----------
         4 |       192         21 |       213
           |     90.14       9.86 |    100.00
-----------+----------------------+----------
         5 |       224         30 |       254
           |     88.19      11.81 |    100.00
-----------+----------------------+----------
     Total |     2,374        110 |     2,484
           |     95.57       4.43 |    100.00

reg heart snoring [fw=count]

      Source |       SS       df       MS              Number of obs =    2484
-------------+------------------------------           F(  1,  2482) =   74.82
       Model |  3.07633377     1  3.07633377           Prob > F      =  0.0000
    Residual |  102.052491  2482  .041117039           R-squared     =  0.0293
-------------+------------------------------           Adj R-squared =  0.0289
       Total |  105.128824  2483  .042339438           Root MSE      =  .20277
------------------------------------------------------------------------------
       heart |      Coef.   Std. Err.      t    P>|t|     [95% Conf. Interval]
-------------+----------------------------------------------------------------
     snoring |    .020038   .0023166     8.65   0.000     .0154954    .0245806
       _cons |   .0168723   .0051571     3.27   0.001     .0067598    .0269849
------------------------------------------------------------------------------

predict ylin
(option xb assumed; fitted values)

logit heart snoring [fw=count]

Logit estimates                                   Number of obs   =       2484
                                                  LR chi2(1)      =      63.10
                                                  Prob > chi2     =     0.0000
Log likelihood = -418.86582                       Pseudo R2       =     0.0700
------------------------------------------------------------------------------
       heart |      Coef.   Std. Err.      z    P>|z|     [95% Conf. Interval]
-------------+----------------------------------------------------------------
     snoring |   .3973366   .0500106     7.95   0.000     .2993176    .4953557
       _cons |  -3.866248   .1662144   -23.26   0.000    -4.192022   -3.540474
------------------------------------------------------------------------------

predict ylogit
(option p assumed; Pr(heart))

probit heart snoring [fw=count]

Probit estimates                                  Number of obs   =       2484
                                                  LR chi2(1)      =      64.03
                                                  Prob > chi2     =     0.0000
Log likelihood = -418.39714                       Pseudo R2       =     0.0711
------------------------------------------------------------------------------
       heart |      Coef.   Std. Err.      z    P>|z|     [95% Conf. Interval]
-------------+----------------------------------------------------------------
     snoring |   .1877705     .02363     7.95   0.000     .1414565    .2340844
       _cons |  -2.060552   .0704491   -29.25   0.000    -2.198629   -1.922474
------------------------------------------------------------------------------

predict yprob
(option p assumed; Pr(heart))

list if heart==1

     +----------------------------------------------------------+
     | snoring   heart   count       ylin     ylogit      yprob |
     |----------------------------------------------------------|
  1. |       0       1      24   .0168723   .0205074   .0196729 |
  2. |       2       1      35   .0569483   .0442951   .0459933 |
  3. |       4       1      21   .0970243   .0930541   .0951876 |
  4. |       5       1      30   .1170623   .1324389   .1309952 |
     +----------------------------------------------------------+
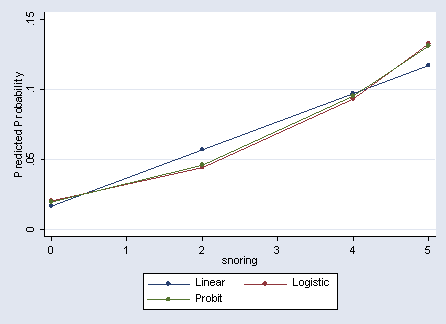
Figure 4.1 on page 76.
label variable ylin "Linear"
label variable ylogit "Logistic"
label variable yprob "Probit"
graph twoway connect ylin ylogit yprob snoring, ytitle(Predicted Probability)
Section 4.3.2, page 84. An example using horseshoe crabs data.
use https://stats.idre.ucla.edu/stat/stata/examples/icda/crab, clear

glm satell width , family(poisson) nolog

Generalized linear models                          No. of obs      =       173
Optimization     : ML: Newton-Raphson              Residual df     =       171
                                                   Scale parameter =         1
Deviance         =   567.878575                    (1/df) Deviance =  3.320927
Pearson          =  544.1570201                    (1/df) Pearson  =  3.182205
Variance function: V(u) = u                        [Poisson]
Link function    : g(u) = ln(u)                    [Log]
Standard errors  : OIM
Log likelihood   = -461.5881235                    AIC             =    5.3594
BIC              = -313.3342876
------------------------------------------------------------------------------
      satell |      Coef.   Std. Err.      z    P>|z|     [95% Conf. Interval]
-------------+----------------------------------------------------------------
       width |   .1640451   .0199653     8.22   0.000     .1249137    .2031764
       _cons |  -3.304757   .5422416    -6.09   0.000    -4.367531   -2.241983
------------------------------------------------------------------------------
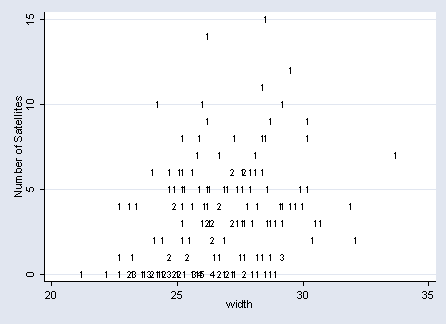
Figure 4.3 on page 84.
sort satell width
by satell width: gen count=_N
graph twoway scatter satell width, mlabel(count) mlabcolor(black) ytitle(Number of Satellites) msize(tiny)
glm satell width if width <=33 , family(poisson) nolog

Generalized linear models                          No. of obs      =       172
Optimization     : ML: Newton-Raphson              Residual df     =       170
                                                   Scale parameter =         1
Deviance         =  567.3393552                    (1/df) Deviance =   3.33729
Pearson          =  544.0694946                    (1/df) Pearson  =  3.200409
Variance function: V(u) = u                        [Poisson]
Link function    : g(u) = ln(u)                    [Log]
Standard errors  : OIM
Log likelihood   = -459.4147233                    AIC             =  5.365287
BIC              = -307.7347058
------------------------------------------------------------------------------
      satell |      Coef.   Std. Err.      z    P>|z|     [95% Conf. Interval]
-------------+----------------------------------------------------------------
       width |   .1699846   .0216086     7.87   0.000     .1276325    .2123368
       _cons |  -3.461006    .584658    -5.92   0.000    -4.606915   -2.315098
------------------------------------------------------------------------------

glm satell width  , family(poisson) link(identity) nolog

Generalized linear models                          No. of obs      =       173
Optimization     : ML: Newton-Raphson              Residual df     =       171
                                                   Scale parameter =         1
Deviance         =  557.7083301                    (1/df) Deviance =  3.261452
Pearson          =  542.4855164                    (1/df) Pearson  =   3.17243
Variance function: V(u) = u                        [Poisson]
Link function    : g(u) = u                        [Identity]
Standard errors  : OIM
Log likelihood   =  -456.503001                    AIC             =  5.300613
BIC              = -323.5045326
------------------------------------------------------------------------------
      satell |      Coef.   Std. Err.      z    P>|z|     [95% Conf. Interval]
-------------+----------------------------------------------------------------
       width |   .5494969   .0592926     9.27   0.000     .4332856    .6657082
       _cons |  -11.53206   1.510399    -7.64   0.000    -14.49239    -8.57173
------------------------------------------------------------------------------
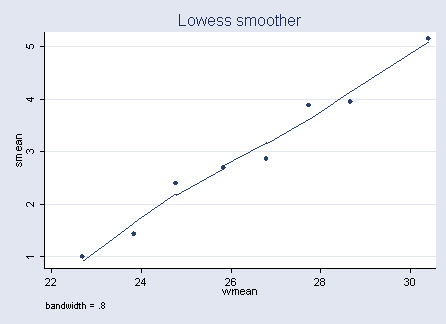
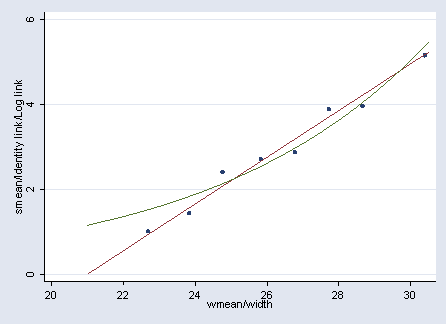
Figure 4.4 on page 85.
gen a = ceil(width - 23.25) + 1
replace a = 1 if  a<=0
replace a = 8 if a >8
sort a
by a: egen smean = mean(satell)
by a: egen wmean=mean(width)
lowess smean wmean
glm satell width, family(poisson)  nolog
predict ylog
label variable ylog "Log link"
glm satell width  , family(poisson) link(identity) nolog
predict ylin
label variable ylin "Identity link"
graph twoway scatter smean wmean || line ylin ylog width if ylog<=6, legend(off)
Section 4.3.4, page 87. Horseshoe crab data.
use https://stats.idre.ucla.edu/stat/stata/examples/icda/crab, clear

sort width
collapse (sum) satell (count) n, by(width)
glm satell width, fam(poi) lnoff(n) nolog

Generalized linear models                          No. of obs      =        66
Optimization     : ML: Newton-Raphson              Residual df     =        64
                                                   Scale parameter =         1
Deviance         =  190.0272196                    (1/df) Deviance =  2.969175
Pearson          =  174.2737318                    (1/df) Pearson  =  2.723027
Variance function: V(u) = u                        [Poisson]
Link function    : g(u) = ln(u)                    [Log]
Standard errors  : OIM
Log likelihood   = -199.2592131                    AIC             =  6.098764
BIC              = -78.11068387
------------------------------------------------------------------------------
      satell |      Coef.   Std. Err.      z    P>|z|     [95% Conf. Interval]
-------------+----------------------------------------------------------------
       width |   .1640451   .0199653     8.22   0.000     .1249137    .2031764
       _cons |  -3.304757   .5422416    -6.09   0.000    -4.367531   -2.241983
           n | (exposure)
------------------------------------------------------------------------------
Section 4.4.2 on Poisson model checking, a simpler approach on page 90.
use https://stats.idre.ucla.edu/stat/stata/examples/icda/crab, clear

gen a = ceil(width - 23.25) + 1
replace a = 1 if  a<=0
replace a = 8 if a >8
sort a
collapse (mean) width  (sum) satell n, by(a)
glm satell width, fam(poi) lnoff(n)

Generalized linear models                          No. of obs      =         8
Optimization     : ML: Newton-Raphson              Residual df     =         6
                                                   Scale parameter =         1
Deviance         =  6.516421366                    (1/df) Deviance =   1.08607
Pearson          =  6.246497819                    (1/df) Pearson  =  1.041083
Variance function: V(u) = u                        [Poisson]
Link function    : g(u) = ln(u)                    [Log]
Standard errors  : OIM
Log likelihood   = -26.48068535                    AIC             =  7.120171
BIC              = -5.960227884
------------------------------------------------------------------------------
      satell |      Coef.   Std. Err.      z    P>|z|     [95% Conf. Interval]
-------------+----------------------------------------------------------------
       width |   .1728976   .0212529     8.14   0.000     .1312427    .2145525
       _cons |  -3.540176   .5765828    -6.14   0.000    -4.670258   -2.410095
           n | (exposure)
------------------------------------------------------------------------------
Section 4.4.3, page 90. Model Residuals.
glm satell width, fam(poi) lnoff(n)

Generalized linear models                          No. of obs      =         8
Optimization     : ML: Newton-Raphson              Residual df     =         6
                                                   Scale parameter =         1
Deviance         =  6.516421366                    (1/df) Deviance =   1.08607
Pearson          =  6.246497819                    (1/df) Pearson  =  1.041083
Variance function: V(u) = u                        [Poisson]
Link function    : g(u) = ln(u)                    [Log]
Standard errors  : OIM
Log likelihood   = -26.48068535                    AIC             =  7.120171
BIC              = -5.960227884
------------------------------------------------------------------------------
      satell |      Coef.   Std. Err.      z    P>|z|     [95% Conf. Interval]
-------------+----------------------------------------------------------------
       width |   .1728976   .0212529     8.14   0.000     .1312427    .2145525
       _cons |  -3.540176   .5765828    -6.14   0.000    -4.670258   -2.410095
           n | (exposure)
------------------------------------------------------------------------------

predict count
(option mu assumed; predicted mean satell)

predict resid, p
predict h, h
gen aresid = resid/sqrt(1-h)
drop h
list

     +---------------------------------------------------------------+
     | a      width   satell    n      count       resid      aresid |
     |---------------------------------------------------------------|
  1. | 1   22.69286       14   14   20.54098   -1.443218   -1.630687 |
  2. | 2   23.84286       20   14   25.05952   -1.010702   -1.106694 |
  3. | 3     24.775       67   28   58.88382    1.057679    1.224653 |
  4. | 4   25.83846      105   39    98.5726    .6473766    .7527656 |
  5. | 5   26.79091       63   22   65.55898   -.3160459   -.3391854 |
     |---------------------------------------------------------------|
  6. | 6    27.7375       93   24    84.2362    .9548676    1.057612 |
  7. | 7   28.66667       71   18   74.18733   -.3700516   -.4229863 |
  8. | 8   30.40714       72   14   77.96057   -.6750725    -1.00809 |
     +---------------------------------------------------------------+
Section 4.4.4, page 92-93. Overdispersion in Poisson regression
use https://stats.idre.ucla.edu/stat/stata/examples/icda/crab, clear

gen a = ceil(width - 23.25) + 1
replace a = 1 if  a<=0
replace a = 8 if a >8
sort a
egen sd = sd(satell), by(a)
gen var=sd*sd
collapse (mean) width satell var (sum) tsat =satell (count) n, by(a)
list

     +-----------------------------------------------+
     | a      width    satell        var   tsat    n |
     |-----------------------------------------------|
  1. | 1   22.69286         1   2.769231     14   14 |
  2. | 2   23.84286   1.42857   8.879121     20   14 |
  3. | 3     24.775   2.39286   6.543651     67   28 |
  4. | 4   25.83846   2.69231   11.37652    105   39 |
  5. | 5   26.79091   2.86364   6.885281     63   22 |
     |-----------------------------------------------|
  6. | 6    27.7375     3.875   8.809782     93   24 |
  7. | 7   28.66667   3.94444   16.87909     71   18 |
  8. | 8   30.40714   5.14286   8.285714     72   14 |
     +-----------------------------------------------+

use https://stats.idre.ucla.edu/stat/stata/examples/icda/crab, clear

sort width
collapse (sum) satell (count) n, by(width)
glm satell width, fam(poi) lnoff(n)

Generalized linear models                          No. of obs      =        66
Optimization     : ML: Newton-Raphson              Residual df     =        64
                                                   Scale parameter =         1
Deviance         =  190.0272196                    (1/df) Deviance =  2.969175
Pearson          =  174.2737318                    (1/df) Pearson  =  2.723027
Variance function: V(u) = u                        [Poisson]
Link function    : g(u) = ln(u)                    [Log]
Standard errors  : OIM
Log likelihood   = -199.2592131                    AIC             =  6.098764
BIC              = -78.11068387
------------------------------------------------------------------------------
      satell |      Coef.   Std. Err.      z    P>|z|     [95% Conf. Interval]
-------------+----------------------------------------------------------------
       width |   .1640451   .0199653     8.22   0.000     .1249137    .2031764
       _cons |  -3.304757   .5422416    -6.09   0.000    -4.367531   -2.241983
           n | (exposure)
------------------------------------------------------------------------------

di sqrt(2.723027)
1.6501597

glm satell width, fam(poi) lnoff(n) scale(x2)

Generalized linear models                          No. of obs      =        66
Optimization     : ML: Newton-Raphson              Residual df     =        64
                                                   Scale parameter =         1
Deviance         =  190.0272196                    (1/df) Deviance =  2.969175
Pearson          =  174.2737318                    (1/df) Pearson  =  2.723027
Variance function: V(u) = u                        [Poisson]
Link function    : g(u) = ln(u)                    [Log]
Standard errors  : OIM
Log likelihood   = -199.2592131                    AIC             =  6.098764
BIC              = -78.11068387
------------------------------------------------------------------------------
      satell |      Coef.   Std. Err.      z    P>|z|     [95% Conf. Interval]
-------------+----------------------------------------------------------------
       width |   .1640451    .032946     4.98   0.000     .0994721    .2286181
       _cons |  -3.304757   .8947852    -3.69   0.000    -5.058504    -1.55101
           n | (exposure)
------------------------------------------------------------------------------
(Standard errors scaled using square root of Pearson X2-based dispersion)

di 4.98^2
24.8004


