Table 12.2-1, page 516.
use https://stats.idre.ucla.edu/stat/stata/examples/kirk/spf2-4, clear

tabdisp s b, cellvar(y) by(a) concise

----------+-----------------------
          |           b
  a and s |    1     2     3     4
----------+-----------------------
1         |
        1 |    3     4     7     7
        2 |    6     5     8     8
        3 |    3     4     7     9
        4 |    3     3     6     8
----------+-----------------------
2         |
        5 |    1     2     5    10
        6 |    2     3     6    10
        7 |    2     4     5     9
        8 |    2     3     6    11
----------+-----------------------

table a b, cont(sum y) row col

----------+----------------------------------
          |                 b
        a |     1      2      3      4  Total
----------+----------------------------------
        1 |    15     16     28     32     91
        2 |     7     12     22     40     81
          |
    Total |    22     28     50     72    172
----------+----------------------------------
Table 12.2-2, page 517.
Note: The repeated option is used to compute the Huynh-Feldt values.
anova y a / s|a b a*b /, repeated(b)

                     Number of obs =      32     R-squared     =  0.9613
                     Root MSE      =    .712     Adj R-squared =  0.9333

            Source |  Partial SS    df       MS           F     Prob > F
        -----------+----------------------------------------------------
             Model |     226.375    13  17.4134615      34.35     0.0000
                   |
                 a |       3.125     1       3.125       2.00     0.2070
               s|a |       9.375     6      1.5625
        -----------+----------------------------------------------------
                 b |      194.50     3  64.8333333     127.89     0.0000
               a*b |      19.375     3  6.45833333      12.74     0.0001
                   |
          Residual |       9.125    18  .506944444
        -----------+----------------------------------------------------
             Total |      235.50    31  7.59677419


Between-subjects error term:  s|a
                     Levels:  8         (6 df)
     Lowest b.s.e. variable:  s
     Covariance pooled over:  a         (for repeated variable)

Repeated variable: b
                                    Huynh-Feldt epsilon        =  0.9432
                                    Greenhouse-Geisser epsilon =  0.5841
                                    Box's conservative epsilon =  0.3333

                                      ------------ Prob > F ------------
            Source |     df      F    Regular    H-F      G-G      Box
        -----------+----------------------------------------------------
                 b |      3   127.89   0.0000   0.0000   0.0000   0.0000
               a*b |      3    12.74   0.0001   0.0002   0.0019   0.0118
          Residual |     18
        -----------+----------------------------------------------------
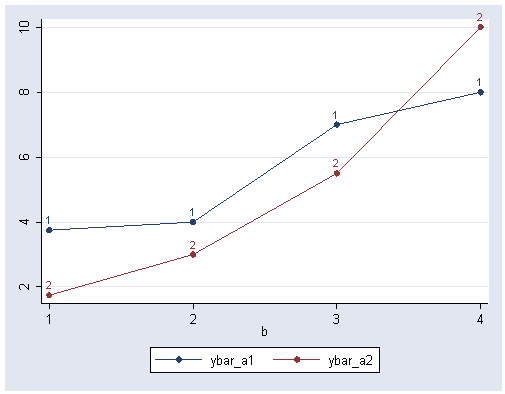
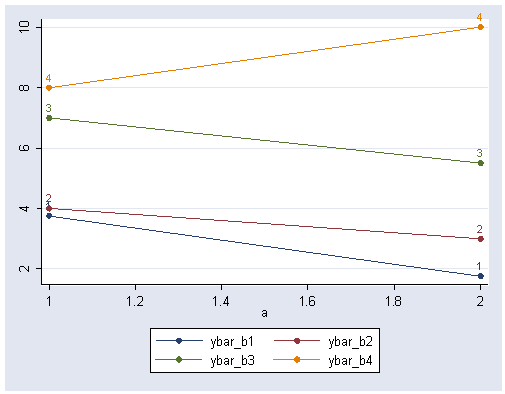
Figure 12.2-1, page 518.
egen ybar_a1 = mean(y) if a == 1, by(b)
egen ybar_a2 = mean(y) if a == 2, by(b)
graph twoway (scatter ybar_a1 b, connect(l) sort mlabel(a) mlabposition(12)) ///
	(scatter ybar_a2 b, connect(l) sort mlabel(a) mlabposition(12))
egen ybar_b1 = mean(y) if b == 1, by(a)
egen ybar_b2 = mean(y) if b == 2, by(a)
egen ybar_b3 = mean(y) if b == 3, by(a)
egen ybar_b4 = mean(y) if b == 4, by(a)
graph twoway (scatter ybar_b1 a, connect(L) sort mlabel(b)mlabposition(12)) ///
 	(scatter ybar_b2 a, connect(L) sort mlabel(b)  mlabposition(12)) ///
 	(scatter ybar_b3 a, connect(L) sort mlabel(b)  mlabposition(12)) ///
 	(scatter ybar_b4 a, connect(L) sort mlabel(b)  mlabposition(12))
Omega-squareds, page 519.
Note: The omega2 command can be downloaded by typing search contrast (see How can I use the search command to search for programs and get additional help? for more information about using search).
omega2 2 1

 omega squared = 0.0303
 effect size   = 0.1768

omega2 127.89 3

 omega squared = 0.9225
 effect size   = 3.4490

omega2 12.74 3

 omega squared = 0.5240
 effect size   = 1.0491
Table 12.4-1, page 528.
anova y a / s|a b a*b /, repeated(b) noanova  /* repeat anova with no output */

matrix list e(Srep)

symmetric e(Srep)[4,4]
            c1          c2          c3          c4
r1        1.25
r2   .66666667   .66666667
r3   .58333333   .33333333          .5
r4           0  -.16666667   .16666667   .66666667
Table 12.8-1, page 542.
Note: The entry for s1 a1 c1 b4 is incorrect in the book. It should have the value 7. The data file, spf22-4.dta, has the correct value.
use https://stats.idre.ucla.edu/stat/stata/examples/kirk/spf22-4, clear

tabdisp s b, cellvar(y) by(a c) concise  /* note corrected value */

----------+-----------------------
a, c and  |           b
s         |    1     2     3     4
----------+-----------------------
1         |
1         |
        1 |    3     4     7     7
        2 |    6     5     8     8
----------+-----------------------
1         |
2         |
        3 |    3     4     7     9
        4 |    3     3     6     8
----------+-----------------------
2         |
1         |
        5 |    1     2     5    10
        6 |    2     3     6    10
----------+-----------------------
2         |
2         |
        7 |    2     4     5     9
        8 |    2     3     6    11
----------+-----------------------

table a b c, cont(sum y)

----------+-------------------------------------------------
          |                     c and b
          | ---------- 1 ---------    ---------- 2 ---------
        a |    1     2     3     4       1     2     3     4
----------+-------------------------------------------------
        1 |    9     9    15    15       6     7    13    17
        2 |    3     5    11    20       4     7    11    20
----------+-------------------------------------------------

table c b, cont(sum y)

----------+-----------------------
          |           b
        c |    1     2     3     4
----------+-----------------------
        1 |   12    14    26    35
        2 |   10    14    24    37
----------+-----------------------

table a b, cont(sum y) row col

----------+----------------------------------
          |                 b
        a |     1      2      3      4  Total
----------+----------------------------------
        1 |    15     16     28     32     92
        2 |     7     12     22     40     81
          |
    Total |    22     28     50     73    173
----------+----------------------------------

table a c, cont(sum y) row

----------+-----------
          |     c
        a |    1     2
----------+-----------
        1 |   48    43
        2 |   39    42
          |
    Total |   88    85
----------+-----------
Table 12.8-2, page 545.
anova y a c a*c / s|a*c b a*b b*c a*b*c /, repeated(b)

                     Number of obs =      32     R-squared     =  0.9798
                     Root MSE      = .629153     Adj R-squared =  0.9479

            Source |  Partial SS    df       MS           F     Prob > F
        -----------+----------------------------------------------------
             Model |      230.75    19  12.1447368      30.68     0.0000
                   |
                 a |       3.125     1       3.125       1.72     0.2594
                 c |        .125     1        .125       0.07     0.8058
               a*c |        2.00     1        2.00       1.10     0.3528
             s|a*c |        7.25     4      1.8125
        -----------+----------------------------------------------------
                 b |      194.50     3  64.8333333     163.79     0.0000
               a*b |      19.375     3  6.45833333      16.32     0.0002
               b*c |       1.375     3  .458333333       1.16     0.3660
             a*b*c |        3.00     3        1.00       2.53     0.1068
                   |
          Residual |        4.75    12  .395833333
        -----------+----------------------------------------------------
             Total |      235.50    31  7.59677419


Between-subjects error term:  s|a*c
                     Levels:  8         (4 df)
     Lowest b.s.e. variable:  s
     Covariance pooled over:  a*c       (for repeated variable)

Repeated variable: b
                                    Huynh-Feldt epsilon        =  2.1181
                                    *Huynh-Feldt epsilon reset to 1.0000
                                    Greenhouse-Geisser epsilon =  0.6367
                                    Box's conservative epsilon =  0.3333

                                      ------------ Prob > F ------------
            Source |     df      F    Regular    H-F      G-G      Box
        -----------+----------------------------------------------------
                 b |      3   163.79   0.0000   0.0000   0.0000   0.0002
               a*b |      3    16.32   0.0002   0.0002   0.0018   0.0156
               b*c |      3     1.16   0.3660   0.3660   0.3609   0.3425
             a*b*c |      3     2.53   0.1068   0.1068   0.1448   0.1872
          Residual |     12
        -----------+----------------------------------------------------

matrix list e(Srep)

symmetric e(Srep)[4,4]
      c1    c2    c3    c4
r1  1.25
r2    .5    .5
r3    .5   .25    .5
r4  .375     0    .5   .75
Figure 12.10-1, page 555.
use https://stats.idre.ucla.edu/stat/stata/examples/kirk/spf2-22, clear

tabdisp s b c, cellvar(y) by(a) concise

----------+-------------------------
          |         c and b
          | ---- 1 ---    ---- 2 ---
  a and s |    1     2       1     2
----------+-------------------------
1         |
        1 |    3     7       4     7
        2 |    6     8       5     8
        3 |    3     7       4     9
        4 |    3     6       3     8
----------+-------------------------
2         |
        5 |    1     5       2    10
        6 |    2     6       3    10
        7 |    2     5       4     9
        8 |    2     6       3    11
----------+-------------------------

table a c b, cont(sum y)

----------+-------------------------
          |         b and c
          | ---- 1 ---    ---- 2 ---
        a |    1     2       1     2
----------+-------------------------
        1 |   15    16      28    32
        2 |    7    12      22    40
----------+-------------------------

table a c b, cont(sum y)

----------+-------------------------
          |         b and c
          | ---- 1 ---    ---- 2 ---
        a |    1     2       1     2
----------+-------------------------
        1 |   15    16      28    32
        2 |    7    12      22    40
----------+-------------------------
Table 12.10-2, page 559.
anova y a / s|a b a*b / b*s|a c a*c / c*s|a b*c a*b*c /, repeated(b c)

                     Number of obs =      32     R-squared     =  0.9920
                     Root MSE      = .559017     Adj R-squared =  0.9589

            Source |  Partial SS    df       MS           F     Prob > F
        -----------+----------------------------------------------------
             Model |     233.625    25       9.345      29.90     0.0002
                   |
                 a |       3.125     1       3.125       2.00     0.2070
               s|a |       9.375     6      1.5625
        -----------+----------------------------------------------------
                 b |      162.00     1      162.00     199.38     0.0000
               a*b |       6.125     1       6.125       7.54     0.0335
             b*s|a |       4.875     6       .8125
        -----------+----------------------------------------------------
                 c |       24.50     1       24.50      61.89     0.0002
               a*c |      10.125     1      10.125      25.58     0.0023
             c*s|a |       2.375     6  .395833333
        -----------+----------------------------------------------------
               b*c |        8.00     1        8.00      25.60     0.0023
             a*b*c |       3.125     1       3.125      10.00     0.0195
                   |
          Residual |       1.875     6       .3125
        -----------+----------------------------------------------------
             Total |      235.50    31  7.59677419


Between-subjects error term:  s|a
                     Levels:  8         (6 df)
     Lowest b.s.e. variable:  s
     Covariance pooled over:  a         (for repeated variables)

Repeated variable: b
                                    Huynh-Feldt epsilon        =  1.2000
                                    *Huynh-Feldt epsilon reset to 1.0000
                                    Greenhouse-Geisser epsilon =  1.0000
                                    Box's conservative epsilon =  1.0000

                                      ------------ Prob > F ------------
            Source |     df      F    Regular    H-F      G-G      Box
        -----------+----------------------------------------------------
                 b |      1   199.38   0.0000   0.0000   0.0000   0.0000
               a*b |      1     7.54   0.0335   0.0335   0.0335   0.0335
             b*s|a |      6
        -----------+----------------------------------------------------

Repeated variable: c
                                    Huynh-Feldt epsilon        =  1.2000
                                    *Huynh-Feldt epsilon reset to 1.0000
                                    Greenhouse-Geisser epsilon =  1.0000
                                    Box's conservative epsilon =  1.0000

                                      ------------ Prob > F ------------
            Source |     df      F    Regular    H-F      G-G      Box
        -----------+----------------------------------------------------
                 c |      1    61.89   0.0002   0.0002   0.0002   0.0002
               a*c |      1    25.58   0.0023   0.0023   0.0023   0.0023
             c*s|a |      6
        -----------+----------------------------------------------------

Repeated variables: b*c
                                    Huynh-Feldt epsilon        =  1.2000
                                    *Huynh-Feldt epsilon reset to 1.0000
                                    Greenhouse-Geisser epsilon =  1.0000
                                    Box's conservative epsilon =  1.0000

                                      ------------ Prob > F ------------
            Source |     df      F    Regular    H-F      G-G      Box
        -----------+----------------------------------------------------
               b*c |      1    25.60   0.0023   0.0023   0.0023   0.0023
             a*b*c |      1    10.00   0.0195   0.0195   0.0195   0.0195
          Residual |      6
        -----------+----------------------------------------------------

matrix list e(Srep)

symmetric e(Srep)[4,4]
            c1          c2          c3          c4
r1        1.25
r2   .66666667   .66666667
r3   .58333333   .33333333          .5
r4           0  -.16666667   .16666667   .66666667
Table 12.14-1, page 574.
use https://stats.idre.ucla.edu/stat/stata/examples/kirk/spf2-3a, clear

tabdisp s b, cellvar(y) by(a) concise

----------+-----------------
          |        b
  a and s |    1     2     3
----------+-----------------
1         |
        1 |    3     4     7
        2 |    6     5     8
----------+-----------------
2         |
        3 |    3     4     7
        4 |    3     3     6
        5 |    1     2     5
----------+-----------------
Table 12.14-2, page 576.
anova y a / s|a b a*b /, repeated(b)

                     Number of obs =      15     R-squared     =  0.9692
                     Root MSE      = .544331     Adj R-squared =  0.9281

            Source |  Partial SS    df       MS           F     Prob > F
        -----------+----------------------------------------------------
             Model |  55.9555556     8  6.99444444      23.61     0.0005
                   |
                 a |  10.6777778     1  10.6777778       3.08     0.1774
               s|a |  10.3888889     3  3.46296296
        -----------+----------------------------------------------------
                 b |  32.3555556     2  16.1777778      54.60     0.0001
               a*b |  .355555556     2  .177777778       0.60     0.5787
                   |
          Residual |  1.77777778     6  .296296296
        -----------+----------------------------------------------------
             Total |  57.7333333    14  4.12380952


Between-subjects error term:  s|a
                     Levels:  5         (3 df)
     Lowest b.s.e. variable:  s
     Covariance pooled over:  a         (for repeated variable)

Repeated variable: b
                                    Huynh-Feldt epsilon        =  0.7500
                                    Greenhouse-Geisser epsilon =  0.5000
                                    Box's conservative epsilon =  0.5000

                                      ------------ Prob > F ------------
            Source |     df      F    Regular    H-F      G-G      Box
        -----------+----------------------------------------------------
                 b |      2    54.60   0.0001   0.0008   0.0051   0.0051
               a*b |      2     0.60   0.5787   0.5431   0.4950   0.4950
          Residual |      6
        -----------+----------------------------------------------------

matrix list e(Srep)

symmetric e(Srep)[3,3]
           c1         c2         c3
r1  2.3888889
r2  1.1666667  .83333333
r3  1.1666667  .83333333  .83333333


