Use data file crac3, page 714.
use https://stats.idre.ucla.edu/stat/stata/examples/kirk/crac3, clear

sort a
by a: gen n = _n

list, clean
       a     y     x   n
  1.   1     1     1   1
  2.   1   1.5     2   2
  3.   1     2     4   3
  4.   1   1.8     3   4
  5.   2   2.6   4.5   1
  6.   2     2     2   2
  7.   2   2.3     3   3
  8.   2   2.5     4   4
  9.   3   4.8     3   1
 10.   3     4     2   2
 11.   3   5.3     4   3
 12.   3     6     5   4
Parts of Table 15.2-1, page 714.
tabdisp n a, cellvar(y)

----------+-----------------
          |        a
        n |    1     2     3
----------+-----------------
        1 |    1   2.6   4.8
        2 |  1.5     2     4
        3 |    2   2.3   5.3
        4 |  1.8   2.5     6
----------+-----------------

tabdisp n a, cellvar(x)

----------+-----------------
          |        a
        n |    1     2     3
----------+-----------------
        1 |    1   4.5     3
        2 |    2     2     2
        3 |    4     3     4
        4 |    3     4     5
----------+-----------------

table a, cont(mean y mean x)

----------+-----------------------
        a |    mean(y)     mean(x)
----------+-----------------------
        1 |      1.575         2.5
        2 |       2.35       3.375
        3 |      5.025         3.5
----------+-----------------------
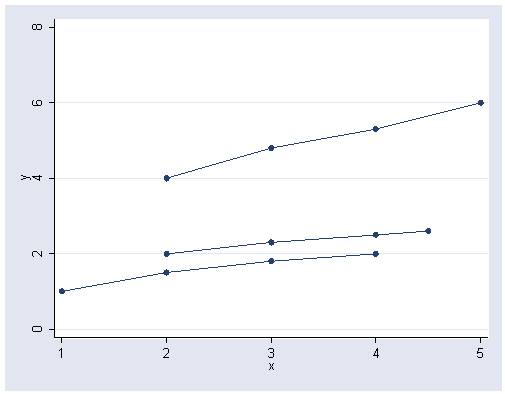
Figure 15.2-1, page 714.
Note: The sort command before the graph command is used to collect scores for each group together.
sort a x

graph twoway scatter y x, connect(L) ylabel(0(2)8)
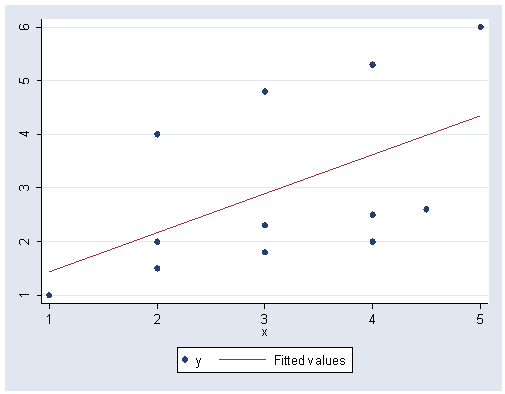
Figure 15.2-2, page 715.
graph twoway (scatter y x) (lfit y x)
Regression coefficients for each of the three groups, page 715.
regress y x if a==1

  Source |       SS       df       MS                  Number of obs =       4
---------+------------------------------               F(  1,     2) =   47.35
   Model |  .544499984     1  .544499984               Prob > F      =  0.0205
Residual |  .022999994     2  .011499997               R-squared     =  0.9595
---------+------------------------------               Adj R-squared =  0.9392
   Total |  .567499979     3   .18916666               Root MSE      =  .10724

------------------------------------------------------------------------------
       y |      Coef.   Std. Err.       t     P>|t|       [95% Conf. Interval]
---------+--------------------------------------------------------------------
       x |        .33   .0479583      6.881   0.020        .123652    .5363479
   _cons |        .75   .1313392      5.710   0.029       .1848929    1.315107
------------------------------------------------------------------------------

regress y x if a==2

  Source |       SS       df       MS                  Number of obs =       4
---------+------------------------------               F(  1,     2) =  175.00
   Model |  .207627076     1  .207627076               Prob > F      =  0.0057
Residual |  .002372881     2   .00118644               R-squared     =  0.9887
---------+------------------------------               Adj R-squared =  0.9831
   Total |  .209999957     3  .069999986               Root MSE      =  .03444

------------------------------------------------------------------------------
       y |      Coef.   Std. Err.       t     P>|t|       [95% Conf. Interval]
---------+--------------------------------------------------------------------
       x |   .2372881   .0179373     13.229   0.006       .1601102    .3144661
   _cons |   1.549153   .0629405     24.613   0.002       1.278342    1.819964
------------------------------------------------------------------------------

regress y x if a==3

  Source |       SS       df       MS                  Number of obs =       4
---------+------------------------------               F(  1,     2) =  281.67
   Model |      2.1125     1      2.1125               Prob > F      =  0.0035
Residual |  .015000019     2   .00750001               R-squared     =  0.9929
---------+------------------------------               Adj R-squared =  0.9894
   Total |  2.12750002     3  .709166673               Root MSE      =   .0866

------------------------------------------------------------------------------
       y |      Coef.   Std. Err.       t     P>|t|       [95% Conf. Interval]
---------+--------------------------------------------------------------------
       x |        .65   .0387299     16.783   0.004       .4833589    .8166411
   _cons |       2.75   .1423026     19.325   0.003       2.137721    3.362279
------------------------------------------------------------------------------
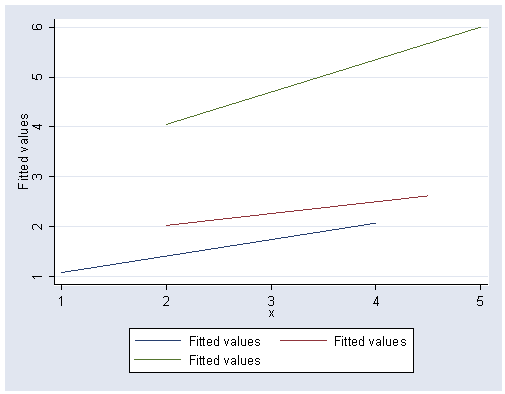
Regression lines for each group Figure 15.2-3, page 716.
graph twoway (lfit y x if a==1) (lfit y x if a==2) (lfit y x if a==3)
Within groups regression coefficient, page 715.
Note: This example uses anova to do regression treating a as categorical and x as continuous.
anova y a c.x

                           Number of obs =      12     R-squared     =  0.9839
                           Root MSE      = .241977     Adj R-squared =  0.9779

                  Source |  Partial SS    df       MS           F     Prob > F
              -----------+----------------------------------------------------
                   Model |  28.6482438     3   9.5494146     163.09     0.0000
                         |
                       a |    20.08945     2   10.044725     171.55     0.0000
                       x |  2.43657525     1  2.43657525      41.61     0.0002
                         |
                Residual |  .468424708     8  .058553088
              -----------+----------------------------------------------------
                   Total |  29.1166685    11  2.64696986
regress
      Source |       SS       df       MS              Number of obs =      12
-------------+------------------------------           F(  3,     8) =  163.09
       Model |  28.6482438     3   9.5494146           Prob > F      =  0.0000
    Residual |  .468424708     8  .058553088           R-squared     =  0.9839
-------------+------------------------------           Adj R-squared =  0.9779
       Total |  29.1166685    11  2.64696986           Root MSE      =  .24198

------------------------------------------------------------------------------
           y |      Coef.   Std. Err.      t    P>|t|     [95% Conf. Interval]
-------------+----------------------------------------------------------------
           a |
          2  |   .4058219   .1804211     2.25   0.055    -.0102299    .8218737
          3  |   3.028082   .1831786    16.53   0.000     2.605672    3.450493
             |
           x |   .4219178   .0654053     6.45   0.000     .2710929    .5727427
       _cons |   .5202055   .2034081     2.56   0.034     .0511456    .9892653
------------------------------------------------------------------------------
Between groups regression coefficient, page 717.
egen xbar = mean(x)
egen xbarj = mean(x), by(a)
gen diffx= xbarj-xbar

egen ybar = mean(y)
egen ybarj = mean(y), by(a)
gen diffy= ybarj-ybar

regress diffy diffx

      Source |       SS       df       MS              Number of obs =      12
-------------+------------------------------           F(  1,    10) =   13.19
       Model |  14.9063154     1  14.9063154           Prob > F      =  0.0046
    Residual |  11.3053527    10  1.13053527           R-squared     =  0.5687
-------------+------------------------------           Adj R-squared =  0.5256
       Total |  26.2116682    11  2.38287892           Root MSE      =  1.0633

------------------------------------------------------------------------------
       diffy |      Coef.   Std. Err.      t    P>|t|     [95% Conf. Interval]
-------------+----------------------------------------------------------------
       diffx |   2.505263   .6899383     3.63   0.005     .9679848    4.042541
       _cons |          0   .3069385     0.00   1.000    -.6839017    .6839017
------------------------------------------------------------------------------
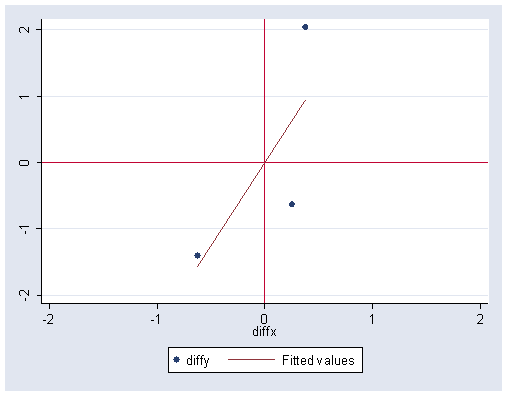
Figure 15.2-4, page 716.
graph twoway (scatter diffy diffx) (lfit diffy diffx), xlabel(-2(1)2) ///
	ylabel(-2(1)2) xline(0) yline(0)
Total regression coefficient, page 717.
regress y x

  Source |       SS       df       MS                  Number of obs =      12
---------+------------------------------               F(  1,    10) =    4.16
   Model |  8.55879381     1  8.55879381               Prob > F      =  0.0686
Residual |  20.5578747    10  2.05578747               R-squared     =  0.2939
---------+------------------------------               Adj R-squared =  0.2233
   Total |  29.1166685    11  2.64696986               Root MSE      =  1.4338

------------------------------------------------------------------------------
       y |      Coef.   Std. Err.       t     P>|t|       [95% Conf. Interval]
---------+--------------------------------------------------------------------
       x |   .7299611   .3577524      2.040   0.069      -.0671609    1.527083
   _cons |   .7022049   1.192135      0.589   0.569      -1.954038    3.358448
------------------------------------------------------------------------------
Use data file crac4, page 728.
use https://stats.idre.ucla.edu/stat/stata/examples/kirk/crac4, clear
Table 15.3-1, page 720.
sort a

by a: list y x

-> a=       1
            y         x
  1.        3        42
  2.        6        57
  3.        3        33
  4.        3        47
  5.        1        32
  6.        2        35
  7.        2        33
  8.        2        39

-> a=       2
            y         x
  9.        4        47
 10.        5        49
 11.        4        42
 12.        3        41
 13.        2        38
 14.        3        43
 15.        4        48
 16.        3        45

-> a=       3
            y         x
 17.        7        61
 18.        8        65
 19.        7        64
 20.        6        56
 21.        5        52
 22.        6        58
 23.        5        53
 24.        6        54

-> a=       4
            y         x
 25.        7        65
 26.        8        74
 27.        9        80
 28.        8        73
 29.       10        85
 30.       10        82
 31.        9        78
 32.       11        89
Table 15.3-2, page 721.
anova y a c.x

                     Number of obs =      32     R-squared     =  0.9701
                     Root MSE      = .510876     Adj R-squared =  0.9656

            Source |  Partial SS    df       MS           F     Prob > F
        -----------+----------------------------------------------------
             Model |  228.453154     4  57.1132885     218.83     0.0000
                   |
                 a |  1.79283521     3  .597611737       2.29     0.1010
                 x |  33.9531542     1  33.9531542     130.09     0.0000
                   |
          Residual |  7.04684582    27   .26099429
        -----------+----------------------------------------------------
             Total |      235.50    31  7.59677419
Adjusted means, page 725.
adjust x, by(a)

-------------------------------------------------------------------------------
Dependent variable: y     Command: anova
Covariate set to mean: x = 55
-------------------------------------------------------------------------------

----------+-----------
        a |         xb
----------+-----------
        1 |    5.31013
        2 |    5.32566
        3 |    5.76735
        4 |    5.09686
----------+-----------
Key:  xb         =  Linear Prediction
Table 15.6-1, page 728.
sort a

by a: list y x z

-> a=       1
            y         x         z
  1.        3        42         3
  2.        6        57         5
  3.        3        33         4
  4.        3        47         4
  5.        1        32         0
  6.        2        35         1
  7.        2        33         0
  8.        2        39         2

-> a=       2
            y         x         z
  9.        4        47         4
 10.        5        49         6
 11.        4        42         5
 12.        3        41         2
 13.        2        38         1
 14.        3        43         2
 15.        4        48         5
 16.        3        45         3

-> a=       3
            y         x         z
 17.        7        61         5
 18.        8        65         7
 19.        7        64         5
 20.        6        56         4
 21.        5        52         2
 22.        6        58         3
 23.        5        53         3
 24.        6        54         4

-> a=       4
            y         x         z
 25.        7        65         2
 26.        8        74         4
 27.        9        80         5
 28.        8        73         5
 29.       10        85         6
 30.       10        82         6
 31.        9        78         5
 32.       11        89         7
Table 15.6-2, page 729.
Note: The values shown in the book for SSBG, SSWG, MSBG, MSWG, and F are incorrect. The values shown below are correct.
anova y a c.x c.z

                     Number of obs =      32     R-squared     =  0.9836
                     Root MSE      = .385291     Adj R-squared =  0.9805

            Source |  Partial SS    df       MS           F     Prob > F
        -----------+----------------------------------------------------
             Model |  231.640316     5  46.3280631     312.08     0.0000
                   |
                 a |  2.65183953     3  .883946509       5.95     0.0031
                 x |  4.29511432     1  4.29511432      28.93     0.0000
                 z |  3.18716138     1  3.18716138      21.47     0.0001
                   |
          Residual |  3.85968444    26  .148449402
        -----------+----------------------------------------------------
             Total |      235.50    31  7.59677419


