Table 8.3-1, page 325.
use https://stats.idre.ucla.edu/stat/stata/examples/kirk/ls4, clear

tabdisp s c, cellvar(y) by(b)  /* levels of a not shown */

----------+-----------------------
          |           c
  b and s |    1     2     3     4
----------+-----------------------
1         |
        1 |    1     2     5     9
        2 |    2     3     6     8
----------+-----------------------
2         |
        1 |    3     8     9     2
        2 |    4     6     8     3
----------+-----------------------
3         |
        1 |    5    10     3     5
        2 |    7    11     2     4
----------+-----------------------
4         |
        1 |    7     6     3     6
        2 |   10     3     4     7
----------+-----------------------

table b c, cont(sum y) row col  /* levels of a not shown */

----------+----------------------------------
          |                 c
        b |     1      2      3      4  Total
----------+----------------------------------
        1 |     3      5     11     17     36
        2 |     7     14     17      5     43
        3 |    12     21      5      9     47
        4 |    17      9      7     13     46
          |
    Total |    39     49     40     44    172
----------+----------------------------------

table a, cont(sum y)

----------+-----------
        a |     sum(y)
----------+-----------
        1 |         22
        2 |         28
        3 |         50
        4 |         72
----------+-----------
Table 8.3-2, page 327.
Note: The term that Kirk calls residual is called a*b*c in this Stata model.
anova y a b c a*b*c

                           Number of obs =      32     R-squared     =  0.9193
                           Root MSE      = 1.08972     Adj R-squared =  0.8437

                  Source |  Partial SS    df       MS           F     Prob > F
              -----------+----------------------------------------------------
                   Model |      216.50    15  14.4333333      12.15     0.0000
                         |
                       a |      194.50     3  64.8333333      54.60     0.0000
                       b |        9.25     3  3.08333333       2.60     0.0884
                       c |        7.75     3  2.58333333       2.18     0.1308
                   a*b*c |        5.00     6  .833333333       0.70     0.6525
                         |
                Residual |       19.00    16      1.1875
              -----------+----------------------------------------------------
                   Total |      235.50    31  7.59677419
Omega-squared computation, page 329.
Note: The omega2 command can be downloaded by typing search contrast (see How can I use the search command to search for programs and get additional help? for more information about using search).
omega2 54.6 3

 omega squared = 0.8340
 effect size   = 2.2417
Table 8.4-1, page 331.
use https://stats.idre.ucla.edu/stat/stata/examples/kirk/ls4a, clear

tabdisp b c, cellvar(y)

----------+-----------------------
          |           c
        b |    1     2     3     4
----------+-----------------------
        1 |    3     5    11    17
        2 |    7    14    17     5
        3 |   12    21     5     9
        4 |   17     9     7    13
----------+-----------------------
Table 8.4-1, page 332.
nonadd y a b c

Tukey's test of nonadditivity for randomized block designs
F (1,5) = .0001702   Pr > F: .99009558
Figure 8.4-1, page 333.
anova y a b c, noanova
predict yhat  /* yhat is the fitted value */

predict e, rstandard  /* e is the standardized residual */

graph twoway scatter e yhat, ylabel(-2(.5)2) xlabel(0(2)20)
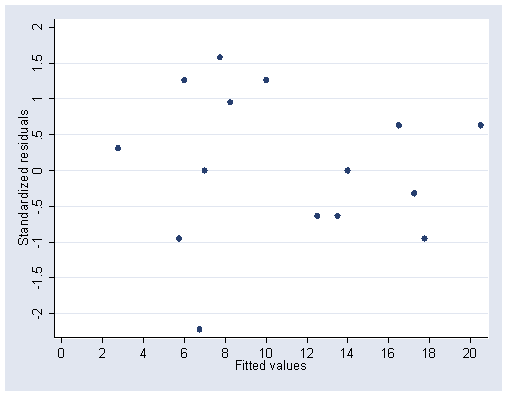
Table 8.11-1, page 353.
use https://stats.idre.ucla.edu/stat/stata/examples/kirk/ls4a, clear

tabdisp s b, cellvar(y)  /* levels of a not shown */

----------+-----------------
          |        b
        s |    1     2     3
----------+-----------------
        1 |    7    14    12
        2 |    3     5    11
        3 |    6     7    11
        4 |   12    13     9
        5 |    7     9     8
        6 |    8    13     9
----------+-----------------
Table 8.11-2, page 355.
anova y a b s

                     Number of obs =      18     R-squared     =  0.9021
                     Root MSE      = 1.38944     Adj R-squared =  0.7920

            Source |  Partial SS    df       MS           F     Prob > F
        -----------+----------------------------------------------------
             Model |  142.333333     9  15.8148148       8.19     0.0035
                   |
                 a |  49.7777778     2  24.8888889      12.89     0.0031
                 b |  34.1111111     2  17.0555556       8.83     0.0094
                 s |  58.4444444     5  11.6888889       6.05     0.0131
                   |
          Residual |  15.4444444     8  1.93055556
        -----------+----------------------------------------------------
             Total |  157.777778    17  9.28104575
Omega-squared computation, page 354.
omega2 12.89 2

 omega squared = 0.5692
 effect size   = 1.1494
Table 8.11-3, page 355.
Note: The fhcomp command can be downloaded by typing search contrast (see How can I use the search command to search for programs and get additional help? for more information about using search).
fhcomp a

Fisher-Hayter pairwise comparisons for variable a
studentized range critical value(.05, 2, 8) = 3.2611823

                                      mean     critical
grp vs grp       group means          dif        dif
-------------------------------------------------------
  1 vs   2     7.3333    11.3333     4.0000*   1.8499
  1 vs   3     7.3333     8.6667     1.3333    1.8499
  2 vs   3    11.3333     8.6667     2.6667*   1.8499