Stata: Sampling: Design and Analysis by Sharon L. Lohr Chapter 2
Textbook Examples Sampling: Design and Analysis by Sharon L. Lohr Chapter 2: Simple Probability Sample
NOTE: If you want to see the design effect or the misspecification effect, use estat effects after the command.
Page 27 in the middle
use https://stats.idre.ucla.edu/stat/stata/examples/lohr/samples.dta, clear
sort k
by k: gen n = _n
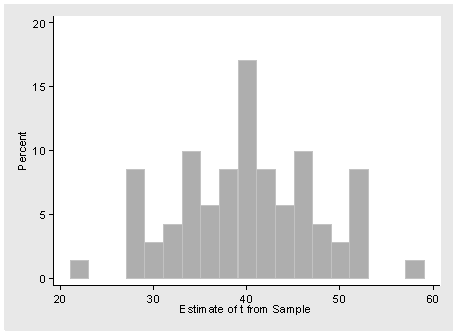
list k n if n[_n+1] == 1 | k == 58
+---------+
| k n |
|---------|
1. | 22 1 |
7. | 28 6 |
9. | 30 2 |
12. | 32 3 |
19. | 34 7 |
|---------|
23. | 36 4 |
29. | 38 6 |
41. | 40 12 |
47. | 42 6 |
51. | 44 4 |
|---------|
58. | 46 7 |
61. | 48 3 |
63. | 50 2 |
69. | 52 6 |
70. | 58 1 |
+---------+
Page 27, figure 2.1
histogram k, percent discrete xtitle(Estimate of t from Sample) ///
ylabel( , nogrid angle(0))
Page 28 at the top
summ k
    Variable |       Obs        Mean    Std. Dev.       Min        Max
-------------+--------------------------------------------------------
           k |        70          40    7.460038         22         58
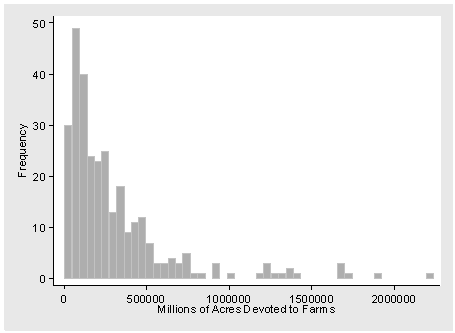
Page 32, figure 2.3
use https://stats.idre.ucla.edu/stat/stata/examples/lohr/agsrs.dta, clear
histogram acres92, freq bin(50) ///
  xtitle(Millions of Acres Devoted to Farms) ylabel( , nogrid angle(0)) ylabel(0(10)50)
Page 34 in the middle
gen myfpc = 3078
svyset , fpc(myfpc)

      pweight: <none>
          VCE: linearized
     Strata 1: <one>
         SU 1: <observations>
        FPC 1: myfpc

svydes

Survey: Describing stage 1 sampling units

      pweight: <none>
          VCE: linearized
     Strata 1: <one>
         SU 1: <observations>
        FPC 1: myfpc

                                      #Obs per Unit
                              ----------------------------
Stratum    #Units     #Obs      min       mean      max
--------  --------  --------  --------  --------  --------
       1       300       300         1       1.0         1
--------  --------  --------  --------  --------  --------
       1       300       300         1       1.0         1

svy: mean acres92
(running mean on estimation sample)

Survey: Mean estimation

Number of strata =       1          Number of obs    =     300
Number of PSUs   =     300          Population size  =     300
                                    Design df        =     299

--------------------------------------------------------------
             |             Linearized
             |       Mean   Std. Err.     [95% Conf. Interval]
-------------+------------------------------------------------
     acres92 |     297897   18898.43      260706.3    335087.8
--------------------------------------------------------------
Page 35 at the top
gen p = 0
replace p = 1 if acres92 < 200000
svy: mean p
(running mean on estimation sample)

Survey: Mean estimation

Number of strata =       1          Number of obs    =     300
Number of PSUs   =     300          Population size  =     300
                                    Design df        =     299

--------------------------------------------------------------
             |             Linearized
             |       Mean   Std. Err.     [95% Conf. Interval]
-------------+------------------------------------------------
           p |        .51    .027465      .4559508    .5640492
--------------------------------------------------------------