NOTE: If you want to see the design effect or the misspecification effect, use estat effects after the command.
Page 96 at the bottom
use https://stats.idre.ucla.edu/stat/stata/examples/lohr/agstrat.dta, clear
sort region
by region: count

---------------------------------------------------------------------------------------------------
-> region = NC
  103
---------------------------------------------------------------------------------------------------
-> region = NE
   21
---------------------------------------------------------------------------------------------------
-> region = S
  135
---------------------------------------------------------------------------------------------------
-> region = W
   41
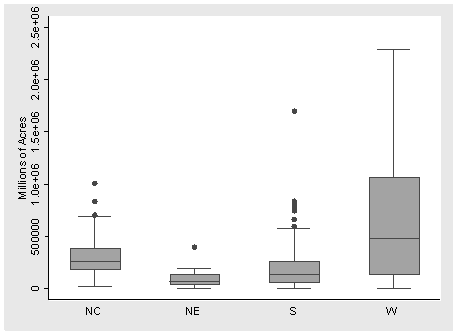
Page 97, figure 4.1
graph box acres92, over(region) ylabel( , nogrid) ytitle(Millions of Acres)
Page 97 table at the bottom
NOTE: The format option is used here so that the numbers are not displayed in scientific notation.
tabstat acres92, s(n mean var) by(region) format(%14.0g)

Summary for variables: acres92
     by categories of: region
      region |         N      mean  variance
-------------+------------------------------
          NC |           103  300504.15534 29618183543.3
          NE |            21 97629.8095238 7647472708.16
           S |           135 211315.044444 53587487856.2
           W |            41 662295.512195  396185950266
-------------+------------------------------
       Total |           300     295612.67  112039472103
--------------------------------------------
Page 98
NOTE: We need to make a numeric version of region for use with the svy: total command. The numbers listed in the column labeled “Estimate” are the same as those in the text in the column labeled “Estimated Total of Farm Acres”. The second svytotal command is used to get the overall total.
svyset [pweight=weight]
gen regionnum = 1
replace regionnum = 2 if region == "NE"
replace regionnum = 3 if region == "S"
replace regionnum = 4 if region == "W"
svy: total acres92, over(regionnum)
(running total on estimation sample)

Survey: Total estimation

Number of strata =       1          Number of obs    =     300
Number of PSUs   =     300          Population size  =    3078
                                    Design df        =     299

            1: regionnum = 1
            2: regionnum = 2
            3: regionnum = 3
            4: regionnum = 4

--------------------------------------------------------------
             |             Linearized
        Over |      Total   Std. Err.     [95% Conf. Interval]
-------------+------------------------------------------------
acres92      |
           1 |   3.17e+08   3.10e+07      2.56e+08    3.78e+08
           2 |   2.15e+07    6110730       9453072    3.35e+07
           3 |   2.92e+08   3.32e+07      2.27e+08    3.57e+08
           4 |   2.79e+08   5.77e+07      1.66e+08    3.93e+08
--------------------------------------------------------------
svy: total acres92
(running total on estimation sample)

Survey: Total estimation

Number of strata =       1          Number of obs    =     300
Number of PSUs   =     300          Population size  =    3078
                                    Design df        =     299

--------------------------------------------------------------
             |             Linearized
             |      Total   Std. Err.     [95% Conf. Interval]
-------------+------------------------------------------------
     acres92 |   9.10e+08   5.96e+07      7.92e+08    1.03e+09
--------------------------------------------------------------
Page 102 Table 4.2
clear
input str18 discipline membership num_mailed valid_ret pct_female
"Literature" 9100 915 636 38
"Classics" 1950 633 451 27
"Philosophy" 5500 658 481 18
"History" 10850 855 611 19
"Linguistics" 2100 667 493 36
"Political Science" 5500 833 575 13
"Sociology" 9000 824 588 26
end

list

     +---------------------------------------------------------------+
     |        discipline   member~p   num_ma~d   valid_~t   pct_fe~e |
     |---------------------------------------------------------------|
  1. |        Literature       9100        915        636         38 |
  2. |          Classics       1950        633        451         27 |
  3. |        Philosophy       5500        658        481         18 |
  4. |           History      10850        855        611         19 |
  5. |       Linguistics       2100        667        493         36 |
     |---------------------------------------------------------------|
  6. | Political Science       5500        833        575         13 |
  7. |         Sociology       9000        824        588         26 |
     +---------------------------------------------------------------+

tabstat membership num_mailed valid_ret, s(sum)

   stats |  member~p  num_ma~d  valid_~t
---------+------------------------------
     sum |     44000      5385      3835
----------------------------------------
Page 104 in the middle
NOTE: The slight difference between this result and that shown in the text is probably due to rounding error.
use https://stats.idre.ucla.edu/stat/stata/examples/lohr/agstrat.dta, clear
gen newwt = 220/21 if region == "NE"
replace newwt = 1054/103 if region == "NC"
replace newwt = 1382/135 if region == "S"
replace newwt = 422/41 if region == "W"
gen total = acres92*newwt
tabstat total, s(sum) format(%15.0g)

    variable |       sum
-------------+----------
       total |  909736007.481
------------------------

