NOTE: If you want to see the design effect or the misspecification effect, use estat effects after the command.
Page 137 in the middle
clear
input person_num cluster gpa
1 1 3.08
2 1 2.60
3 1 3.44
4 1 3.04
1 2 2.36
2 2 3.04
3 2 3.28
4 2 2.68
1 3 2.00
2 3 2.56
3 3 2.52
4 3 1.88
1 4 3.00
2 4 2.88
3 4 3.44
4 4 3.64
1 5 2.68
2 5 1.92
3 5 3.28
4 5 3.20
end

list

     +---------------------------+
     | person~m   cluster    gpa |
     |---------------------------|
  1. |        1         1   3.08 |
  2. |        2         1    2.6 |
  3. |        3         1   3.44 |
  4. |        4         1   3.04 |
  5. |        1         2   2.36 |
     |---------------------------|
  6. |        2         2   3.04 |
  7. |        3         2   3.28 |
  8. |        4         2   2.68 |
  9. |        1         3      2 |
 10. |        2         3   2.56 |
     |---------------------------|
 11. |        3         3   2.52 |
 12. |        4         3   1.88 |
 13. |        1         4      3 |
 14. |        2         4   2.88 |
 15. |        3         4   3.44 |
     |---------------------------|
 16. |        4         4   3.64 |
 17. |        1         5   2.68 |
 18. |        2         5   1.92 |
 19. |        3         5   3.28 |
 20. |        4         5    3.2 |
     +---------------------------+

tabstat gpa, s(sum) by(cluster)

Summary for variables: gpa
     by categories of: cluster

 cluster |       sum
---------+----------
       1 |     12.16
       2 |     11.36
       3 |      8.96
       4 |     12.96
       5 |     11.08
---------+----------
   Total |     56.52
--------------------

gen pwt = 100/5
svyset cluster [pweight = pwt]

      pweight: pwt
          VCE: linearized
     Strata 1: <one>
         SU 1: cluster
        FPC 1: <zero>

svy: total gpa
(running total on estimation sample)

Survey: Total estimation

Number of strata =       1          Number of obs    =      20
Number of PSUs   =       5          Population size  =     400
                                    Design df        =       4

--------------------------------------------------------------
             |             Linearized
             |      Total   Std. Err.     [95% Conf. Interval]
-------------+------------------------------------------------
         gpa |     1130.4   67.16666      943.9154    1316.885
--------------------------------------------------------------
Page 135 at the top
di total = (100/5)*56.52
1130.41130.4
Page 141 at the top
Population A
clear
input cluster value
1 10
1 20
1 30
2 11
2 20
2 32
3 9
3 17
3 31
end

tabstat value, s(mean var)

    variable |      mean  variance
-------------+--------------------
       value |        20      84.5
----------------------------------

tabstat value, s(mean var) by(cluster)

Summary for variables: value
     by categories of: cluster
 cluster |      mean  variance
---------+--------------------
       1 |        20       100
       2 |        21       111
       3 |        19       124
---------+--------------------
   Total |        20      84.5
------------------------------

anova value cluster, regress

      Source |       SS       df       MS              Number of obs =       9
-------------+------------------------------           F(  2,     6) =    0.03
       Model |           6     2           3           Prob > F      =  0.9736
    Residual |         670     6  111.666667           R-squared     =  0.0089
-------------+------------------------------           Adj R-squared = -0.3215
       Total |         676     8        84.5           Root MSE      =  10.567
------------------------------------------------------------------------------
       value        Coef.   Std. Err.      t    P>|t|     [95% Conf. Interval]
------------------------------------------------------------------------------
_cons                  19   6.101002     3.11   0.021     4.071387    33.92861
cluster
           1            1   8.628119     0.12   0.912    -20.11225    22.11225
           2            2   8.628119     0.23   0.824    -19.11225    23.11225
           3    (dropped)
------------------------------------------------------------------------------
Population B
clear
input cluster value
1 9
1 10
1 11
2 17
2 20
2 20
3 31
3 32
3 30
end

tabstat value, s(mean var)

    variable |      mean  variance
-------------+--------------------
       value |        20      84.5
----------------------------------

tabstat value, s(mean var) by(cluster)

Summary for variables: value
     by categories of: cluster
 cluster |      mean  variance
---------+--------------------
       1 |        10         1
       2 |        19         3
       3 |        31         1
---------+--------------------
   Total |        20      84.5
------------------------------

anova value cluster, regress

      Source |       SS       df       MS              Number of obs =       9
-------------+------------------------------           F(  2,     6) =  199.80
       Model |         666     2         333           Prob > F      =  0.0000
    Residual |          10     6  1.66666667           R-squared     =  0.9852
-------------+------------------------------           Adj R-squared =  0.9803
       Total |         676     8        84.5           Root MSE      =   1.291
------------------------------------------------------------------------------
       value        Coef.   Std. Err.      t    P>|t|     [95% Conf. Interval]
------------------------------------------------------------------------------
_cons                  31    .745356    41.59   0.000     29.17618    32.82382
cluster
           1          -21   1.054093   -19.92   0.000    -23.57927   -18.42073
           2          -12   1.054093   -11.38   0.000    -14.57927   -9.420728
           3    (dropped)
------------------------------------------------------------------------------
Page 142 at the top
clear
input person_num cluster gpa
1 1 3.08
2 1 2.60
3 1 3.44
4 1 3.04
1 2 2.36
2 2 3.04
3 2 3.28
4 2 2.68
1 3 2.00
2 3 2.56
3 3 2.52
4 3 1.88
1 4 3.00
2 4 2.88
3 4 3.44
4 4 3.64
1 5 2.68
2 5 1.92
3 5 3.28
4 5 3.20
end

anova gpa cluster

                           Number of obs =      20     R-squared     =  0.4483
                           Root MSE      = .430163     Adj R-squared =  0.3012
                  Source |  Partial SS    df       MS           F     Prob > F
              -----------+----------------------------------------------------
                   Model |  2.25568025     4  .563920063       3.05     0.0504
                         |
                 cluster |  2.25568025     4  .563920063       3.05     0.0504
                         |
                Residual |  2.77560022    15  .185040014
              -----------+----------------------------------------------------
                   Total |  5.03128047    19  .264804235
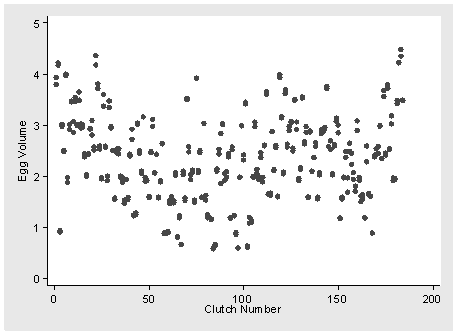
Page 149, figure 5.3
use https://stats.idre.ucla.edu/stat/stata/examples/lohr/coots.dta, clear
graph scatter volume clutch, ylabel( , nogrid angle(0)) ytitle(Egg Volume) xtitle(Clutch Number)
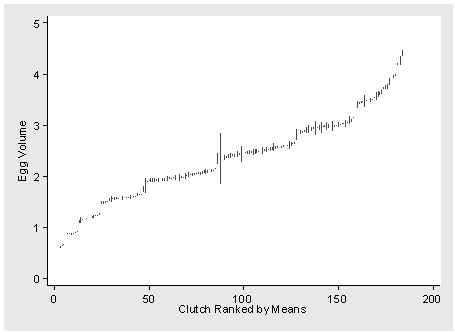
Page 149, figure 5.4
. sort clutch volume
by clutch: egen mean = mean(volume)
by clutch: gen n = _n
drop csize breadth length
reshape wide volume, i(clutch) j(n)
sort mean
gen rank = _n
graph twoway rspike volume1 volume2 rank, ylabel( , nogrid angle(0)) ///
  xtitle(Clutch Ranked by Means) ytitle(Egg Volume)
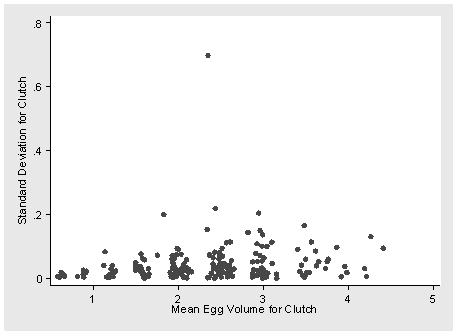
Page 150, figure 5.5
sort clutch
egen sd_dev = rowsd(volume1 volume2)
graph scatter sd_dev mean, ylabel( , nogrid angle(0)) xlabel(1(1)5) ///
  xtitle(Mean Egg Volume for Clutch) ytitle(Standard Deviation for Clutch)
Page 150, table 5.2
use https://stats.idre.ucla.edu/stat/stata/examples/lohr/coots.dta, clear
sort clutch
by clutch: gen n = _n
by clutch: egen mean_vol = mean(volume)
by clutch: egen sd_vol = sd(volume)
gen var_vol = sd_vol*sd_vol
by clutch: gen sum_vol = csize*mean_vol
gen mi = 2
gen a = (1 - (2/csize))*csize^2*(var_vol/mi)
gen yr = 4375.947/1757
gen b = (sum_vol - (csize*yr))^2
NOTE: The extra cases need to be dropped because you can’t use if with tabstat.
. drop if n == 2
list clutch csize mean_vol var_vol sum_vol a b in 1/20

     +-----------------------------------------------------------------------+
     | clutch   csize   mean_vol    var_vol    sum_vol          a          b |
     |-----------------------------------------------------------------------|
  1. |      1      13   3.864303   .0093972   50.23594   .6719013   318.9229 |
  2. |      2      13   4.194183   .0009177   54.52438   .0656166    490.483 |
  3. |      3       6   .9162504   .0004814   5.497502   .0057766   89.22637 |
  4. |      4      11   2.998335    .000795   32.98168   .0393539   31.19573 |
  5. |      5      10   2.495708   .0001574   24.95708   .0062977   .0026303 |
     |-----------------------------------------------------------------------|
  6. |      6      13    3.98426   .0003304   51.79538   .0236219   377.0529 |
  7. |      7       9   1.927069   .0050616   17.34362   .1594406   25.72102 |
  8. |      8      11   2.961526    .005123   32.57679   .2535884   26.83677 |
  9. |      9      12   3.460579   .0001066   41.52695   .0063963   135.4897 |
 10. |     10      11   2.961526   .0223972   32.57679   1.108663   26.83677 |
     |-----------------------------------------------------------------------|
 11. |     11      12   3.498909   .0035246    41.9869   .2114751   146.4089 |
 12. |     12      11   2.999868   .0001694   32.99855   .0083832   31.38445 |
 13. |     13      12   3.566441    .012899   42.79729   .7739403   166.6769 |
 14. |     14      11   2.986065   .0029402   32.84672   .1455399   29.70632 |
 15. |     15      11   2.982998   .0010585   32.81298   .0523944   29.33965 |
     |-----------------------------------------------------------------------|
 16. |     16      10   2.406982   .0020082   24.06982   .0803278   .6988369 |
 17. |     17       9    2.01023   .0005397   18.09207   .0169998   18.68958 |
 18. |     18      10   2.437402   .0000289   24.37403   .0011567   .2827725 |
 19. |     19      11   2.926252   .0000753   32.18877   .0037259   22.96712 |
 20. |     20      11   2.947723   .0415674   32.42496   2.057586   25.28671 |
     +-----------------------------------------------------------------------+

list clutch csize mean_vol var_vol sum_vol a b in -10/l

     +-----------------------------------------------------------------------+
     | clutch   csize   mean_vol    var_vol    sum_vol          a          b |
     |-----------------------------------------------------------------------|
175. |    175      10     2.4336   .0008226     24.336   .0329023    .324661 |
176. |    176      12   3.752611   .0026651   45.03133   .1599053   229.3525 |
177. |    177      10   2.527395   .0003213   25.27395   .0128525    .135543 |
178. |    178      11   3.101091   .0127205     34.112   .6296641   45.09971 |
179. |    179       9   1.940416   .0014251   17.46374   .0448905   24.51704 |
     |-----------------------------------------------------------------------|
180. |    180       9   1.946576   .0000759   17.51918   .0023906   23.97109 |
181. |    181      12   3.453279   .0017057   41.43934   .1023399   133.4579 |
182. |    182      13   4.219888   .0000367   54.85854   .0026246    505.396 |
183. |    183      13   4.414816   .0088191   57.39261   .6305637   625.7546 |
184. |    184      12   3.484307   6.66e-06   41.81168   .0003997   142.1994 |
     +-----------------------------------------------------------------------+

tabstat csize sum_vol a b, s(sum)

   stats |     csize   sum_vol         a         b
---------+----------------------------------------
     sum |      1757  4375.947  42.17445  11439.58
--------------------------------------------------

tabstat sum_vol, s(var)

    variable |  variance
-------------+----------
     sum_vol |  149.5648
------------------------
Page 154 Table 5.3
NOTE: There was an error in the data set. This has been corrected in the data that you can use from the ATS website. However, if you use the data off of the CD in the book or from the publisher’s website, your answers may differ slightly. (The problem is with csize for clutch 88.)
use https://stats.idre.ucla.edu/stat/stata/examples/lohr/coots.dta, clear
gen relwt = csize/2
gen wtvol = relwt*volume
list clutch csize volume relwt wtvol in 1/8

     +----------------------------------------------+
     | clutch   csize     volume   relwt      wtvol |
     |----------------------------------------------|
  1. |      1      13   3.795757     6.5   24.67242 |
  2. |      1      13    3.93285     6.5   25.56352 |
  3. |      2      13   4.215604     6.5   27.40142 |
  4. |      2      13   4.172762     6.5   27.12295 |
  5. |      3       6   .9317646       3   2.795294 |
     |----------------------------------------------|
  6. |      3       6   .9007362       3   2.702209 |
  7. |      4      11   3.018272     5.5    16.6005 |
  8. |      4      11   2.978397     5.5   16.38118 |
     +----------------------------------------------+

list clutch csize volume relwt wtvol in -4/l

     +----------------------------------------------+
     | clutch   csize     volume   relwt      wtvol |
     |----------------------------------------------|
365. |    183      13   4.481221     6.5   29.12794 |
366. |    183      13   4.348412     6.5   28.26468 |
367. |    184      12   3.486132       6   20.91679 |
368. |    184      12   3.482482       6   20.89489 |
     +----------------------------------------------+

tabstat csize relwt wtvol, s(sum)

   stats |     csize     relwt     wtvol
---------+------------------------------
     sum |      3514      1757  4375.947
----------------------------------------
Page 158 at the top
NOTE: You need to increase the matsize (matrix size) above the default value or you will get an error message.
set matsize 200
anova volume clutch

                           Number of obs =     368     R-squared     =  0.9958
                           Root MSE      =  .07697     Adj R-squared =  0.9916
                  Source |  Partial SS    df       MS           F     Prob > F
              -----------+----------------------------------------------------
                   Model |  257.417531   183  1.40665317     237.44     0.0000
                         |
                  clutch |  257.417531   183  1.40665317     237.44     0.0000
                         |
                Residual |  1.09007809   184  .005924337
              -----------+----------------------------------------------------
                   Total |  258.507609   367  .704380405
Page 167 in the middle
. sort clutch
by clutch: gen n = _n
by clutch: egen mean_vol = mean(volume)
by clutch: gen sum_vol = csize*mean_vol
corr sum_vol csize

(obs=368)
             |  sum_vol    csize
-------------+------------------
     sum_vol |   1.0000
       csize |   0.9693   1.0000
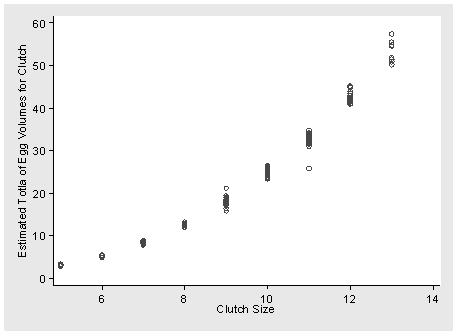
Page 167, figure 5.11
graph scatter sum_vol csize, ylabel(0(10)60, nogrid angle(0)) ytitle(Estimated Totla of Egg Volumes for Clutch) ///
  xlabel(6(2)14) xtitle(Clutch Size) msymbol(Oh)


