NOTE: If you want to see the design effect or the misspecification effect, use estat effects after the command.
Page 231, table 7.1
use https://stats.idre.ucla.edu/stat/stata/examples/lohr/htpop.dta, clear
tabulate height

     height |      Freq.     Percent        Cum.
------------+-----------------------------------
        136 |          1        0.05        0.05
        140 |          1        0.05        0.10
        141 |          2        0.10        0.20
        142 |          1        0.05        0.25
        143 |          6        0.30        0.55
        144 |          3        0.15        0.70
        145 |          4        0.20        0.90
        146 |          3        0.15        1.05
        147 |         14        0.70        1.75
        148 |         11        0.55        2.30
        149 |         13        0.65        2.95
        150 |         20        1.00        3.95
        151 |         15        0.75        4.70
        152 |         18        0.90        5.60
        153 |         28        1.40        7.00
        154 |         38        1.90        8.90
        155 |         38        1.90       10.80
        156 |         57        2.85       13.65
        157 |         53        2.65       16.30
        158 |         49        2.45       18.75
        159 |         55        2.75       21.50
        160 |         77        3.85       25.35
        161 |         72        3.60       28.95
        162 |         66        3.30       32.25
        163 |         62        3.10       35.35
        164 |         61        3.05       38.40
        165 |         60        3.00       41.40
        166 |         75        3.75       45.15
        167 |         79        3.95       49.10
        168 |         62        3.10       52.20
        169 |         79        3.95       56.15
        170 |         72        3.60       59.75
        171 |         56        2.80       62.55
        172 |         57        2.85       65.40
        173 |         45        2.25       67.65
        174 |         52        2.60       70.25
        175 |         57        2.85       73.10
        176 |         49        2.45       75.55
        177 |         54        2.70       78.25
        178 |         57        2.85       81.10
        179 |         40        2.00       83.10
        180 |         35        1.75       84.85
        181 |         43        2.15       87.00
        182 |         29        1.45       88.45
        183 |         26        1.30       89.75
        184 |         29        1.45       91.20
        185 |         23        1.15       92.35
        186 |         21        1.05       93.40
        187 |         19        0.95       94.35
        188 |         17        0.85       95.20
        189 |         15        0.75       95.95
        190 |         10        0.50       96.45
        191 |         14        0.70       97.15
        192 |         10        0.50       97.65
        193 |          9        0.45       98.10
        194 |          7        0.35       98.45
        195 |          2        0.10       98.55
        196 |          7        0.35       98.90
        197 |          8        0.40       99.30
        198 |          4        0.20       99.50
        199 |          2        0.10       99.60
        200 |          4        0.20       99.80
        201 |          1        0.05       99.85
        204 |          1        0.05       99.90
        206 |          2        0.10      100.00
------------+-----------------------------------
      Total |      2,000      100.00
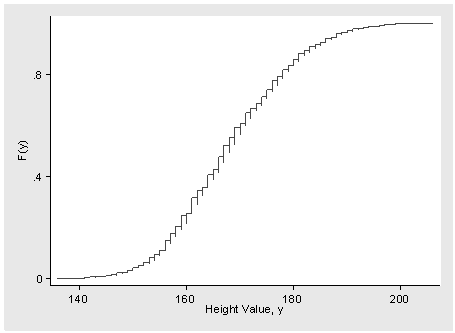
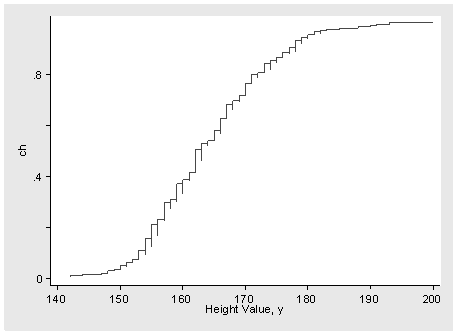
Page 231 Figure 7.1
cumul height, gen(ch)
sort height
graph scatter ch height, con(stepstair) ylabel(0 .4 .8, nogrid angle(0)) ///
  ytitle("F(y)") xtitle("Height Value, y") xlabel(140(20)200) msym(i)
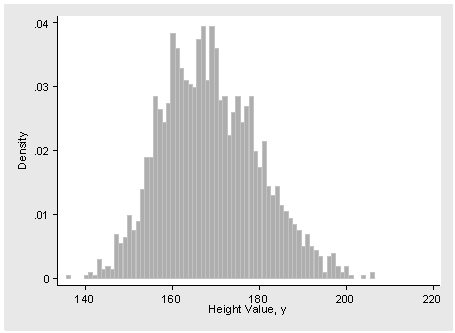
Page 232 Figure 7.2
histogram height, discrete xtitle("Height Value, y") ylabel( , nogrid)
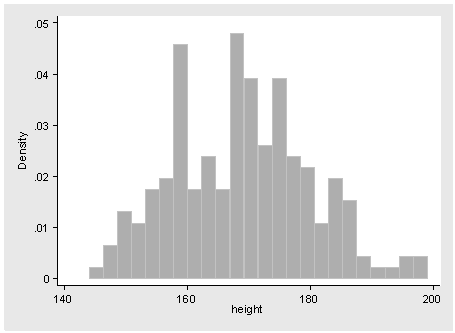
Page 232 Figure 7.3
use https://stats.idre.ucla.edu/stat/stata/examples/lohr/htsrs.dta, clear
histogram height, bin(24) ylabel( , nogrid)
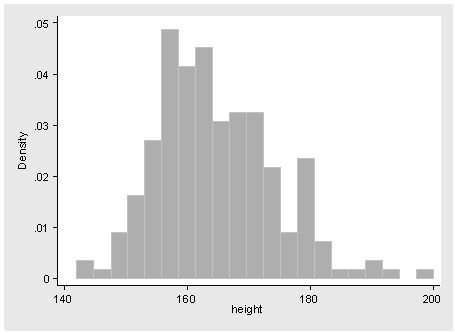
Page 232, figure 7.4
use https://stats.idre.ucla.edu/stat/stata/examples/lohr/htstrat.dta, clear
histogram height, bin(21) ylabel( , nogrid angle(0))
Page 233, figure 7.5
NOTE: The top figure has been skipped for now.
cumul height, gen(ch)
sort height
graph scatter ch height, con(stepstair) ylabel(0 .4 .8, nogrid angle(0)) ///
  ytick(.2 .6) xlabel(140(10)200) xtitle("Height Value, y") msym(i)
Page 234, table 7.2
NOTE: We could only get the mean for the last column.
Population:
use https://stats.idre.ucla.edu/stat/stata/examples/lohr/htpop.dta, clear
tabstat height, s(mean median p25 p90 var)

    variable |      mean       p50       p25       p90  variance
-------------+--------------------------------------------------
      height |   168.616       168       160       184  124.5038
----------------------------------------------------------------
SRS:
use https://stats.idre.ucla.edu/stat/stata/examples/lohr/htsrs.dta, clear
tabstat height, s(mean median p25 p90 var)

    variable |      mean       p50       p25       p90  variance
-------------+--------------------------------------------------
      height |    168.94       169       160       184  122.6396
----------------------------------------------------------------
Stratified, no weights:
use https://stats.idre.ucla.edu/stat/stata/examples/lohr/htstrat.dta, clear
tabstat height, s(mean median p25 p90 var)

    variable |      mean       p50       p25       p90  variance
-------------+--------------------------------------------------
      height |   164.645       163       157       178  93.40601
----------------------------------------------------------------
Stratified, with weights:
use https://stats.idre.ucla.edu/stat/stata/examples/lohr/htstrat.dta, clear
gen wt = 6.25
replace wt = 25 if gender == "M"
svyset [pweight = wt]

      pweight: wt
          VCE: linearized
     Strata 1: <one>
         SU 1: <observations>
        FPC 1: <zero>

svy: mean height
(running mean on estimation sample)

Survey: Mean estimation

Number of strata =       1          Number of obs    =     200
Number of PSUs   =     200          Population size  =    2000
                                    Design df        =     199

--------------------------------------------------------------
             |             Linearized
             |       Mean   Std. Err.     [95% Conf. Interval]
-------------+------------------------------------------------
      height |   169.0156   .9766307      167.0898    170.9415
--------------------------------------------------------------
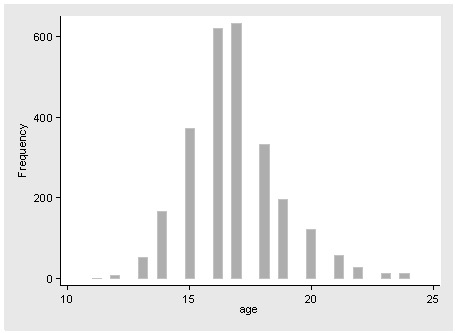
Page 236, figure 7.6
use https://stats.idre.ucla.edu/stat/stata/examples/lohr/syc.dta, clear
histogram age, freq ylabel( , nogrid angle(0))
Page 237 Figure 7.7
NOTE: This has been skipped for now.
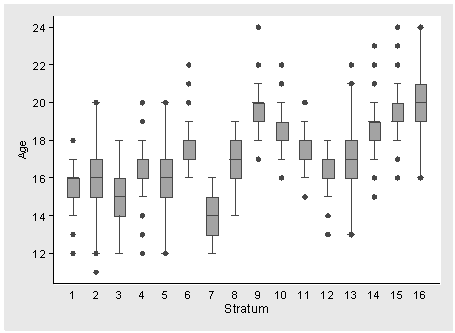
Page 237, figure 7.8
graph box age [pweight = finalwt], over(stratum) ytitle(Age) ///
  ylabel(12(2)24, nogrid angle(0)) b1title(Stratum)
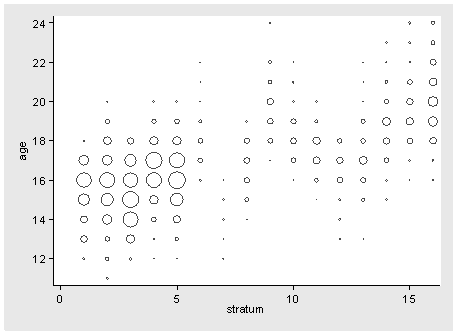
Page 238, figure 7.9
sort stratum age
by stratum age: egen sumwt = total(finalwt)
graph scatter age stratum [pweight = sumwt], msymbol(Oh) msize(vsmall) ///
  ylabel(12(2)24, nogrid angle(0))
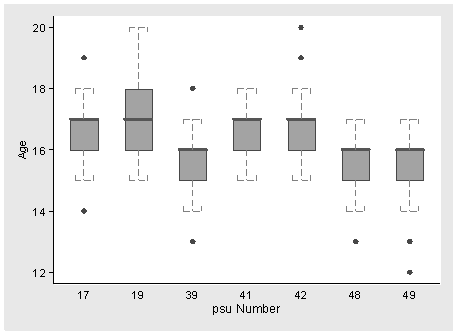
Page 238, figure 7.10
graph box age if stratum == 5 [pweight = finalwt], over(psu) ///
  ylabel( , nogrid angle(0)) ytitle(Age) b1title(psu Number) ///
  medline(lwidth(thick) lcolor(red)) medtype(cline) cwhiskers ///
  lines(lpattern(dash)) capsize(20)
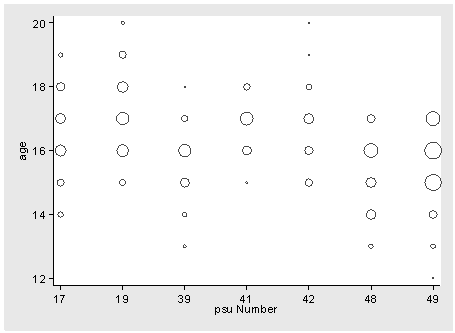
Page 239 Figure 7.11
sort psu age
by psu age: egen wt711 = total(finalwt)
gen fake_psu = psu
recode fake_psu (17=1) (19=2) (39=3) (41=4) (42=5) (48=6) (49=7)
list psu fake_psu if stratum == 5
graph scatter age fake_psu if stratum == 5 [pweight = wt711], ///
  msymbol(Oh) msize(vsmall) ylabel( , nogrid angle(0)) ///
  xlabel(1 "17" 2 "19" 3 "39" 4 "41" 5 "42" 6 "48" 7 "49") xtitle(psu Number)
Page 247 Figure 7.12
NOTE: This has been skipped for now.

