Note: This page has been updated in January 2011 using Stata 11.
Table 3.2, page 46. OLS regression lines over 10 schools.
use https://stats.idre.ucla.edu/stat/stata/examples/mlm_imm/imm10, clear
statsby intercept=_b[_cons] se_int=_se[_cons] homework=_b[homework] ///
        se_homework =_se[homework] n =e(N) r2=e(r2) , ///
        by(schnum) total saving(statby, replace): regress math homework

use statby, clear
gen r = (-1)^((homework>0)-1)*sqrt(r2)
list
     +----------------------------------------------------------------------------------+
     | schnum   interc~t     se_int    homework   se_hom~k     n         r2           r |
     |----------------------------------------------------------------------------------|
  1. |      1   50.68354   2.211345   -3.553797   1.249839    23   .2779769   -.5272352 |
  2. |      2   49.01229    3.55737   -2.920123   1.330381    20   .2111427   -.4595027 |
  3. |      3      38.75   2.943105    7.909091   1.374722    24   .6007232    .7750633 |
  4. |      4   34.39382   1.796048    5.592664   .8182317    22   .7002311    .8367981 |
  5. |      5   53.93863   2.523248   -4.718411   2.197719    22   .1873034   -.4327856 |
     |----------------------------------------------------------------------------------|
  6. |      6   49.25896   1.546975   -2.486056   1.107812    20   .2186159   -.4675638 |
  7. |      7   59.21022   1.431387     1.09464    .385233    67   .1104923    .3324038 |
  8. |      8   36.05535   3.464429     6.49631   1.461505    21   .5097728    .7139838 |
  9. |      9      38.52   3.188946        5.86   1.988657    21   .3136609    .5600544 |
 10. |     10   37.71392   2.366805    6.335052   1.115723    20   .6417159    .8010717 |
     |----------------------------------------------------------------------------------|
 11. |      .   44.07386    .988641    3.571856   .3882366   260   .2470313    .4970225 |
     +----------------------------------------------------------------------------------+
Two equations at the top of page 47.
use https://stats.idre.ucla.edu/stat/stata/examples/mlm_imm/imm10, clear
collapse (mean) public, by(schnum)
merge 1:1 schnum using statby
regress intercept public

      Source |       SS       df       MS              Number of obs =      10
-------------+------------------------------           F(  1,     8) =    4.20
       Model |   232.21294     1   232.21294           Prob > F      =  0.0745
    Residual |  442.187199     8  55.2733999           R-squared     =  0.3443
-------------+------------------------------           Adj R-squared =  0.2624
       Total |  674.400139     9  74.9333487           Root MSE      =  7.4346

------------------------------------------------------------------------------
       bcons |      Coef.   Std. Err.      t    P>|t|     [95% Conf. Interval]
-------------+----------------------------------------------------------------
      public |  -16.06283   7.836765    -2.05   0.075    -34.13444    2.008787
       _cons |   59.21022   7.434608     7.96   0.000     42.06598    76.35445
------------------------------------------------------------------------------

regress homework public

      Source |       SS       df       MS              Number of obs =      10
-------------+------------------------------           F(  1,     8) =    0.03
       Model |  .833856092     1  .833856092           Prob > F      =  0.8667
    Residual |  222.018254     8  27.7522817           R-squared     =  0.0037
-------------+------------------------------           Adj R-squared = -0.1208
       Total |   222.85211     9  24.7613455           Root MSE      =   5.268

------------------------------------------------------------------------------
       bhmwk |      Coef.   Std. Err.      t    P>|t|     [95% Conf. Interval]
-------------+----------------------------------------------------------------
      public |   .9625522   5.553005     0.17   0.867     -11.8427    13.76781
       _cons |    1.09464   5.268043     0.21   0.841    -11.05349    13.24277
------------------------------------------------------------------------------
Equation near bottom of page 47 and Table 3.3. We will use the xtmixed command (new to Stata 9).
use https://stats.idre.ucla.edu/stat/stata/examples/mlm_imm/imm10, clear
xtmixed math homework || schnum: homework, variance covar(un) mle

Mixed-effects ML regression                     Number of obs      =       260
Group variable: schnum                          Number of groups   =        10

                                                Obs per group: min =        20
                                                               avg =      26.0
                                                               max =        67


                                                Wald chi2(1)       =      1.94
Log likelihood = -884.69291                     Prob > chi2        =    0.1641

------------------------------------------------------------------------------
        math |      Coef.   Std. Err.      z    P>|z|     [95% Conf. Interval]
-------------+----------------------------------------------------------------
    homework |   2.048702   1.472231     1.39   0.164    -.8368176    4.934222
       _cons |   44.77263   2.603198    17.20   0.000     39.67045     49.8748
------------------------------------------------------------------------------

------------------------------------------------------------------------------
  Random-effects Parameters  |   Estimate   Std. Err.     [95% Conf. Interval]
-----------------------------+------------------------------------------------
schnum: Unstructured         |
               var(homework) |   19.97867   9.808877      7.632283    52.29725
                  var(_cons) |   61.80612   29.87304      23.96714    159.3847
         cov(homework,_cons) |  -28.26033   15.48584     -58.61201    2.091356
-----------------------------+------------------------------------------------
               var(Residual) |   43.06696    3.92917      36.01519    51.49947
------------------------------------------------------------------------------
LR test vs. linear regression:       chi2(3) =   146.97   Prob > chi2 = 0.0000

Note: LR test is conservative and provided only for reference

estat ic
-----------------------------------------------------------------------------
       Model |    Obs    ll(null)   ll(model)     df          AIC         BIC
-------------+---------------------------------------------------------------
           . |    260           .   -884.6929      6     1781.386     1802.75
-----------------------------------------------------------------------------

display "deviance = " -2*e(ll)

deviance = 1769.3858
Equation near bottom of page 49 and Table 3.4.
xtmixed math homework public || schnum: homework, variance covar(un) mle

Mixed-effects ML regression                     Number of obs      =       260
Group variable: schnum                          Number of groups   =        10

                                                Obs per group: min =        20
                                                               avg =      26.0
                                                               max =        67


                                                Wald chi2(2)       =     65.83
Log likelihood = -875.41775                     Prob > chi2        =    0.0000

------------------------------------------------------------------------------
        math |      Coef.   Std. Err.      z    P>|z|     [95% Conf. Interval]
-------------+----------------------------------------------------------------
    homework |   1.940879   1.524946     1.27   0.203     -1.04796    4.929718
      public |  -14.65118   1.831514    -8.00   0.000    -18.24088   -11.06148
       _cons |   58.05564   2.694585    21.55   0.000     52.77435    63.33693
------------------------------------------------------------------------------

------------------------------------------------------------------------------
  Random-effects Parameters  |   Estimate   Std. Err.     [95% Conf. Interval]
-----------------------------+------------------------------------------------
schnum: Unstructured         |
               var(homework) |   21.68283   10.53731      8.364752    56.20548
                  var(_cons) |   40.67683   20.62146      15.05995    109.8679
         cov(homework,_cons) |  -29.15938   14.48164     -57.54288   -.7758841
-----------------------------+------------------------------------------------
               var(Residual) |   42.95451   3.910387      35.93512    51.34502
------------------------------------------------------------------------------
LR test vs. linear regression:       chi2(3) =    95.17   Prob > chi2 = 0.0000

Note: LR test is conservative and provided only for reference

estat ic

-----------------------------------------------------------------------------
       Model |    Obs    ll(null)   ll(model)     df          AIC         BIC
-------------+---------------------------------------------------------------
           . |    260           .   -875.4177      7     1764.835     1789.76
-----------------------------------------------------------------------------

display "deviance = " -2*e(ll)

deviance = 1750.8355
Equation at the bottom of page 50 and Table 3.5. The negative value for the interaction coefficient in the book is probably a typo error, it should be positive.
xtmixed math c.homework##c.public || schnum: homework, variance covar(un) mle


Mixed-effects ML regression                     Number of obs      =       260
Group variable: schnum                          Number of groups   =        10

                                                Obs per group: min =        20
                                                               avg =      26.0
                                                               max =        67


                                                Wald chi2(3)       =     65.80
Log likelihood = -875.39941                     Prob > chi2        =    0.0000

------------------------------------------------------------------------------
        math |      Coef.   Std. Err.      z    P>|z|     [95% Conf. Interval]
-------------+----------------------------------------------------------------
    homework |    1.09464   4.668642     0.23   0.815     -8.05573    10.24501
      public |   -15.9419   6.977582    -2.28   0.022    -29.61771   -2.266095
             |
  c.homework#|
    c.public |   .9472457   4.938235     0.19   0.848    -8.731516    10.62601
             |
       _cons |   59.21022   6.597608     8.97   0.000     46.27914    72.14129
------------------------------------------------------------------------------

------------------------------------------------------------------------------
  Random-effects Parameters  |   Estimate   Std. Err.     [95% Conf. Interval]
-----------------------------+------------------------------------------------
schnum: Unstructured         |
               var(homework) |   21.57709   10.49951        8.3137    56.00045
                  var(_cons) |   40.50325   20.54638       14.9863    109.4675
         cov(homework,_cons) |  -29.02237    14.4298     -57.30427   -.7404695
-----------------------------+------------------------------------------------
               var(Residual) |   42.95436   3.910358      35.93502     51.3448
------------------------------------------------------------------------------
LR test vs. linear regression:       chi2(3) =    92.27   Prob > chi2 = 0.0000

Note: LR test is conservative and provided only for reference.

estat ic
-----------------------------------------------------------------------------
       Model |    Obs    ll(null)   ll(model)     df          AIC         BIC
-------------+---------------------------------------------------------------
           . |    260           .   -875.3994      8     1766.799    1795.284
-----------------------------------------------------------------------------

display "deviance = " -2*e(ll)

deviance = 1750.7988
Table 3.6, page 52.
/* quietly rerun model from page 47 */
quietly xtmixed math homework || schnum: homework, variance covar(un) mle

/* predict random effects */
predict u1 u0, reffects

/* generate posterior intercept and slope */
generate b0 = _b[_cons]    + u0
generate b1 = _b[homework] + u1
contract b0 b1 schnum
sort schnum
list

     +---------------------------------------+
     | schnum         b0          b1   _freq |
     |---------------------------------------|
  1. |      1    50.2709   -3.143403      23 |
  2. |      2   48.88624      -2.754      20 |
  3. |      3   39.19527    7.566349      24 |
  4. |      4   35.15662    5.394136      22 |
  5. |      5   53.08111   -3.738239      22 |
     |---------------------------------------|
  6. |      6   48.58598   -1.765201      20 |
  7. |      7   58.05541    1.335183      67 |
  8. |      8   37.15231    6.060018      21 |
  9. |      9   39.16967    5.430479      21 |
 10. |     10   38.17278    6.101701      20 |
     +---------------------------------------+
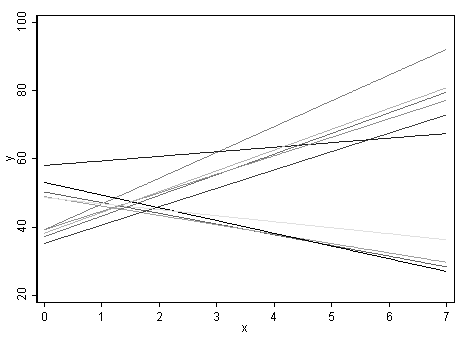
Figure 3.8, page 53.
twoway (function 50.2709-3.143404*x, range(0 7)) ///
  (function 48.88624-2.754*x, range(0 7))        ///
  (function 39.19527+7.56635*x, range(0 7))      ///
  (function 35.15662+5.394136*x, range(0 7))     ///
  (function 53.08111-3.73824*x, range(0 7))      ///
  (function 48.58598-1.765202*x, range(0 7))     ///
  (function 58.05541+1.335182*x, range(0 7))     ///
  (function 37.15231+6.060019*x, range(0 7))     ///
  (function 39.16966+5.430479*x, range(0 7))     ///
  (function 38.17278+6.101702*x, range(0 7)),    ///
   xlabel(0(1)7) yline(0) legend(off) aspectratio(1.15)

 twoway (function 50.2709-3.143404*x, range(0 7)) ///
  (function 48.88624-2.754*x, range(0 7))        ///
  (function 39.19527+7.56635*x, range(0 7))      ///
  (function 35.15662+5.394136*x, range(0 7))     ///
  (function 53.08111-3.73824*x, range(0 7))      ///
  (function 48.58598-1.765202*x, range(0 7))     ///
  (function 58.05541+1.335182*x, range(0 7))     ///
  (function 37.15231+6.060019*x, range(0 7))     ///
  (function 39.16966+5.430479*x, range(0 7))     ///
  (function 38.17278+6.101702*x, range(0 7)),    ///
   xlabel(0(1)7) legend(off) scheme(s1mono)