Table 10.1, page 225.
use https://stats.idre.ucla.edu/stat/stata/examples/pma5/depress, clear

generate sex1 = sex - 1
tabstat cesd health sex1 age educat income, statistics(mean sd) col(stat)


    variable |      mean        sd
-------------+--------------------
        cesd |  8.884354  8.823655
      health |  1.772109  .8379466
        sex1 |   .622449   .485601
         age |  44.41497  18.08544
      educat |  3.479592   1.31073
      income |  20.57483  15.29012
----------------------------------
Table 10.2, page 225.
correlate cesd health sex age educat income
(obs=294)

             |     cesd   health      sex      age   educat   income
-------------+------------------------------------------------------
        cesd |   1.0000
      health |   0.2120   1.0000
         sex |   0.1236   0.0982   1.0000
         age |  -0.1641   0.3042   0.0435   1.0000
      educat |  -0.1014  -0.2699  -0.1060  -0.2084   1.0000
      income |  -0.1580  -0.1834  -0.1803  -0.1917   0.4290   1.0000
Table 10.3, page 227.
canon (cesd health) (sex age educat income), test(1 2) stderr

Linear combinations for canonical correlations         Number of obs =     294
------------------------------------------------------------------------------
             |      Coef.   Std. Err.      t    P>|t|     [95% Conf. Interval]
-------------+----------------------------------------------------------------
u1           |
        cesd |  -.0554891   .0153463    -3.62   0.000     -.085692   -.0252861
      health |   1.171779   .1615978     7.25   0.000     .8537398    1.489819
-------------+----------------------------------------------------------------
v1           |
         sex |   .0512338   .2781572     0.18   0.854    -.4962057    .5986732
         age |   .0481484   .0075581     6.37   0.000     .0332733    .0630234
      educat |  -.2921213   .1133617    -2.58   0.010    -.5152277    -.069015
      income |   .0053689   .0097879     0.55   0.584    -.0138946    .0246324
-------------+----------------------------------------------------------------
u2           |
        cesd |  -.1018304   .0246842    -4.13   0.000    -.1504111   -.0532496
      health |  -.3437097   .2599267    -1.32   0.187    -.8552697    .1678503
-------------+----------------------------------------------------------------
v2           |
         sex |  -.8164423   .4474102    -1.82   0.069    -1.696987    .0641029
         age |    .024468   .0121571     2.01   0.045     .0005418    .0483943
      educat |   .3419603   .1823399     1.88   0.062    -.0169016    .7008223
      income |    .036287   .0157436     2.30   0.022      .005302     .067272
------------------------------------------------------------------------------
                                     (Standard errors estimated conditionally)
Canonical correlations:
  0.4050  0.2655

----------------------------------------------------------------------------
Tests of significance of all canonical correlations

                         Statistic      df1      df2            F     Prob>F
         Wilks' lambda     .777022        8      576       9.6800     0.0000 e
        Pillai's trace     .234543        8      578       9.5985     0.0000 a
Lawley-Hotelling trace     .272081        8      574       9.7609     0.0000 a
    Roy's largest root     .196233        4      289      14.1779     0.0000 u
----------------------------------------------------------------------------
Test of significance of canonical correlations 1-2

                         Statistic      df1      df2            F     Prob>F
         Wilks' lambda     .777022        8      576       9.6800     0.0000 e
----------------------------------------------------------------------------
Test of significance of canonical correlation 2

                         Statistic      df1      df2            F     Prob>F
         Wilks' lambda       .9295        3      289       7.3067     0.0001 e
----------------------------------------------------------------------------
                            e = exact, a = approximate, u = upper bound on F

/* Standardized Coefficients */
canon, stdcoef notests

Canonical correlation analysis                         Number of obs =     294

Standardized coefficients for the first variable set

                 |        1         2
    -------------+--------------------
            cesd |  -0.4896    0.8985
          health |   0.9819    0.2880
    ----------------------------------


Standardized coefficients for the second variable set

                 |        1         2
    -------------+--------------------
             sex |   0.0249   -0.3965
             age |   0.8708    0.4425
          educat |  -0.3829    0.4482
          income |   0.0821    0.5548
    ----------------------------------

----------------------------------------------------------------------------
Canonical correlations:
  0.4050  0.2655
Page 228.
NOTE: These computations are based on the previous table.
Page 229. The second canonical correlations are also given above.
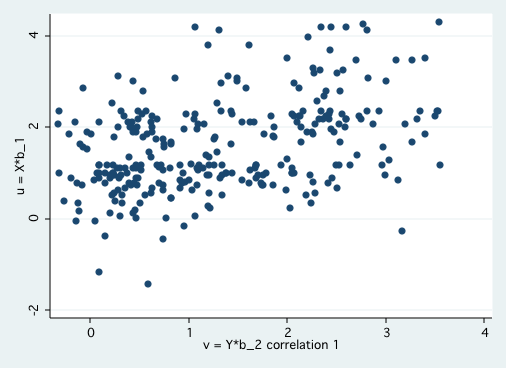
Figure 10.1, page 231. Note: The shape of the plot is the same as in the book, the values are just shifted slightly.
predict u1 if e(sample), u corr(1)
predict v1 if e(sample), v corr(1)
scatter u1 v1
Table 10.5, page 232.
estat loadings
Canonical loadings for variable list 1

                 |        1         2
    -------------+--------------------
            cesd |  -0.2815   -0.9596
          health |   0.8781   -0.4785
    ----------------------------------

Canonical loadings for variable list 2

                 |        1         2
    -------------+--------------------
             sex |   0.0886   -0.5247
             age |   0.9359    0.2255
          educat |  -0.5318    0.6360
          income |  -0.2536    0.7338
    ----------------------------------

Correlation between variable list 1 and canonical variates from list 2

                 |        1         2
    -------------+--------------------
            cesd |  -0.1140   -0.2548
          health |   0.3556   -0.1270
    ----------------------------------

Correlation between variable list 2 and canonical variates from list 1

                 |        1         2
    -------------+--------------------
             sex |   0.0359   -0.1393
             age |   0.3791    0.0599
          educat |  -0.2154    0.1689
          income |  -0.1027    0.1948
    ----------------------------------
NOTE: The signs of the canonical correlations are arbitrary. Hence, even though the signs shown in the output below are different to those shown in the text, both are correct.

