Table 11.1, page 242.
use https://stats.idre.ucla.edu/stat/stata/examples/pma5/depress, clear

sort cases
by cases: tabstat sex age educat income health beddays acuteill chronill, statistics(mean sd)

_______________________________________________________________________________
-> cases = normal

   stats |       sex       age    educat    income    health   beddays  acuteill  chronill
---------+--------------------------------------------------------------------------------
    mean |  1.586066   45.2418  3.545082  21.67623  1.713115  .1721311  .2786885  .4836066
      sd |  .4935494  18.14649  1.331023  15.97547   .795869  .3782703  .4492755  .5007584
------------------------------------------------------------------------------------------

_______________________________________________________________________________
-> cases = depressed

   stats |       sex       age    educat    income    health   beddays  acuteill  chronill
---------+--------------------------------------------------------------------------------
    mean |       1.8     40.38      3.16      15.2      2.06       .42       .38       .62
      sd |   .404061  17.40032   1.16689  9.837454   .977502  .4985694  .4903144  .4903144
------------------------------------------------------------------------------------------
Figure 11.2, page 244.
NOTE: We were unable to reproduce this graph.
Table 11.2, page 245.
discrim lda income, group(cases)
Linear discriminant analysis
Resubstitution classification summary

    +---------+
    | Key     |
    |---------|
    | Number  |
    | Percent |
    +---------+
                 | Classified
    True cases   |    normal  depressed |     Total
    -------------+----------------------+----------
          normal |       121        123 |       244
                 |     49.59      50.41 |    100.00
                 |                      |
       depressed |        19         31 |        50
                 |     38.00      62.00 |    100.00
    -------------+----------------------+----------
           Total |       140        154 |       294
                 |     47.62      52.38 |    100.00
                 |                      |
          Priors |    0.5000     0.5000 |
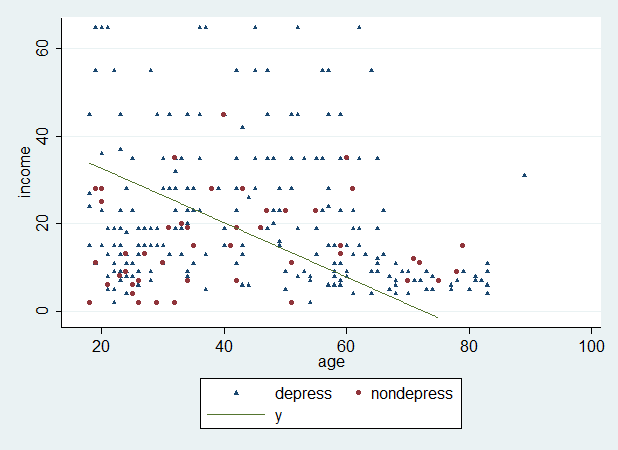
Figure 11.5, page 248.
NOTE: Please note that no carriage returns are used when issuing this command in Stata. For an explanation of the options used, please consult the Stata 8 Graphics manual.
graph twoway scatter income age if cases==0, sym(T) msize(.7) || scatter income age if cases==1,sym(o) || ///
  function y = (1.515 - .0209*x)/.0336, range(18 75) xscale(range(15 90)) yscale(range(0 65)) ///
  xtitle(age) ytitle(income) legend(order(1 2 3) label(1 "depress") label(2 "nondepress"))
Table 11.3, page 249.
discrim lda age income, group(cases)
Linear discriminant analysis
Resubstitution classification summary

    +---------+
    | Key     |
    |---------|
    | Number  |
    | Percent |
    +---------+
                 | Classified
    True cases   |    normal  depressed |     Total
    -------------+----------------------+----------
          normal |       154         90 |       244
                 |     63.11      36.89 |    100.00
                 |                      |
       depressed |        20         30 |        50
                 |     40.00      60.00 |    100.00
    -------------+----------------------+----------
           Total |       174        120 |       294
                 |     59.18      40.82 |    100.00
                 |                      |
          Priors |    0.5000     0.5000 |
Table 11.4, page 253.
estat classfunctions
Classification functions

                 | cases
                 |    normal  depressed
    -------------+----------------------
             age |  .1634185   .1424865
          income |  .1360265   .1024207
           _cons | -5.170944    -3.6552
    -------------+----------------------
          Priors |        .5         .5

di el(r(C), 1, 1) - el(r(C), 1, 2)
.02093196
di el(r(C), 2, 1) - el(r(C), 2, 2)
.03360582
Page 254. Covariances at the bottom of the page.
corr age income, cov

(obs=294)

             |      age   income
-------------+------------------
         age |  327.083
      income | -53.0073  233.788
Page 261 top of the page.
discrim cases income age
[output omitted]

estat canontest
Canonical linear discriminant analysis

      |                                 | Like-
      | Canon.   Eigen-     Variance    | lihood
  Fcn | Corr.    value   Prop.   Cumul. | Ratio     F      df1    df2  Prob>F
  ----+---------------------------------+------------------------------------
    1 | 0.2084  .045391  1.0000  1.0000 | 0.9566  6.6044     2    291  0.0016 e
  ---------------------------------------------------------------------------
  Ho: this and smaller canon. corr. are zero;                     e = exact F
Page 261. Middle of the page.
NOTE: The reduced model used only income, and the output from that is shown below. The rest of the numbers used in the calculations are from page 259 above.
discrim lda income, group(cases)
Linear discriminant analysis
Resubstitution classification summary

    +---------+
    | Key     |
    |---------|
    | Number  |
    | Percent |
    +---------+
                 | Classified
    True cases   |    normal  depressed |     Total
    -------------+----------------------+----------
          normal |       121        123 |       244
                 |     49.59      50.41 |    100.00
                 |                      |
       depressed |        19         31 |        50
                 |     38.00      62.00 |    100.00
    -------------+----------------------+----------
           Total |       140        154 |       294
                 |     47.62      52.38 |    100.00
                 |                      |
          Priors |    0.5000     0.5000 |
estat classfunction
Classification functions

                 | cases
                 |    normal  depressed
    -------------+----------------------
          income |    .09481   .0664835
           _cons | -1.027561  -.5052746
    -------------+----------------------
          Priors |        .5         .5
estat canontest
Canonical linear discriminant analysis

      |                                 | Like-
      | Canon.   Eigen-     Variance    | lihood
  Fcn | Corr.    value   Prop.   Cumul. | Ratio     F      df1    df2  Prob>F
  ----+---------------------------------+------------------------------------
    1 | 0.1594   .02607  1.0000  1.0000 | 0.9746  7.6125     1    292  0.0062 e
  ---------------------------------------------------------------------------
  Ho: this and smaller canon. corr. are zero;                     e = exact F

