Table 12.1, page 273.
use https://stats.idre.ucla.edu/stat/stata/examples/pma5/depress, clear
tab sex cases

           | depressed is cesd >=16
           |
       sex |    normal  depressed |     Total
-----------+----------------------+----------
      male |       101         10 |       111
    female |       143         40 |       183
-----------+----------------------+----------
     Total |       244         50 |       294
Page 274. The odds ratios at the top of the page.
logit cases i.sex, or
Iteration 0:   log likelihood = -134.06225
Iteration 1:   log likelihood = -129.82684
Iteration 2:   log likelihood = -129.69892
Iteration 3:   log likelihood = -129.69883
Iteration 4:   log likelihood = -129.69883

Logistic regression                               Number of obs   =        294
                                                  LR chi2(1)      =       8.73
                                                  Prob > chi2     =     0.0031
Log likelihood = -129.69883                       Pseudo R2       =     0.0325

------------------------------------------------------------------------------
       cases | Odds Ratio   Std. Err.      z    P>|z|     [95% Conf. Interval]
-------------+----------------------------------------------------------------
       2.sex |   2.825175    1.06421     2.76   0.006      1.35023    5.911299
       _cons |   .0990099   .0328231    -6.98   0.000     .0517004    .1896108
------------------------------------------------------------------------------
logit cases i.sex
Iteration 0:   log likelihood = -134.06225
Iteration 1:   log likelihood = -129.82684
Iteration 2:   log likelihood = -129.69892
Iteration 3:   log likelihood = -129.69883
Iteration 4:   log likelihood = -129.69883

Logistic regression                               Number of obs   =        294
                                                  LR chi2(1)      =       8.73
                                                  Prob > chi2     =     0.0031
Log likelihood = -129.69883                       Pseudo R2       =     0.0325

------------------------------------------------------------------------------
       cases |      Coef.   Std. Err.      z    P>|z|     [95% Conf. Interval]
-------------+----------------------------------------------------------------
       2.sex |    1.03857   .3766882     2.76   0.006     .3002749    1.776866
       _cons |  -2.312535   .3315132    -6.98   0.000    -2.962289   -1.662782
------------------------------------------------------------------------------
Page 275. Top of the page.
logit cases age income i.sex

Iteration 0:   log likelihood = -134.06225
Iteration 1:   log likelihood = -124.45941
Iteration 2:   log likelihood =  -123.7712
Iteration 3:   log likelihood = -123.76979
Iteration 4:   log likelihood = -123.76979

Logistic regression                               Number of obs   =        294
                                                  LR chi2(3)      =      20.58
                                                  Prob > chi2     =     0.0001
Log likelihood = -123.76979                       Pseudo R2       =     0.0768

------------------------------------------------------------------------------
       cases |      Coef.   Std. Err.      z    P>|z|     [95% Conf. Interval]
-------------+----------------------------------------------------------------
         age |  -.0209575   .0090401    -2.32   0.020    -.0386759   -.0032392
      income |  -.0365635   .0140897    -2.60   0.009    -.0641787   -.0089482
       2.sex |   .9294487   .3858256     2.41   0.016     .1732444    1.685653
       _cons |  -.6764559   .5788124    -1.17   0.243    -1.810907    .4579956
------------------------------------------------------------------------------
Page 275. The coefficients at the bottom of the page.
logit cases age income
Iteration 0:   log likelihood = -134.06225
Iteration 1:   log likelihood = -127.42024
Iteration 2:   log likelihood = -127.01794
Iteration 3:   log likelihood = -127.01305
Iteration 4:   log likelihood = -127.01304

Logit estimates                                   Number of obs   =        294
                                                  LR chi2(2)      =      14.10
                                                  Prob > chi2     =     0.0009
Log likelihood = -127.01304                       Pseudo R2       =     0.0526

------------------------------------------------------------------------------
       cases |      Coef.   Std. Err.      z    P>|z|     [95% Conf. Interval]
-------------+----------------------------------------------------------------
         age |  -.0201671   .0088966    -2.27   0.023    -.0376041   -.0027301
      income |  -.0413479   .0140587    -2.94   0.003    -.0689025   -.0137933
       _cons |   .0279774   .4872007     0.06   0.954    -.9269184    .9828732
------------------------------------------------------------------------------
Page 276. Coefficients at the top.
logit cases age income

Iteration 0:   log likelihood = -134.06225
Iteration 1:   log likelihood = -127.42024
Iteration 2:   log likelihood = -127.01794
Iteration 3:   log likelihood = -127.01305
Iteration 4:   log likelihood = -127.01304

Logit estimates                                   Number of obs   =        294
                                                  LR chi2(2)      =      14.10
                                                  Prob > chi2     =     0.0009
Log likelihood = -127.01304                       Pseudo R2       =     0.0526

------------------------------------------------------------------------------
       cases |      Coef.   Std. Err.      z    P>|z|     [95% Conf. Interval]
-------------+----------------------------------------------------------------
         age |  -.0201671   .0088966    -2.27   0.023    -.0376041   -.0027301
      income |  -.0413479   .0140587    -2.94   0.003    -.0689025   -.0137933
       _cons |   .0279774   .4872007     0.06   0.954    -.9269184    .9828732
------------------------------------------------------------------------------
Page 277. These numbers are obtained from the output from page 276.
Page 278. Table at the top of the page.
gen duminc = income < 10
gen dumemp = employ == 2 | employ == 3
replace dumemp = . if employ == 7
logit cases duminc dumemp

Iteration 0:   log likelihood = -131.73021
Iteration 1:   log likelihood =  -127.6761
Iteration 2:   log likelihood = -127.42821
Iteration 3:   log likelihood = -127.42796
Iteration 4:   log likelihood = -127.42796

Logistic regression                               Number of obs   =        290
                                                  LR chi2(2)      =       8.60
                                                  Prob > chi2     =     0.0135
Log likelihood = -127.42796                       Pseudo R2       =     0.0327

------------------------------------------------------------------------------
       cases |      Coef.   Std. Err.      z    P>|z|     [95% Conf. Interval]
-------------+----------------------------------------------------------------
      duminc |   .2722943   .3376896     0.81   0.420    -.3895653    .9341538
      dumemp |   1.028483   .3487121     2.95   0.003     .3450196    1.711946
       _cons |  -1.934537   .2259083    -8.56   0.000    -2.377309   -1.491765
------------------------------------------------------------------------------
Page 279. Table in the middle of the page.
logit cases duminc##dumemp

Iteration 0:   log likelihood = -131.73021
Iteration 1:   log likelihood = -125.18993
Iteration 2:   log likelihood = -123.52872
Iteration 3:   log likelihood = -123.31292
Iteration 4:   log likelihood = -123.31287
Iteration 5:   log likelihood = -123.31287

Logistic regression                               Number of obs   =        290
                                                  LR chi2(3)      =      16.83
                                                  Prob > chi2     =     0.0008
Log likelihood = -123.31287                       Pseudo R2       =     0.0639

-------------------------------------------------------------------------------
        cases |      Coef.   Std. Err.      z    P>|z|     [95% Conf. Interval]
--------------+----------------------------------------------------------------
     1.duminc |  -.3756121   .4349381    -0.86   0.388    -1.228075    .4768508
     1.dumemp |    .317535   .4520206     0.70   0.482    -.5684091    1.203479
              |
duminc#dumemp |
         1 1  |   2.198143   .7888295     2.79   0.005     .6520659    3.744221
              |
        _cons |  -1.734601   .2214037    -7.83   0.000    -2.168544   -1.300658
-------------------------------------------------------------------------------
Page 280
di 2.198143/.7888294
2.7865886

di (2.7865886)^2
7.765076


* for likelihood ratio chi square
logit cases duminc dumemp

Iteration 0:   log likelihood = -131.73021
Iteration 1:   log likelihood =  -127.6761
Iteration 2:   log likelihood = -127.42821
Iteration 3:   log likelihood = -127.42796
Logit estimates                                   Number of obs   =        290
                                                  LR chi2(2)      =       8.60
                                                  Prob > chi2     =     0.0135
Log likelihood = -127.42796                       Pseudo R2       =     0.0327
------------------------------------------------------------------------------
       cases |      Coef.   Std. Err.      z    P>|z|     [95% Conf. Interval]
-------------+----------------------------------------------------------------
      duminc |   .2722943   .3376895     0.81   0.420    -.3895651    .9341536
      dumemp |   1.028483   .3487117     2.95   0.003     .3450204    1.711945
       _cons |  -1.934537   .2259083    -8.56   0.000    -2.377309   -1.491765
------------------------------------------------------------------------------

di 16.83-8.6
8.23
Page 287. Middle of the page.
egen cage = cut(age), at(0, 28, 43, 59, 90)
logit cases i.cage income sex

Iteration 0:   log likelihood = -134.06225
Iteration 1:   log likelihood = -124.32078
Iteration 2:   log likelihood =  -123.5791
Iteration 3:   log likelihood = -123.57661
Iteration 4:   log likelihood = -123.57661

Logistic regression                               Number of obs   =        294
                                                  LR chi2(5)      =      20.97
                                                  Prob > chi2     =     0.0008
Log likelihood = -123.57661                       Pseudo R2       =     0.0782

------------------------------------------------------------------------------
       cases |      Coef.   Std. Err.      z    P>|z|     [95% Conf. Interval]
-------------+----------------------------------------------------------------
        cage |
         28  |   .0747259   .4318019     0.17   0.863    -.7715902    .9210421
         43  |  -.5706276   .4743977    -1.20   0.229     -1.50043    .3591748
         59  |  -.8853103    .456306    -1.94   0.052    -1.779654    .0090329
             |
      income |  -.0379521    .014852    -2.56   0.011    -.0670616   -.0088426
         sex |   .9238035   .3864416     2.39   0.017     .1663918    1.681215
       _cons |  -2.159495   .7830425    -2.76   0.006     -3.69423     -.62476
------------------------------------------------------------------------------
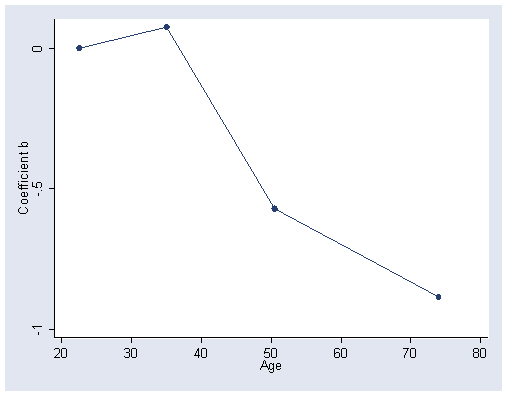
Figure 12.2, page 289.
gen female = (sex == 2)
logit cases i.cage income female
matrix b = e(b)
gen b0 = 0 in 1
svmat b
list b0 - b6 in 1

* The point of the next two commands is to drop all of the
* unnecessary variables and observations.  You may need to
* modify the variable names on the drop command to match
* your variables.


drop sex - b1 b6 b7
keep in 1
reshape long b, i(id)
list
gen newage = 22.5
replace newage = 35 if _j == 2
replace newage = 50.5 if _j == 3
replace newage = 74 if _j == 4
sort newage

* You need to calculate the midpoint of each interval based on the
* table on page 287.  The minimum of age is 18.
graph twoway scatter b newage in 1/4, msymbol(O) connect(L) ylabel(-1(.5)0, nogrid) ///
        ytitle(Coefficient b) xlabel(20(10)80) xtitle(Age)
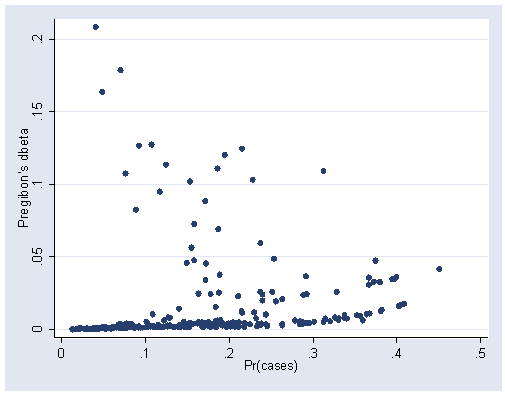
Figure 12.3, page 291.
use https://stats.idre.ucla.edu/stat/stata/examples/pma5/depress, clear

logit cases sex income age
predict p
predict db, db
graph twoway scatter db p
Table 12.2, page 292.
logit cases age income sex

Iteration 0:   log likelihood = -134.06225
Iteration 1:   log likelihood = -124.45941
Iteration 2:   log likelihood = -123.78013
Iteration 3:   log likelihood = -123.76979
Iteration 4:   log likelihood = -123.76979
Logit estimates                                   Number of obs   =        294
                                                  LR chi2(3)      =      20.58
                                                  Prob > chi2     =     0.0001
Log likelihood = -123.76979                       Pseudo R2       =     0.0768
------------------------------------------------------------------------------
       cases |      Coef.   Std. Err.      z    P>|z|     [95% Conf. Interval]
-------------+----------------------------------------------------------------
         age |  -.0209575   .0090401    -2.32   0.020    -.0386758   -.0032392
      income |  -.0365635   .0140897    -2.60   0.009    -.0641787   -.0089482
         sex |   .9294487   .3858256     2.41   0.016     .1732444    1.685653
       _cons |  -1.605905   .8465372    -1.90   0.058    -3.265087    .0532779
------------------------------------------------------------------------------

list db in -4/l

     +----------+
     |       db |
     |----------|
291. | .0004829 |
292. | .0001442 |
293. | .0006498 |
294. | .0111896 |
     +----------+

gen x = 0
replace x = 3 if db > .1637310
(5 real changes made)
replace x = 2 if db > .1789604
(4 real changes made)
replace x = 1 if db > .2084397
(3 real changes made)

logit cases age income sex if x ~= 1

Iteration 0:   log likelihood = -131.91495
Iteration 1:   log likelihood = -121.29438
Iteration 2:   log likelihood = -120.39934
Iteration 3:   log likelihood =  -120.3796
Iteration 4:   log likelihood = -120.37958
Logit estimates                                   Number of obs   =        291
                                                  LR chi2(3)      =      23.07
                                                  Prob > chi2     =     0.0000
Log likelihood = -120.37958                       Pseudo R2       =     0.0874
------------------------------------------------------------------------------
       cases |      Coef.   Std. Err.      z    P>|z|     [95% Conf. Interval]
-------------+----------------------------------------------------------------
         age |  -.0215037   .0091147    -2.36   0.018    -.0393683   -.0036391
      income |  -.0416866   .0149928    -2.78   0.005     -.071072   -.0123013
         sex |   1.022995   .4007114     2.55   0.011     .2376152    1.808375
       _cons |  -1.692541   .8721181    -1.94   0.052    -3.401861     .016779
------------------------------------------------------------------------------

logit cases age income sex if x ~= 2

Iteration 0:   log likelihood = -132.28233
Iteration 1:   log likelihood = -121.82603
Iteration 2:   log likelihood = -121.03222
Iteration 3:   log likelihood = -121.01885
Iteration 4:   log likelihood = -121.01885
Logit estimates                                   Number of obs   =        293
                                                  LR chi2(3)      =      22.53
                                                  Prob > chi2     =     0.0001
Log likelihood = -121.01885                       Pseudo R2       =     0.0851
------------------------------------------------------------------------------
       cases |      Coef.   Std. Err.      z    P>|z|     [95% Conf. Interval]
-------------+----------------------------------------------------------------
         age |   -.023414   .0092536    -2.53   0.011    -.0415507   -.0052774
      income |  -.0357778   .0141515    -2.53   0.011    -.0635142   -.0080415
         sex |   1.050539   .4007857     2.62   0.009     .2650138    1.836065
       _cons |  -1.756961    .871175    -2.02   0.044    -3.464433   -.0494895
------------------------------------------------------------------------------

logit cases age income sex if x ~= 3

Iteration 0:   log likelihood = -132.28233
Iteration 1:   log likelihood = -121.54471
Iteration 2:   log likelihood = -120.67498
Iteration 3:   log likelihood = -120.65779
Iteration 4:   log likelihood = -120.65778
Logit estimates                                   Number of obs   =        293
                                                  LR chi2(3)      =      23.25
                                                  Prob > chi2     =     0.0000
Log likelihood = -120.65778                       Pseudo R2       =     0.0879
------------------------------------------------------------------------------
       cases |      Coef.   Std. Err.      z    P>|z|     [95% Conf. Interval]
-------------+----------------------------------------------------------------
         age |  -.0228888   .0092002    -2.49   0.013    -.0409209   -.0048567
      income |  -.0389067   .0145405    -2.68   0.007    -.0674056   -.0104078
         sex |    1.04192   .4008515     2.60   0.009     .2562651    1.827574
       _cons |   -1.71381   .8720871    -1.97   0.049    -3.423069   -.0045506
------------------------------------------------------------------------------

logit cases age income sex if x == 0

Iteration 0:   log likelihood = -128.31745
Iteration 1:   log likelihood = -115.44875
Iteration 2:   log likelihood =  -114.1166
Iteration 3:   log likelihood =   -114.074
Iteration 4:   log likelihood = -114.07392
Logit estimates                                   Number of obs   =        289
                                                  LR chi2(3)      =      28.49
                                                  Prob > chi2     =     0.0000
Log likelihood = -114.07392                       Pseudo R2       =     0.1110
------------------------------------------------------------------------------
       cases |      Coef.   Std. Err.      z    P>|z|     [95% Conf. Interval]
-------------+----------------------------------------------------------------
         age |  -.0262663   .0095311    -2.76   0.006    -.0449469   -.0075856
      income |  -.0439743    .015642    -2.81   0.005     -.074632   -.0133166
         sex |    1.30267   .4406845     2.96   0.003     .4389443    2.166396
       _cons |  -2.018118   .9403468    -2.15   0.032    -3.861163   -.1750718
------------------------------------------------------------------------------
Table 12.3, page 293.
list age income sex cases p if id == 288 | id==99 | id==143 | id == 232 | id == 68

     +---------------------------------------+
     | age   income   sex   cases          p |
     |---------------------------------------|
 68. |  40       45     1       1   .0406946 |
 99. |  72       11     1       1    .069941 |
143. |  40       45     1       0   .0406946 |
232. |  40       45     1       0   .0406946 |
288. |  61       28     1       1   .0484001 |
     +---------------------------------------+
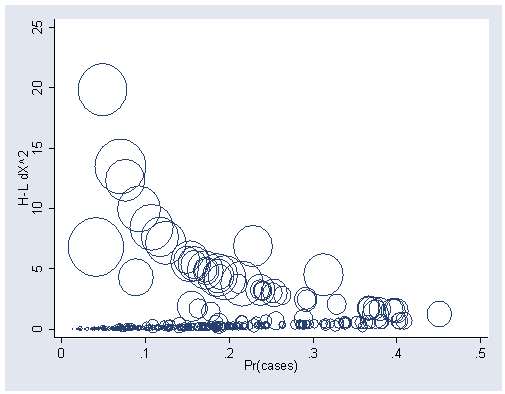
Figure 12.4, page 294.
logit cases sex income age

Iteration 0:   log likelihood = -134.06225
Iteration 1:   log likelihood = -124.45941
Iteration 2:   log likelihood = -123.78013
Iteration 3:   log likelihood = -123.76979
Iteration 4:   log likelihood = -123.76979
Logit estimates                                   Number of obs   =        294
                                                  LR chi2(3)      =      20.58
                                                  Prob > chi2     =     0.0001
Log likelihood = -123.76979                       Pseudo R2       =     0.0768
------------------------------------------------------------------------------
       cases |      Coef.   Std. Err.      z    P>|z|     [95% Conf. Interval]
-------------+----------------------------------------------------------------
         sex |   .9294487   .3858256     2.41   0.016     .1732444    1.685653
      income |  -.0365635   .0140897    -2.60   0.009    -.0641787   -.0089482
         age |  -.0209575   .0090401    -2.32   0.020    -.0386758   -.0032392
       _cons |  -1.605905   .8465372    -1.90   0.058    -3.265087    .0532779
------------------------------------------------------------------------------

predict dx2, dx2
graph twoway scatter dx2 p [w = db], msymbol(Oh) ylabel(0(5)25, nogrid) xlabel(0(.1).5)
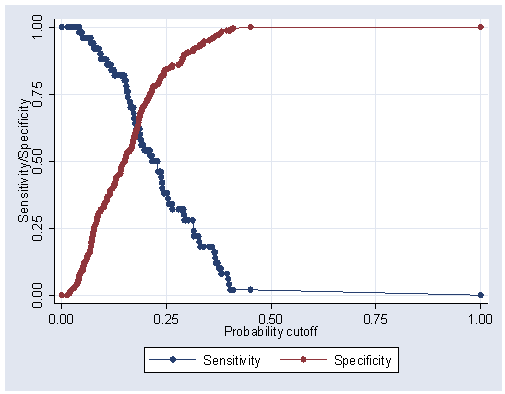
Figure 12.5, page 296.
lsens
Figure 12.6, page 297.
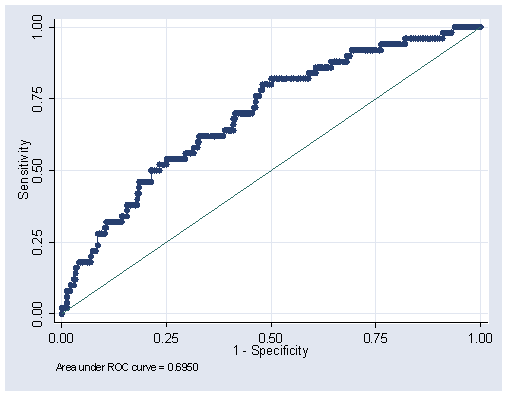
lroc

