Table 14.2, page 369.
NOTE: The values shown in the text are listed as eigenvectors in the Stata output.
use https://stats.idre.ucla.edu/stat/stata/examples/pma5/depress, clear

pca c1-c20, factors(5)
Principal components/correlation                  Number of obs    =       294
                                                  Number of comp.  =         5
                                                  Trace            =        20
    Rotation: (unrotated = principal)             Rho              =    0.5925

    --------------------------------------------------------------------------
       Component |   Eigenvalue   Difference         Proportion   Cumulative
    -------------+------------------------------------------------------------
           Comp1 |      7.05542      5.56985             0.3528       0.3528
           Comp2 |      1.48557       .25406             0.0743       0.4270
           Comp3 |      1.23151      .165825             0.0616       0.4886
           Comp4 |      1.06569     .0530524             0.0533       0.5419
           Comp5 |      1.01263     .0451719             0.0506       0.5925
           Comp6 |      .967461     .0206444             0.0484       0.6409
           Comp7 |      .946816      .177579             0.0473       0.6883
           Comp8 |      .769238     .0746006             0.0385       0.7267
           Comp9 |      .694637     .0345101             0.0347       0.7614
          Comp10 |      .660127     .0524914             0.0330       0.7945
          Comp11 |      .607635     .0582981             0.0304       0.8248
          Comp12 |      .549337     .0127038             0.0275       0.8523
          Comp13 |      .536634      .027916             0.0268       0.8791
          Comp14 |      .508718      .057815             0.0254       0.9046
          Comp15 |      .450903     .0757216             0.0225       0.9271
          Comp16 |      .375181     .0539966             0.0188       0.9459
          Comp17 |      .321184     .0266216             0.0161       0.9619
          Comp18 |      .294563     .0261883             0.0147       0.9767
          Comp19 |      .268374     .0699963             0.0134       0.9901
          Comp20 |      .198378            .             0.0099       1.0000
    --------------------------------------------------------------------------

Principal components (eigenvectors)

    ------------------------------------------------------------------------------
        Variable |    Comp1     Comp2     Comp3     Comp4     Comp5 | Unexplained
    -------------+--------------------------------------------------+-------------
              c1 |   0.2774   -0.1450   -0.0577    0.0027   -0.0883 |       .4137
              c2 |   0.3132    0.0271   -0.0316   -0.2478   -0.0244 |       .2396
              c3 |   0.2678   -0.1547   -0.0346   -0.2472    0.2183 |       .3436
              c4 |   0.2436   -0.3194   -0.1769    0.0716    0.1729 |       .3556
              c5 |   0.2868   -0.0497   -0.1384   -0.2794    0.0411 |       .3076
              c6 |   0.2206    0.0534   -0.2242   -0.1823    0.3399 |       .4382
              c7 |   0.2844   -0.1644    0.0190    0.0761    0.0870 |       .3751
              c8 |   0.1081   -0.3045   -0.1103    0.5567    0.0976 |       .4249
              c9 |   0.1758   -0.1690    0.3962    0.0146   -0.5355 |       .2556
             c10 |   0.2766   -0.0454    0.0835   -0.0084   -0.3651 |       .3134
             c11 |   0.2433   -0.1048    0.1314   -0.0414   -0.2419 |       .4838
             c12 |   0.1790    0.2300   -0.1634   -0.1451   -0.0368 |       .6386
             c13 |   0.1259    0.2126   -0.2645    0.5400   -0.0953 |       .4148
             c14 |   0.1803    0.4015    0.1014    0.2461    0.0847 |       .4468
             c15 |   0.2004    0.2098   -0.2703   -0.0312   -0.0834 |       .5533
             c16 |   0.1924    0.4174    0.1850    0.0467    0.0399 |       .4338
             c17 |   0.2097    0.3905    0.0860    0.0684    0.0499 |       .4467
             c18 |   0.1717    0.0153   -0.2019    0.0629   -0.2752 |       .6605
             c19 |   0.1315    0.0569    0.6326    0.0232    0.3349 |       .2662
             c20 |   0.2357   -0.2283    0.1933    0.2404    0.2909 |       .3373
    ------------------------------------------------------------------------------
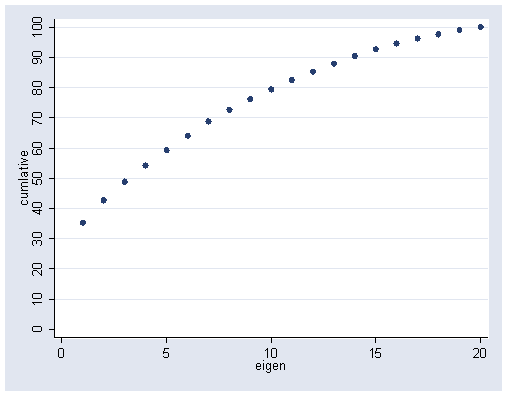
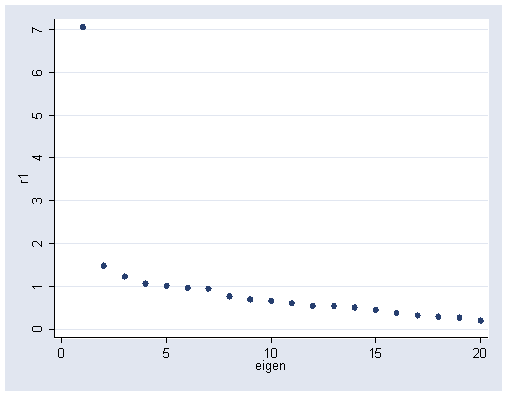
Figure 14.5, page 368.
Panel A:
matrix E1 = e(Ev)
matrix E2 = E1'
svmat E2, name(col)
gen eigen = _n if r1 != .
gen c = sum(r1) if r1 != .
gen cumlative = (c/20)*100
graph twoway scatter cumlative eigen, ylabel(0(10)100)
Panel B:
NOTE: The following graph can easily be reproduced using the greigen command, however, the greigen command only uses the first 13 eigenvalues.
graph twoway scatter r1 eigen, ylabel(0(1)7)


