use https://stats.idre.ucla.edu/stat/stata/examples/rwg/concord1, clear
(Hamilton (1983))
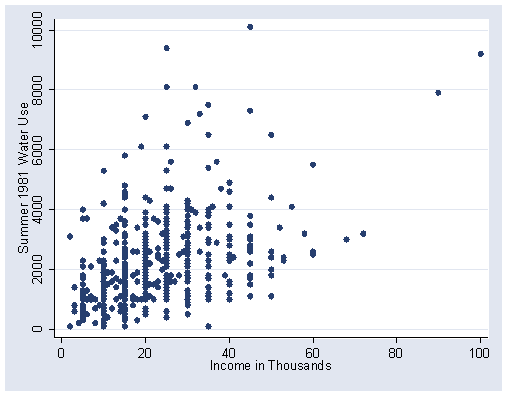
Figure 2.3, page 35.
graph twoway scatter water81 income, xlabel(0(20)100) ylabel(0(2000)10000)
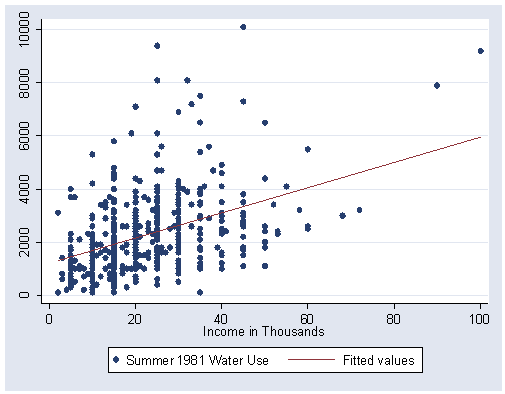
Figure 2.4, page 35.
graph twoway (scatter water81 income) (lfit water81 income), ///
	xlabel(0(20)100) ylabel(0(2000)10000)
Compute the regression of water81 using income as the predictor. The model estimates on page 36 are displayed. Note that the residual standard deviation is listed as the Root MSE in the output.
regress water81 income

  Source |       SS       df       MS                  Number of obs =     496
---------+------------------------------               F(  1,   494) =  104.46
   Model |   190820566     1   190820566               Prob > F      =  0.0000
Residual |   902418143   494  1826757.38               R-squared     =  0.1745
---------+------------------------------               Adj R-squared =  0.1729
   Total |  1.0932e+09   495  2208563.05               Root MSE      =  1351.6

------------------------------------------------------------------------------
 water81 |      Coef.   Std. Err.       t     P>|t|       [95% Conf. Interval]
---------+--------------------------------------------------------------------
  income |   47.54869   4.652286     10.221   0.000       38.40798     56.6894
   _cons |   1201.124   123.3245      9.740   0.000       958.8191     1443.43
------------------------------------------------------------------------------
Obtain the predicted values of water81, naming this variable pw81.
predict pw81
(option xb assumed; fitted values)
Obtain the residuals, naming this variable rw81.
predict rw81, resid
Use summarize to obtain the standard deviations of water81 and income on page 40. The regression coefficients and other regression estimates in this section were output previously using the regress command.
summarize income water81

Variable |     Obs        Mean   Std. Dev.       Min        Max
---------+-----------------------------------------------------
  income |     496    23.07661   13.05784          2        100
 water81 |     496    2298.387   1486.123        100      10100
The estimates and test statistics in this section were obtained previously with the regress command.
Figure 2.7, page 48. Graph the scatterplot with the 99% confidence and prediction bands. This graph was constructed by overlaying four separate graphs, a scatter plot (scatter water81 income), regression line (lfit water81 income), the confidence interval for the regression line (lfitci water81 income), and the prediction interval (lfitci water81 income, stdf ).
graph twoway (scatter water81 income) (lfit water81 income) ///
	       (lfitci water81 income, level(99)  clcolor(blue)  ciplot(rline)) ///
	       (lfitci water81 income, level(99) stdf ciplot(rline)), ///
               xlabel(0 23 100) ylabel(0 10000, nogrid)
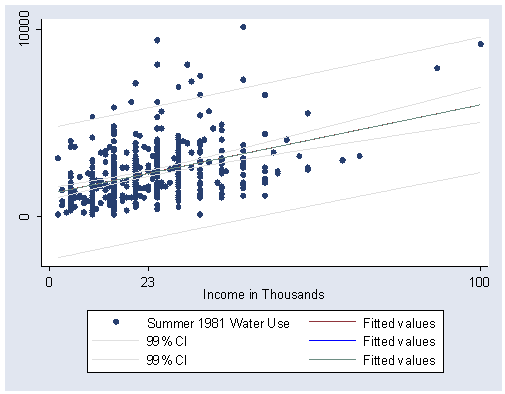
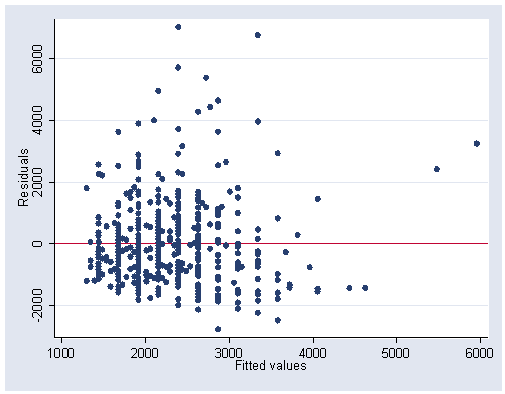
Figure 2.9, page 52.
rvfplot, yline(0) xlabel(1000(1000)6000) ylabel(-2000(2000)6000)
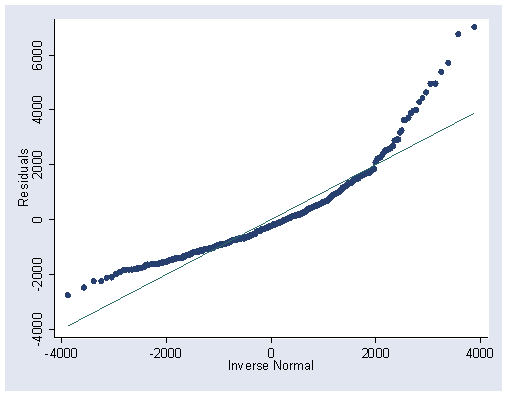
Figure 2.12, page 54.
qnorm rw81, xlab(-4000(2000)4000) ylab(-4000(2000)6000)
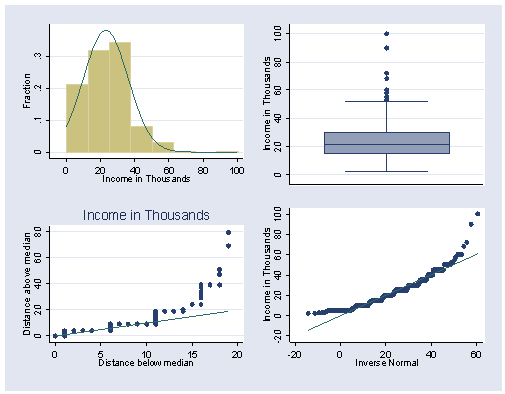
Figure 2.13, page 54. First graph and save the individual plots then graph them together.
histogram income, nodraw normal fraction bin(8) start(0) xlabel(0(20)100) ylabel(0(.1).3) saving(f2_13a,replace)
graph box income, nodraw ylabel(0(20)100) saving(f2_13b,replace)
symplot income, nodraw xlabel(0(5)20) ylabel(0(20)80) saving(f2_13c,replace)
qnorm income, nodraw xlabel(-20(20)60) ylabel(-20(20)100) saving(f2_13d,replace)

graph combine f2_13a.gph f2_13b.gph f2_13c.gph f2_13d.gph
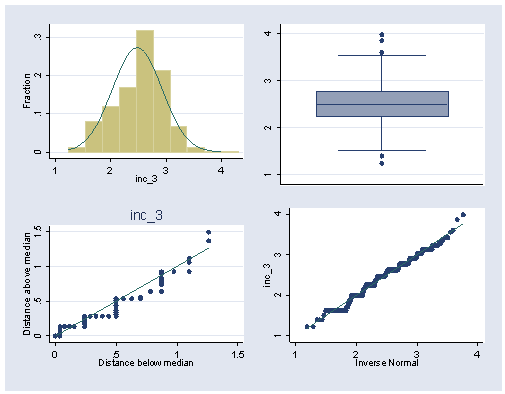
Figure 2.14, page 55. This is done the same way as figure 2.13 after we generate inc_3 which is income to the .3 power.
gen inc_3 = income^.3

histogram inc_3, nodraw fraction normal bin(9) xlabel(1(1)4) ylabel(0(.1).3) saving(f2_14a,replace)
graph box inc_3, nodraw ylabel(1(1)4) saving(f2_14b,replace)
symplot inc_3, nodraw xlabel(0(.5)1.5) ylabel(0(.5)1.5) saving(f2_14c,replace)
qnorm inc_3, xlabel(1(1)4) ylabel(1(1)4) saving(f2_14d,replace)
graph combine f2_14a.gph f2_14b.gph f2_14c.gph f2_14d.gph
Table 2.3, page 55. Generate water81 to the .3 power and regress with the transformed income variable as a predictor.
gen wtr81_3 = water81^.3
regress wtr81_3 inc_3

  Source |       SS       df       MS                  Number of obs =     496
---------+------------------------------               F(  1,   494) =  126.22
   Model |  370.337058     1  370.337058               Prob > F      =  0.0000
Residual |  1449.41668   494  2.93404187               R-squared     =  0.2035
---------+------------------------------               Adj R-squared =  0.2019
   Total |  1819.75374   495  3.67627019               Root MSE      =  1.7129

------------------------------------------------------------------------------
 wtr81_3 |      Coef.   Std. Err.       t     P>|t|       [95% Conf. Interval]
---------+--------------------------------------------------------------------
   inc_3 |   1.934535   .1721913     11.235   0.000       1.596217    2.272853
   _cons |   4.989011   .4330577     11.520   0.000       4.138149    5.839873
------------------------------------------------------------------------------
Compute the mean values in Table 2.3, page 55.
summ wtr81_3 inc_3

Variable |     Obs        Mean   Std. Dev.       Min        Max
---------+-----------------------------------------------------
 wtr81_3 |     496    9.776982    1.91736   3.981072   15.89631
   inc_3 |     496    2.474998   .4471152   1.231144   3.981072
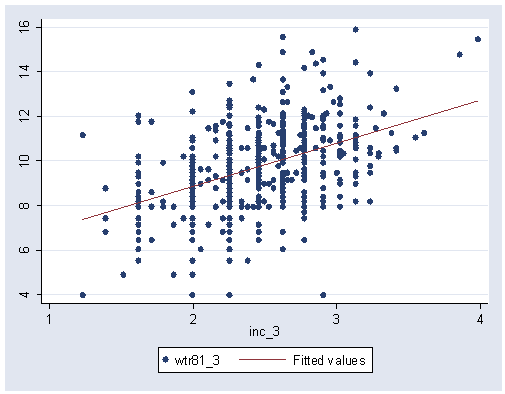
Figure 2.15, page 56.
graph twoway (scatter wtr81_3 inc_3) (lfit wtr81_3 inc_3), ylabel(4(2)16) xlabel(1(1)4)
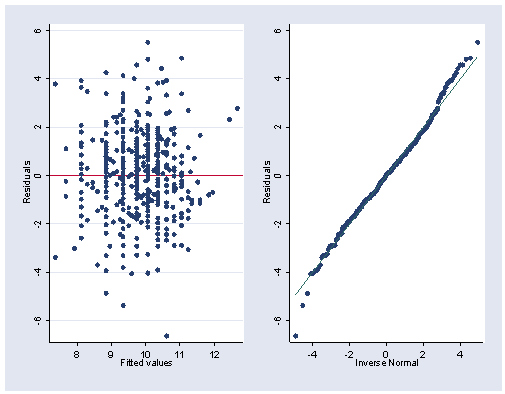
Figure 2.16, page 56. First obtain the predicted and residual values for the model with the transformed variables. Then graph and save the individual plots before graphing them together.
 predict pw81_3
. predict rw81_3, resid
. rvfplot, yline(0) xlab(8(1)12) ylab(-6(2)6) saving(f2_16a,replace)
qnorm rw81_3, xlab(-4(2)4) ylabel(-6(2)6) saving(f2_16b,replace)

graph combine f2_16a.gph f2_16b.gph
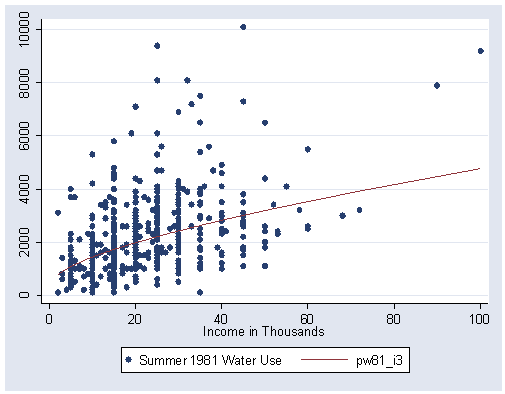
Figure 2.17, page 58. Generate pw81_i3, the inverse transformation of pw81_3 and graph it with income and water81. The sort option is needed to graph the curve properly.
gen pw81_i3 = pw81_3^(1/.3)

graph twoway (scatter water81 income) (line pw81_i3 income, sort)
Save the changes we made to concord1 so that we can use another dataset without losing the changes we made. The new data is named concord1b.
save concord1b, replace

use https://stats.idre.ucla.edu/stat/stata/examples/rwg/oilspill, clear
(Accidental Oil Spills 1973-85)
Regress oil loss on the number of spills.
regress lost spills

  Source |       SS       df       MS                  Number of obs =      13
---------+------------------------------               F(  1,    11) =    6.03
   Model |  167218.128     1  167218.128               Prob > F      =  0.0319
Residual |  304843.616    11   27713.056               R-squared     =  0.3542
---------+------------------------------               Adj R-squared =  0.2955
   Total |  472061.744    12  39338.4787               Root MSE      =  166.47

------------------------------------------------------------------------------
    lost |      Coef.   Std. Err.       t     P>|t|       [95% Conf. Interval]
---------+--------------------------------------------------------------------
  spills |   6.956853   2.832131      2.456   0.032       .7233746    13.19033
   _cons |  -44.48731   102.6833     -0.433   0.673      -270.4918    181.5172
------------------------------------------------------------------------------
Regress oil loss on number of spills through the origin, using the noconstant option.
regress lost spills, noconstant

  Source |       SS       df       MS                  Number of obs =      13
---------+------------------------------               F(  1,    12) =   22.72
   Model |   587004.77     1   587004.77               Prob > F      =  0.0005
Residual |  310045.453    12  25837.1211               R-squared     =  0.6544
---------+------------------------------               Adj R-squared =  0.6256
   Total |  897050.223    13  69003.8633               Root MSE      =  160.74

------------------------------------------------------------------------------
    lost |      Coef.   Std. Err.       t     P>|t|       [95% Conf. Interval]
---------+--------------------------------------------------------------------
  spills |   5.860875     1.2296      4.766   0.000       3.181808    8.539943
------------------------------------------------------------------------------
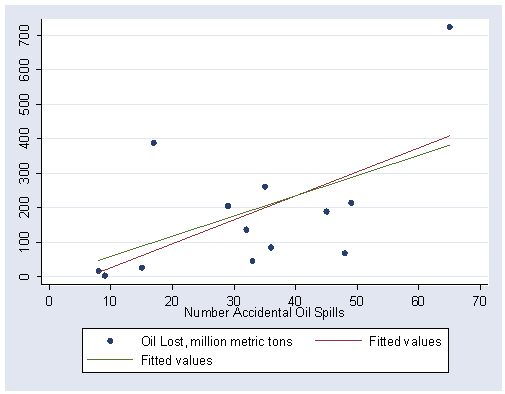
Figure 2.8, page 50.
graph twoway (scatter lost spills) (lfit lost spills) ///
	(lfit lost spills, estopts(noconstant)), ///
	ylabel(0(100)700) xlabel(0(10)70)
Save the changes made to a new dataset oilspill2.
save oilspill2

