Table 3.1, page 68.
use https://stats.idre.ucla.edu/stat/stata/examples/rwg/concord1, clear
(Hamilton (1983))
regress water81 income water80

  Source |       SS       df       MS                  Number of obs =     496
---------+------------------------------               F(  2,   493) =  391.76
   Model |   671025350     2   335512675               Prob > F      =  0.0000
Residual |   422213359   493  856416.551               R-squared     =  0.6138
---------+------------------------------               Adj R-squared =  0.6122
   Total |  1.0932e+09   495  2208563.05               Root MSE      =  925.43

------------------------------------------------------------------------------
 water81 |      Coef.   Std. Err.       t     P>|t|       [95% Conf. Interval]
---------+--------------------------------------------------------------------
  income |   20.54504    3.38341      6.072   0.000       13.89736    27.19272
 water80 |   .5931267   .0250482     23.679   0.000       .5439123    .6423411
   _cons |   203.8217   94.36129      2.160   0.031       18.42181    389.2216
------------------------------------------------------------------------------
The means in table 3.1 are obtained separately using summarize.
summarize water81 income water80

Variable |     Obs        Mean   Std. Dev.       Min        Max
---------+-----------------------------------------------------
 water81 |     496    2298.387   1486.123        100      10100
  income |     496    23.07661   13.05784          2        100
 water80 |     496    2732.056     1763.8        200      12700
Figure 3.1, page 70. First regress the partial model [3.10] and output the residuals using predict. We use the label command to label the residual variable.
regress water81 water80
predict ey_x2, resid
label variable ey_x2 "e y|x2"

  Source |       SS       df       MS                  Number of obs =     496
---------+------------------------------               F(  1,   494) =  696.11
   Model |   639446987     1   639446987               Prob > F      =  0.0000
Residual |   453791723   494  918606.727               R-squared     =  0.5849
---------+------------------------------               Adj R-squared =  0.5841
   Total |  1.0932e+09   495  2208563.05               Root MSE      =  958.44

------------------------------------------------------------------------------
 water81 |      Coef.   Std. Err.       t     P>|t|       [95% Conf. Interval]
---------+--------------------------------------------------------------------
 water80 |   .6443923   .0244238     26.384   0.000        .596405    .6923796
   _cons |    537.871   79.40114      6.774   0.000       381.8654    693.8766
------------------------------------------------------------------------------
Next regress partial model [3.11] then output and label the residual variable.
regress income water80
predict ex1_x2, resid
label variable ex1_x2 "e x1|x2"

  Source |       SS       df       MS                  Number of obs =     496
---------+------------------------------               F(  1,   494) =   63.31
   Model |   9588.3167     1   9588.3167               Prob > F      =  0.0000
Residual |   74812.772   494  151.442858               R-squared     =  0.1136
---------+------------------------------               Adj R-squared =  0.1118
   Total |  84401.0887   495   170.50725               Root MSE      =  12.306

------------------------------------------------------------------------------
  income |      Coef.   Std. Err.       t     P>|t|       [95% Conf. Interval]
---------+--------------------------------------------------------------------
 water80 |   .0024953   .0003136      7.957   0.000       .0018791    .0031114
   _cons |   16.25937   1.019498     15.948   0.000       14.25628    18.26245
------------------------------------------------------------------------------
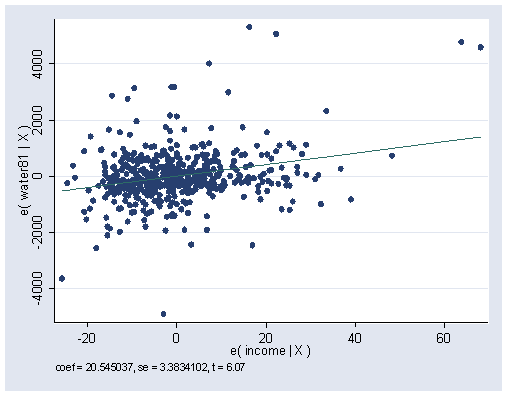
Figure 3.1, page 70. For the graph, we’ll run the full regression model and use the avplot command afterwards to get the plot.
quietly regress water81 income water80
avplot income, ylabel(-4000(2000)4000) xlabel(-20(20)60)
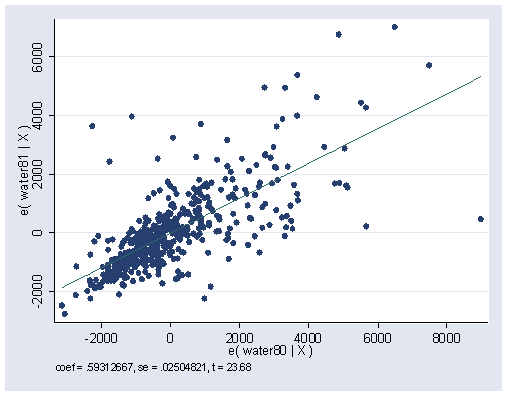
Figure 3.2, page 71.
avplot water80, ylabel(-2000(2000)6000) xlabel(-2000(2000)8000)
Table 3.2, page 74.
regress water81 income water80 educat retire peop81 cpeop

  Source |       SS       df       MS                  Number of obs =     496
---------+------------------------------               F(  6,   489) =  171.08
   Model |   740477522     6   123412920               Prob > F      =  0.0000
Residual |   352761188   489  721393.022               R-squared     =  0.6773
---------+------------------------------               Adj R-squared =  0.6734
   Total |  1.0932e+09   495  2208563.05               Root MSE      =  849.35

------------------------------------------------------------------------------
 water81 |      Coef.   Std. Err.       t     P>|t|       [95% Conf. Interval]
---------+--------------------------------------------------------------------
  income |   20.96699   3.463719      6.053   0.000       14.16138     27.7726
 water80 |     .49194   .0263478     18.671   0.000        .440171    .5437089
  educat |  -41.86552   13.22031     -3.167   0.002      -67.84114    -15.8899
  retire |   189.1843   95.02142      1.991   0.047       2.483674     375.885
  peop81 |    248.197    28.7248      8.641   0.000       191.7578    304.6363
   cpeop |    96.4536   80.51903      1.198   0.232      -61.75235    254.6596
   _cons |   242.2204   206.8638      1.171   0.242      -164.2312    648.6721
------------------------------------------------------------------------------

summ water81 income water80 educat retire peop81 cpeop

Variable |     Obs        Mean   Std. Dev.       Min        Max
---------+-----------------------------------------------------
 water81 |     496    2298.387   1486.123        100      10100
  income |     496    23.07661   13.05784          2        100
 water80 |     496    2732.056     1763.8        200      12700
  educat |     496    14.00403    3.09055          6         20
  retire |     496    .2943548   .4562123          0          1
  peop81 |     496    3.072581   1.657177          1         10
   cpeop |     496   -.0383065   .4846579         -3          3
Use the beta option to get the standardized regression coefficients.
regress water81 income water80 educat retire peop81 cpeop, beta

  Source |       SS       df       MS                  Number of obs =     496
---------+------------------------------               F(  6,   489) =  171.08
   Model |   740477522     6   123412920               Prob > F      =  0.0000
Residual |   352761188   489  721393.022               R-squared     =  0.6773
---------+------------------------------               Adj R-squared =  0.6734
   Total |  1.0932e+09   495  2208563.05               Root MSE      =  849.35

------------------------------------------------------------------------------
 water81 |      Coef.   Std. Err.       t     P>|t|                       Beta
---------+--------------------------------------------------------------------
  income |   20.96699   3.463719      6.053   0.000                   .1842267
 water80 |     .49194   .0263478     18.671   0.000                   .5838571
  educat |  -41.86552   13.22031     -3.167   0.002                  -.0870637
  retire |   189.1843   95.02142      1.991   0.047                   .0580761
  peop81 |    248.197    28.7248      8.641   0.000                   .2767647
   cpeop |    96.4536   80.51903      1.198   0.232                   .0314557
   _cons |   242.2204   206.8638      1.171   0.242                          .
------------------------------------------------------------------------------
Use the level option to change the significance to 90%. The default is 95%.
regress water81 income water80 educat retire peop81 cpeop, level(90)

  Source |       SS       df       MS                  Number of obs =     496
---------+------------------------------               F(  6,   489) =  171.08
   Model |   740477522     6   123412920               Prob > F      =  0.0000
Residual |   352761188   489  721393.022               R-squared     =  0.6773
---------+------------------------------               Adj R-squared =  0.6734
   Total |  1.0932e+09   495  2208563.05               Root MSE      =  849.35

------------------------------------------------------------------------------
 water81 |      Coef.   Std. Err.       t     P>|t|       [90% Conf. Interval]
---------+--------------------------------------------------------------------
  income |   20.96699   3.463719      6.053   0.000       15.25887    26.67512
 water80 |     .49194   .0263478     18.671   0.000       .4485193    .5353606
  educat |  -41.86552   13.22031     -3.167   0.002      -63.65226   -20.07877
  retire |   189.1843   95.02142      1.991   0.047       32.59134    345.7773
  peop81 |    248.197    28.7248      8.641   0.000       200.8592    295.5348
   cpeop |    96.4536   80.51903      1.198   0.232      -36.23979     229.147
   _cons |   242.2204   206.8638      1.171   0.242      -98.68612     583.127
------------------------------------------------------------------------------
Table 3.3, page 80.
summ water81 water80 peop81 cpeop retire

Variable |     Obs        Mean   Std. Dev.       Min        Max
---------+-----------------------------------------------------
 water81 |     496    2298.387   1486.123        100      10100
 water80 |     496    2732.056     1763.8        200      12700
  peop81 |     496    3.072581   1.657177          1         10
   cpeop |     496   -.0383065   .4846579         -3          3
  retire |     496    .2943548   .4562123          0          1
regress water81 water80 peop81 cpeop retire

  Source |       SS       df       MS                  Number of obs =     496
---------+------------------------------               F(  4,   491) =  229.91
   Model |   712718346     4   178179587               Prob > F      =  0.0000
Residual |   380520363   491  774990.557               R-squared     =  0.6519
---------+------------------------------               Adj R-squared =  0.6491
   Total |  1.0932e+09   495  2208563.05               Root MSE      =  880.34

------------------------------------------------------------------------------
 water81 |      Coef.   Std. Err.       t     P>|t|       [95% Conf. Interval]
---------+--------------------------------------------------------------------
 water80 |    .519741    .026774     19.412   0.000       .4671352    .5723468
  peop81 |   265.2894   29.63234      8.953   0.000       207.0675    323.5112
   cpeop |   134.4626    83.1959      1.616   0.107      -29.00135    297.9265
  retire |   67.27992   94.28846      0.714   0.476      -117.9787    252.5386
   _cons |   48.64897   107.0549      0.454   0.650      -161.6932    258.9912
------------------------------------------------------------------------------
To obtain the F-statistic and its corresponding p-value at the top of page 61, first regress the full model with income and educat (quietly suppresses the output). Then use the test statement to test the simpler model which doesn’t have income and educat.
quietly regress water81 water80 peop81 cpeop retire income educat
test income educat

 ( 1)  income = 0.0
 ( 2)  educat = 0.0

       F(  2,   489) =   19.24
            Prob > F =    0.0000
To obtain the estimates on page 86, first use the wells dataset and generate the natural log of chlor. Then summarize this new ln_chlor variable with and without a condition on deep.
use wells, clear
(Lee, NH well test data)

gen ln_chlor = log(chlor)
(1 missing value generated)

label variable ln_chlor "Natural Log of Chloride Concen"

summarize ln_chlor if deep==0

Variable |     Obs        Mean   Std. Dev.       Min        Max
---------+-----------------------------------------------------
ln_chlor |      10      3.7751   1.734293   2.302585   6.522093

summ ln_chlor if deep==1

Variable |     Obs        Mean   Std. Dev.       Min        Max
---------+-----------------------------------------------------
ln_chlor |      42    3.069318   1.258424   1.098612   6.633318

summ ln_chlor

Variable |     Obs        Mean   Std. Dev.       Min        Max
---------+-----------------------------------------------------
ln_chlor |      52    3.205046   1.372147   1.098612   6.633318
Regression model [3.32], page 86.
regress ln_chlor deep

  Source |       SS       df       MS                  Number of obs =      52
---------+------------------------------               F(  1,    50) =    2.19
   Model |  4.02334351     1  4.02334351               Prob > F      =  0.1455
Residual |  91.9988551    50   1.8399771               R-squared     =  0.0419
---------+------------------------------               Adj R-squared =  0.0227
   Total |  96.0221986    51  1.88278821               Root MSE      =  1.3565

------------------------------------------------------------------------------
ln_chlor |      Coef.   Std. Err.       t     P>|t|       [95% Conf. Interval]
---------+--------------------------------------------------------------------
    deep |   -.705782    .477291     -1.479   0.145      -1.664449    .2528851
   _cons |     3.7751   .4289495      8.801   0.000        2.91353    4.636671
------------------------------------------------------------------------------
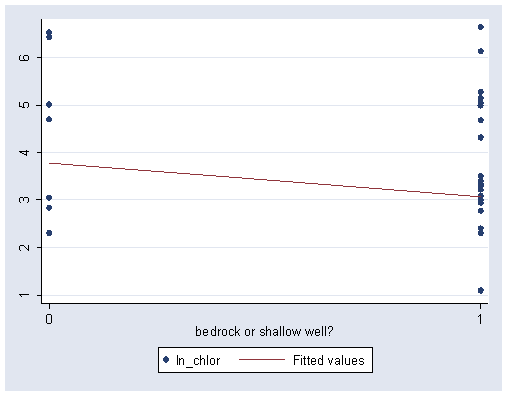
Figure 3.3, page 87.
graph twoway (scatter ln_chlor deep) (lfit ln_chlor deep), ylabel(1(1)6) xlabel(0 1)
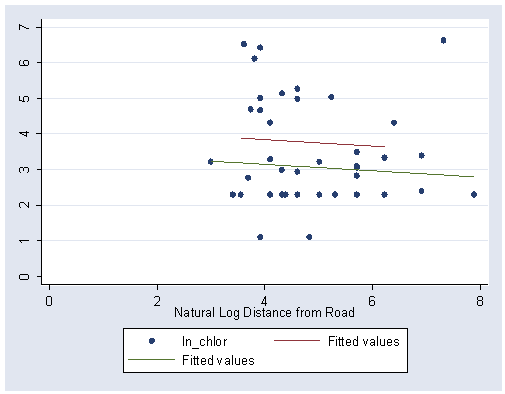
Figure 3.4, page 88. First generate and label the natural log of droad.
gen ln_road = log(droad)
label variable ln_road "Natural Log Distance from Road"
Next regress model [3.33] and output the predicted values to yhat.
regress ln_chlor deep ln_road

  Source |       SS       df       MS                  Number of obs =      52
---------+------------------------------               F(  2,    49) =    1.21
   Model |  4.50187596     2  2.25093798               Prob > F      =  0.3084
Residual |  91.5203226    49  1.86776169               R-squared     =  0.0469
---------+------------------------------               Adj R-squared =  0.0080
   Total |  96.0221986    51  1.88278821               Root MSE      =  1.3667

------------------------------------------------------------------------------
ln_chlor |      Coef.   Std. Err.       t     P>|t|       [95% Conf. Interval]
---------+--------------------------------------------------------------------
    deep |  -.6971194   .4811856     -1.449   0.154      -1.664098    .2698592
 ln_road |  -.0909673   .1797176     -0.506   0.615      -.4521233    .2701886
   _cons |    4.20954   .9609568      4.381   0.000       2.278425    6.140655
------------------------------------------------------------------------------
predict yhat
(option xb assumed; fitted values)
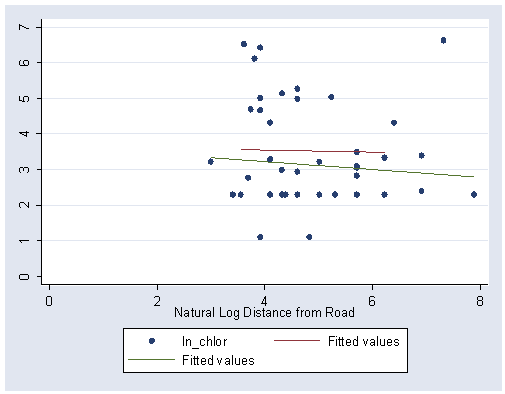
graph twoway (scatter ln_chlor ln_road) (line yhat ln_road if deep ==0) ///
	(line yhat ln_road if deep ==1), ylabel(0(1)7) xlabel(0(2)8)
Generate the intercept dummy variable for model [3.34].
Figure 3.5, page 89. This is graphed in the same manner as figure 3.4, once the interaction term is created and the predicted values for [3.34] are output.
gen deeproad = deep*ln_road
quietly regress ln_chlor ln_road deeproad
predict yhat2
(option xb assumed; fitted values)

graph twoway (scatter ln_chlor ln_road) (line yhat2 ln_road if deep ==0) ///
		(line yhat2 ln_road if deep ==1), ylabel(0(1)7) xlabel(0(2)8)
Table 3.4, page 3.4.
regress ln_chlor deep ln_road deeproad

  Source |       SS       df       MS                  Number of obs =      52
---------+------------------------------               F(  3,    48) =    3.81
   Model |  18.4831272     3   6.1610424               Prob > F      =  0.0157
Residual |  77.5390714    48  1.61539732               R-squared     =  0.1925
---------+------------------------------               Adj R-squared =  0.1420
   Total |  96.0221986    51  1.88278821               Root MSE      =   1.271

------------------------------------------------------------------------------
ln_chlor |      Coef.   Std. Err.       t     P>|t|       [95% Conf. Interval]
---------+--------------------------------------------------------------------
    deep |  -6.717366   2.094713     -3.207   0.002      -10.92907   -2.505663
 ln_road |  -1.109424   .3844204     -2.886   0.006      -1.882354   -.3364954
deeproad |   1.255847   .4268777      2.942   0.005       .3975521    2.114143
   _cons |   9.073459   1.879384      4.828   0.000       5.294704    12.85221
------------------------------------------------------------------------------

summ ln_chlor deep ln_road deeproad

Variable |     Obs        Mean   Std. Dev.       Min        Max
---------+-----------------------------------------------------
ln_chlor |      52    3.205046   1.372147   1.098612   6.633318
    deep |      53    .8113208   .3949977          0          1
 ln_road |      53    4.838378    1.06035   2.995732   7.878534
deeproad |      53    3.937289   2.141892          0   7.878534
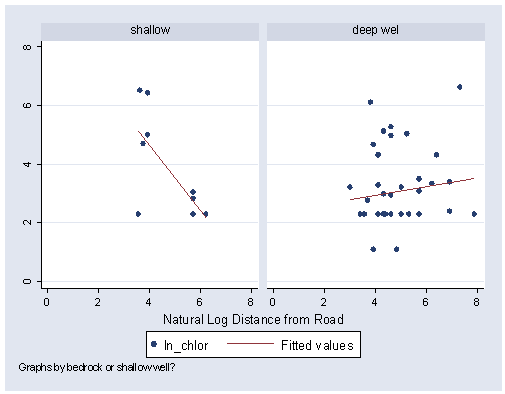
Figure 3.6 on page 91 can be graphed using the same steps as figures 3.4 and 3.5.
Figure 3.7, page 91.
graph twoway (scatter ln_chlor ln_road) (lfit ln_chlor ln_road, by(deep)), ///
		xlabel(0(2)8) ylabel(0(2)8)
Regression model [3.38], page 92.
regress ln_chlor ln_road

  Source |       SS       df       MS                  Number of obs =      52
---------+------------------------------               F(  1,    50) =    0.30
   Model |  .581654392     1  .581654392               Prob > F      =  0.5834
Residual |  95.4405442    50  1.90881088               R-squared     =  0.0061
---------+------------------------------               Adj R-squared = -0.0138
   Total |  96.0221986    51  1.88278821               Root MSE      =  1.3816

------------------------------------------------------------------------------
ln_chlor |      Coef.   Std. Err.       t     P>|t|       [95% Conf. Interval]
---------+--------------------------------------------------------------------
 ln_road |  -.1002276   .1815668     -0.552   0.583      -.4649152      .26446
   _cons |   3.691419   .9016771      4.094   0.000       1.880347    5.502491
------------------------------------------------------------------------------
F-statistic and p-value on page 92.
quietly regress ln_chlor deep ln_road deeproad
test deep deeproad

 ( 1)  deep = 0.0
 ( 2)  deeproad = 0.0

       F(  2,    48) =    5.54
            Prob > F =    0.0068
Table 3.5, page 93. First use the radon dataset and drop the observations which were not used in the analysis in the book.
use https://stats.idre.ucla.edu/stat/stata/examples/rwg/radon, clear
(Archer (1987) & Cohen (1988))

drop if _n==10 | _n==15 | _n==16 | _n==21
(4 observations deleted)
Next generate the x1 and x2 dummies.
gen x1=reading
gen x2=fringe
Next create area which is a combination of reading, fringe and control. Let area=1 when reading=1. Then recode its missing values if the case is in the fringe or control areas.
gen area=1 if reading==1        /* area=1 if reading */
(20 missing values generated)

recode area .=2 if fringe==1    /* area=2 if fringe  */
(7 changes made)

recode area .=3 if control==1  /* area=3 if control */
(13 changes made)

/* adding values labels to "area" */
label define areaname 1 "Reading Prong" 2 "Fringe" 3 "Control"
label values area areaname
Next create a new variable mnradon which is a recode of radon. Values 0 – 1.5 are recoded to 1 etc. as in the footnote of Table 3.5.
gen mnradon=radon
recode mnradon 0/1.5=1 1.6/2.4=2 2.5/max=3
(26 changes made)

label define lmh 1 "Low" 2 "Mid" 3 "High"
label values mnradon lmh
Next create the x3 and x4 dummies. These are one if the condition in parenthesis are true and zero otherwise.
gen x3=(mnradon==1)
gen x4=(mnradon==2)
View Table 3.5 using list. The pagesize in Stata is not wide enough to view all the variables at once as on page 93.
list county cancer area

          county     cancer           area
  1.      Orange          6  Reading Prong
  2.      Putnam       10.5  Reading Prong
  3.      Sussex        6.7  Reading Prong
  4.      Warren          6  Reading Prong
  5.      Morris        6.1  Reading Prong
  6.   Hunterdon        6.7  Reading Prong
  7.       Berks        5.2         Fringe
  8.      Lehigh        5.6         Fringe
  9. Northampton        5.8         Fringe
 10.        Pike        4.5         Fringe
 11.    Dutchess        5.5         Fringe
 12.    Sullivan        5.4         Fringe
 13.      Ulster        6.3         Fringe
 14.    Columbia        6.3        Control
 15.    Delaware        4.3        Control
 16.      Greene          4        Control
 17.      Otsego        5.9        Control
 18.       Tioga        4.7        Control
 19.      Carbon        4.8        Control
 20.     Lebanon        5.8        Control
 21.  Lackawanna        5.4        Control
 22.     Luzerne        5.2        Control
 23.  Schuylkill        3.6        Control
 24. Susquehanna        4.3        Control
 25.       Wayne        3.5        Control
 26.     Wyoming        6.9        Control

list county x1 x2 mnradon x3 x4

          county         x1         x2    mnradon         x3         x4
  1.      Orange          1          0        Low          1          0
  2.      Putnam          1          0        Mid          0          1
  3.      Sussex          1          0        Mid          0          1
  4.      Warren          1          0       High          0          0
  5.      Morris          1          0        Low          1          0
  6.   Hunterdon          1          0       High          0          0
  7.       Berks          0          1       High          0          0
  8.      Lehigh          0          1       High          0          0
  9. Northampton          0          1       High          0          0
 10.        Pike          0          1        Low          1          0
 11.    Dutchess          0          1        Mid          0          1
 12.    Sullivan          0          1        Low          1          0
 13.      Ulster          0          1        Low          1          0
 14.    Columbia          0          0        Mid          0          1
 15.    Delaware          0          0        Mid          0          1
 16.      Greene          0          0        Mid          0          1
 17.      Otsego          0          0        Mid          0          1
 18.       Tioga          0          0        Mid          0          1
 19.      Carbon          0          0        Mid          0          1
 20.     Lebanon          0          0       High          0          0
 21.  Lackawanna          0          0        Low          1          0
 22.     Luzerne          0          0        Low          1          0
 23.  Schuylkill          0          0       High          0          0
 24. Susquehanna          0          0        Low          1          0
 25.       Wayne          0          0        Low          1          0
 26.     Wyoming          0          0        Mid          0          1
The commands for table 3.6 on page 94 and all the other tables following are given by Hamilton in the book or have procedures similar to previous examples. Below are the statements which generate the variables needed.
gen x1x3=x1*x3
gen x1x4=x1*x4
gen x2x3=x2*x3
gen x2x4=x2*x4

gen v1=x1
recode v1 0=-1 if control==1
(13 changes made)

gen v2=x2
recode v2 0=-1 if control==1
(13 changes made)

gen v3=x3
recode v3 0=-1 if mnradon==3
(7 changes made)

gen v4=x4
recode v4 0=-1 if mnradon==3
(7 changes made)

gen v2v4=v2*v4
gen v2v3=v2*v3
gen v1v4=v1*v4
gen v1v3=v1*v3
Save the new data.
save radon2, replace

