Table 4.2, page 114
use https://stats.idre.ucla.edu/stat/stata/examples/rwg/concord1, clear

correlate income water80 educat retire peop81 cpeop water81
(obs=496)

             |   income  water80   educat   retire   peop81    cpeop  water81
-------------+---------------------------------------------------------------
      income |   1.0000
     water80 |   0.3371   1.0000
      educat |   0.3463   0.0982   1.0000
      retire |  -0.3806  -0.2919  -0.1742   1.0000
      peop81 |   0.3113   0.5251   0.0587  -0.3757   1.0000
       cpeop |   0.0911  -0.0312   0.0055  -0.0585   0.1443   1.0000
     water81 |   0.4178   0.7648   0.0404  -0.2731   0.6183   0.0661   1.0000
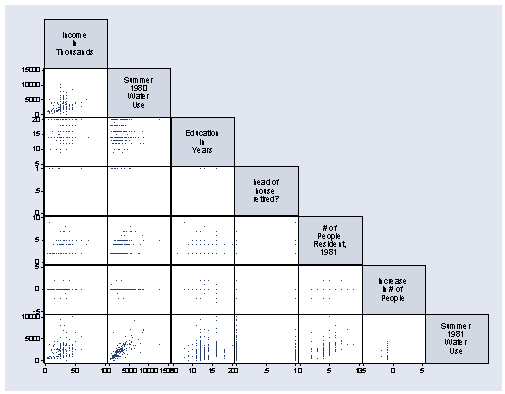
Figure 4.1, page 115. The option symbol(p) means that a small plus sign will be used, and the half option means that only the lower half of the graph will be displayed.
graph matrix income water80 educat retire peop81 cpeop water81, half msymbol(p)
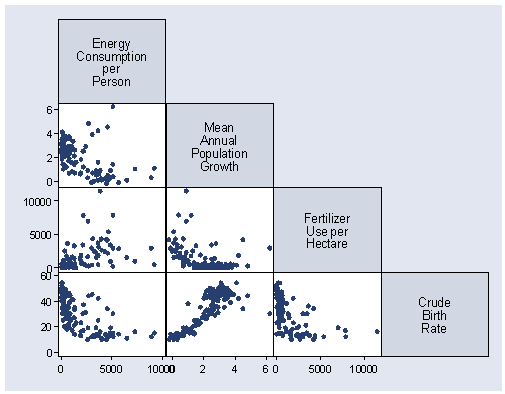
Figure 4.2, page 115
use https://stats.idre.ucla.edu/stat/stata/examples/rwg/nations, clear
graph matrix encon85 popgro85 fert84 birthr85, half
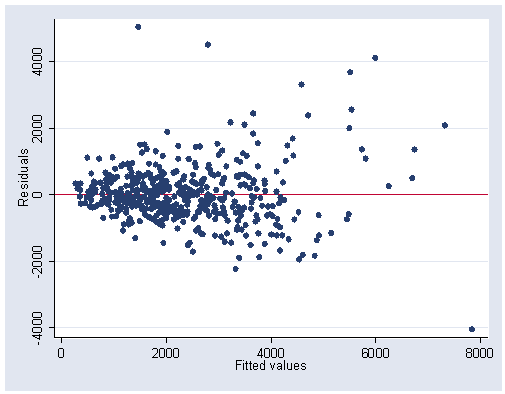
Figure 4.3, page 116 The yline(0) option draws a horizontal line at 0.
use https://stats.idre.ucla.edu/stat/stata/examples/rwg/concord1, clear

regress water81 income water80 educat retire peop81 cpeop peop80

      Source |       SS       df       MS              Number of obs =     496
-------------+------------------------------           F(  6,   489) =  171.08
       Model |   740477522     6   123412920           Prob > F      =  0.0000
    Residual |   352761188   489  721393.022           R-squared     =  0.6773
-------------+------------------------------           Adj R-squared =  0.6734
       Total |  1.0932e+09   495  2208563.05           Root MSE      =  849.35

------------------------------------------------------------------------------
     water81 |      Coef.   Std. Err.      t    P>|t|     [95% Conf. Interval]
-------------+----------------------------------------------------------------
      income |   20.96699   3.463719     6.05   0.000     14.16138     27.7726
     water80 |     .49194   .0263478    18.67   0.000      .440171    .5437089
      educat |  -41.86552   13.22031    -3.17   0.002    -67.84114    -15.8899
      retire |   189.1843   95.02142     1.99   0.047     2.483674     375.885
      peop81 |  (dropped)
       cpeop |   344.6506   80.80625     4.27   0.000     185.8803    503.4209
      peop80 |    248.197    28.7248     8.64   0.000     191.7578    304.6363
       _cons |   242.2204   206.8638     1.17   0.242    -164.2312    648.6721
------------------------------------------------------------------------------

rvfplot,yline(0) ylabel(-4000(2000)4000) xlabel(0(2000)8000)
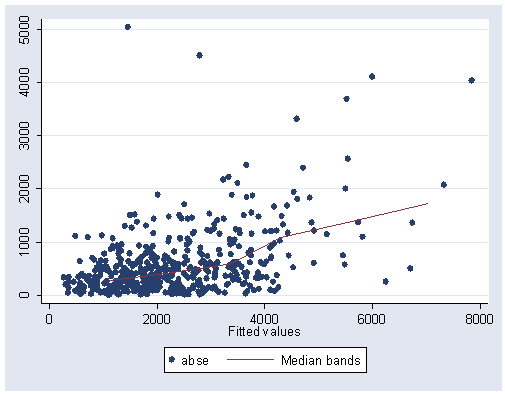
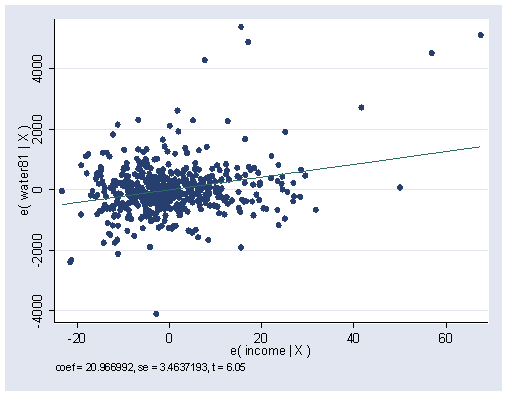
Figure 4.4, page 117
use https://stats.idre.ucla.edu/stat/stata/examples/rwg/concord1, clear
regress water81 income water80 educat retire peop81 cpeop peop80

      Source |       SS       df       MS              Number of obs =     496
-------------+------------------------------           F(  6,   489) =  171.08
       Model |   740477522     6   123412920           Prob > F      =  0.0000
    Residual |   352761188   489  721393.022           R-squared     =  0.6773
-------------+------------------------------           Adj R-squared =  0.6734
       Total |  1.0932e+09   495  2208563.05           Root MSE      =  849.35

------------------------------------------------------------------------------
     water81 |      Coef.   Std. Err.      t    P>|t|     [95% Conf. Interval]
-------------+----------------------------------------------------------------
      income |   20.96699   3.463719     6.05   0.000     14.16138     27.7726
     water80 |     .49194   .0263478    18.67   0.000      .440171    .5437089
      educat |  -41.86552   13.22031    -3.17   0.002    -67.84114    -15.8899
      retire |   189.1843   95.02142     1.99   0.047     2.483674     375.885
      peop81 |  (dropped)
       cpeop |   344.6506   80.80625     4.27   0.000     185.8803    503.4209
      peop80 |    248.197    28.7248     8.64   0.000     191.7578    304.6363
       _cons |   242.2204   206.8638     1.17   0.242    -164.2312    648.6721
------------------------------------------------------------------------------

predict yhat
predict e, residual
gen abse = abs(e)
graph twoway (scatter abse yhat) (mband abse yhat, bands(6) )
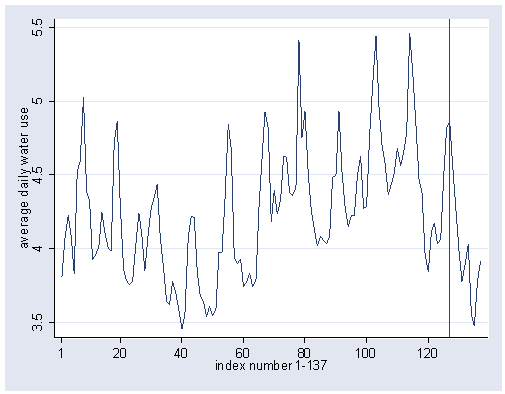
Figure 4.5, page 119
use https://stats.idre.ucla.edu/stat/stata/examples/rwg/concord2, clear
graph twoway line H2Ouse time, ylabel(3.5(.5)5.5) xlabel(1 20(20)120) xline(127)
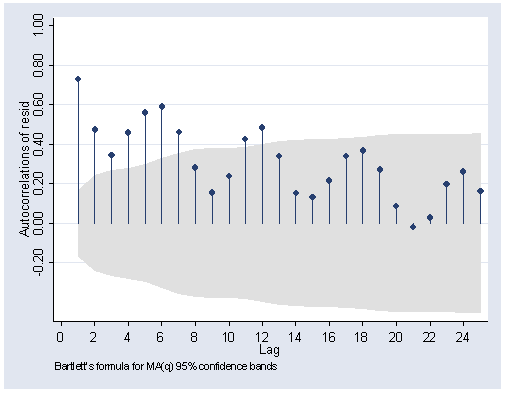
Figure 4.6, page 121
use https://stats.idre.ucla.edu/stat/stata/examples/rwg/concord2, clear
regress H2Ouse temp rain educ

      Source |       SS       df       MS              Number of obs =     137
-------------+------------------------------           F(  3,   133) =   21.57
       Model |  8.40906094     3  2.80302031           Prob > F      =  0.0000
    Residual |  17.2802366   133  .129926591           R-squared     =  0.3273
-------------+------------------------------           Adj R-squared =  0.3122
       Total |  25.6892976   136  .188891894           Root MSE      =  .36045

------------------------------------------------------------------------------
      H2Ouse |      Coef.   Std. Err.      t    P>|t|     [95% Conf. Interval]
-------------+----------------------------------------------------------------
        temp |   .0128571   .0016975     7.57   0.000     .0094995    .0162147
        rain |  -.0474281    .021229    -2.23   0.027    -.0894182    -.005438
        educ |  -.2469767   .1134846    -2.18   0.031    -.4714448   -.0225086
       _cons |   3.828001   .1006446    38.03   0.000      3.62893    4.027072
------------------------------------------------------------------------------

predict resid, residual
tsset time

time variable:  time, 1 to 137

ac resid, lags(25) xlabel(0(2)24) ylabel(-.2(.2)1)
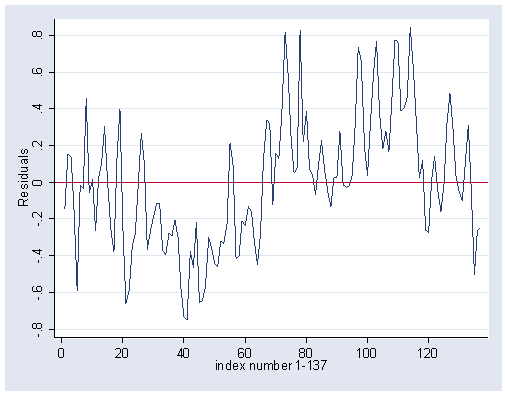
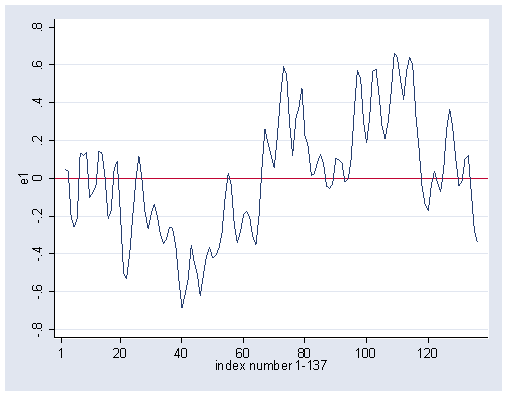
Figure 4.7, page 122 The c(s) option is short for connect(s), and the s stands for smooth.
use https://stats.idre.ucla.edu/stat/stata/examples/rwg/concord2, clear
regress H2Ouse temp rain educ

      Source |       SS       df       MS              Number of obs =     137
-------------+------------------------------           F(  3,   133) =   21.57
       Model |  8.40906094     3  2.80302031           Prob > F      =  0.0000
    Residual |  17.2802366   133  .129926591           R-squared     =  0.3273
-------------+------------------------------           Adj R-squared =  0.3122
       Total |  25.6892976   136  .188891894           Root MSE      =  .36045

------------------------------------------------------------------------------
      H2Ouse |      Coef.   Std. Err.      t    P>|t|     [95% Conf. Interval]
-------------+----------------------------------------------------------------
        temp |   .0128571   .0016975     7.57   0.000     .0094995    .0162147
        rain |  -.0474281    .021229    -2.23   0.027    -.0894182    -.005438
        educ |  -.2469767   .1134846    -2.18   0.031    -.4714448   -.0225086
       _cons |   3.828001   .1006446    38.03   0.000      3.62893    4.027072
------------------------------------------------------------------------------

predict e, resid

graph twoway line e time, ylabel(-.8(.2).8) xlabel(0 20(20)120)  yline(0)
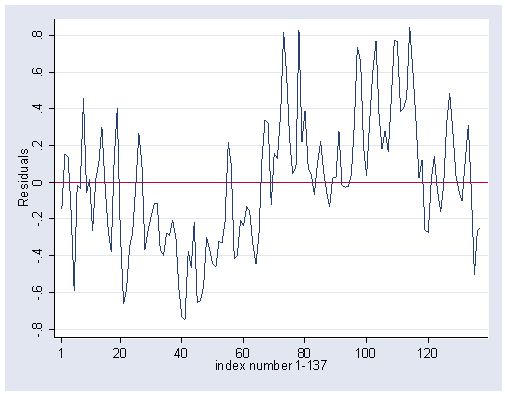
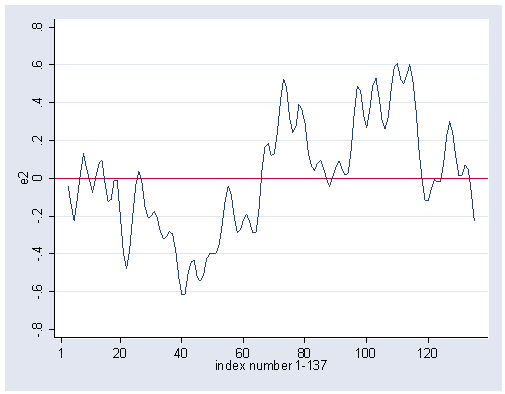
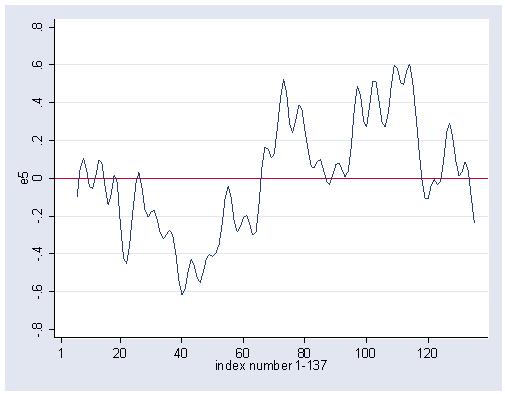
Figure 4.8, page 122
Graph 1:
use https://stats.idre.ucla.edu/stat/stata/examples/rwg/concord2, clear
regress H2Ouse temp rain educ

      Source |       SS       df       MS              Number of obs =     137
-------------+------------------------------           F(  3,   133) =   21.57
       Model |  8.40906094     3  2.80302031           Prob > F      =  0.0000
    Residual |  17.2802366   133  .129926591           R-squared     =  0.3273
-------------+------------------------------           Adj R-squared =  0.3122
       Total |  25.6892976   136  .188891894           Root MSE      =  .36045

------------------------------------------------------------------------------
      H2Ouse |      Coef.   Std. Err.      t    P>|t|     [95% Conf. Interval]
-------------+----------------------------------------------------------------
        temp |   .0128571   .0016975     7.57   0.000     .0094995    .0162147
        rain |  -.0474281    .021229    -2.23   0.027    -.0894182    -.005438
        educ |  -.2469767   .1134846    -2.18   0.031    -.4714448   -.0225086
       _cons |   3.828001   .1006446    38.03   0.000      3.62893    4.027072
------------------------------------------------------------------------------

predict e, resid

graph twoway line e time, ylabel(-.8(.2).8) xlabel(1 20(20)120) yline(0)
Graph 2:
gen e1 = e[_n-1]/3 + e[_n]/3 + e[_n+1]/3
(2 missing values generated)

graph twoway line e1 time, ylabel(-.8(.2).8) xlabel(1 20(20)120) yline(0)
Graph 3:
gen e2 = e1[_n-1]/3 + e1[_n]/3 + e1[_n+1]/3
(4 missing values generated)

graph twoway line e2 time, ylabel(-.8(.2).8) xlabel(1 20(20)120) yline(0)
Graph 4:
gen e3 = e2[_n-1]/3 + e1[_n]/3 + e1[_n+1]/3
(5 missing values generated)

gen e4 = e3[_n-1]/3 + e1[_n]/3 + e1[_n+1]/3
(6 missing values generated)

gen e5 = e4[_n-1]/3 + e1[_n]/3 + e1[_n+1]/3
(7 missing values generated)

graph twoway line e5 time, ylabel(-.8(.2).8) xlabel(1 20(20)120) yline(0)
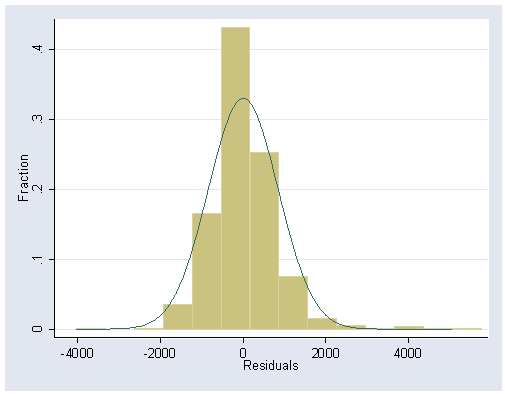
Figure 4.9, page 124.
Histogram: The bin option allows you to select how many bins the histogram will have.
use https://stats.idre.ucla.edu/stat/stata/examples/rwg/concord1, clear

regress water81 income water80 educat retire peop81 cpeop

      Source |       SS       df       MS              Number of obs =     496
-------------+------------------------------           F(  6,   489) =  171.08
       Model |   740477522     6   123412920           Prob > F      =  0.0000
    Residual |   352761188   489  721393.022           R-squared     =  0.6773
-------------+------------------------------           Adj R-squared =  0.6734
       Total |  1.0932e+09   495  2208563.05           Root MSE      =  849.35

------------------------------------------------------------------------------
     water81 |      Coef.   Std. Err.      t    P>|t|     [95% Conf. Interval]
-------------+----------------------------------------------------------------
      income |   20.96699   3.463719     6.05   0.000     14.16138     27.7726
     water80 |     .49194   .0263478    18.67   0.000      .440171    .5437089
      educat |  -41.86552   13.22031    -3.17   0.002    -67.84114    -15.8899
      retire |   189.1843   95.02142     1.99   0.047     2.483674     375.885
      peop81 |    248.197    28.7248     8.64   0.000     191.7578    304.6363
       cpeop |    96.4536   80.51903     1.20   0.232    -61.75235    254.6596
       _cons |   242.2204   206.8638     1.17   0.242    -164.2312    648.6721
------------------------------------------------------------------------------

predict e, residual

histogram e, fraction norm bin(13) xlabel(-4000(2000)4000) ylabel(0(.1).4)
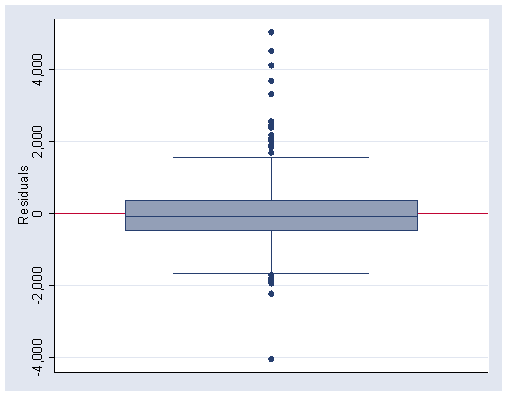
Boxplot:
graph box e, yline(0) ylabel(-4000(2000)4000)
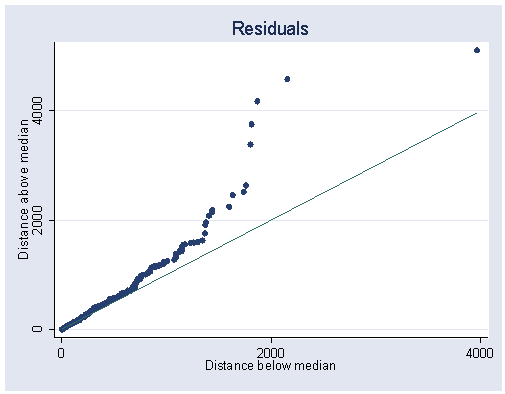
Symmerty plot:
symplot e, xlabel(0 2000 4000) ylabel(0 2000 4000)
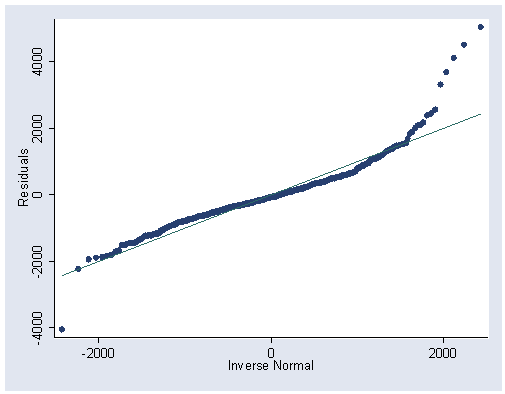
Quantile normal plot:
qnorm e, ylabel(-4000(2000)4000) xlabel(-2000 0 2000)
Table 4.3, page 127.
use https://stats.idre.ucla.edu/stat/stata/examples/rwg/concord1, clear
regress water81 income water80 educat retire peop81 cpeop

      Source |       SS       df       MS              Number of obs =     496
-------------+------------------------------           F(  6,   489) =  171.08
       Model |   740477522     6   123412920           Prob > F      =  0.0000
    Residual |   352761188   489  721393.022           R-squared     =  0.6773
-------------+------------------------------           Adj R-squared =  0.6734
       Total |  1.0932e+09   495  2208563.05           Root MSE      =  849.35

------------------------------------------------------------------------------
     water81 |      Coef.   Std. Err.      t    P>|t|     [95% Conf. Interval]
-------------+----------------------------------------------------------------
      income |   20.96699   3.463719     6.05   0.000     14.16138     27.7726
     water80 |     .49194   .0263478    18.67   0.000      .440171    .5437089
      educat |  -41.86552   13.22031    -3.17   0.002    -67.84114    -15.8899
      retire |   189.1843   95.02142     1.99   0.047     2.483674     375.885
      peop81 |    248.197    28.7248     8.64   0.000     191.7578    304.6363
       cpeop |    96.4536   80.51903     1.20   0.232    -61.75235    254.6596
       _cons |   242.2204   206.8638     1.17   0.242    -164.2312    648.6721
------------------------------------------------------------------------------

predict DBincome, dfbeta(income)
predict DBwtr80, dfbeta(water80)
predict DBeducat, dfbeta(educat)
predict DBretire, dfbeta(retire)
predict DBpeop81, dfbeta(peop81)
predict DBcpeop, dfbeta(cpeop)
summarize DBincome DBwtr80 DBeducat DBretire DBpeop81 DBcpeop

    Variable |     Obs        Mean   Std. Dev.       Min        Max
-------------+-----------------------------------------------------
    DBincome |     496    .0004404   .0907714   -.248154   1.340371
     DBwtr80 |     496   -.0002074   .0895012   -1.38789   .6845321
    DBeducat |     496   -.0001973   .0434508  -.3601133   .1023189
    DBretire |     496    .0000682   .0445025   -.216704   .2785343
    DBpeop81 |     496    .0000747   .0612796  -.4263415   .4554408
     DBcpeop |     496   -.0000535   .0406626    -.23371   .3507265
Figure 4.10, page 127.
regress water81 income water80 educat retire peop81 cpeop peop80

      Source |       SS       df       MS              Number of obs =     496
-------------+------------------------------           F(  6,   489) =  171.08
       Model |   740477522     6   123412920           Prob > F      =  0.0000
    Residual |   352761188   489  721393.022           R-squared     =  0.6773
-------------+------------------------------           Adj R-squared =  0.6734
       Total |  1.0932e+09   495  2208563.05           Root MSE      =  849.35

------------------------------------------------------------------------------
     water81 |      Coef.   Std. Err.      t    P>|t|     [95% Conf. Interval]
-------------+----------------------------------------------------------------
      income |   20.96699   3.463719     6.05   0.000     14.16138     27.7726
     water80 |     .49194   .0263478    18.67   0.000      .440171    .5437089
      educat |  -41.86552   13.22031    -3.17   0.002    -67.84114    -15.8899
      retire |   189.1843   95.02142     1.99   0.047     2.483674     375.885
      peop81 |  (dropped)
       cpeop |   344.6506   80.80625     4.27   0.000     185.8803    503.4209
      peop80 |    248.197    28.7248     8.64   0.000     191.7578    304.6363
       _cons |   242.2204   206.8638     1.17   0.242    -164.2312    648.6721
------------------------------------------------------------------------------

avplot income, xlabel(-20(20)60) ylabel(-4000(2000)4000)
Figure 4.11, page 128. The DFBETAs need to be scaled according to the endnote. The [w=rcd] option does this.
use https://stats.idre.ucla.edu/stat/stata/examples/rwg/concord1, clear

regress water81 income water80 educat retire peop81 cpeop

      Source |       SS       df       MS              Number of obs =     496
-------------+------------------------------           F(  6,   489) =  171.08
       Model |   740477522     6   123412920           Prob > F      =  0.0000
    Residual |   352761188   489  721393.022           R-squared     =  0.6773
-------------+------------------------------           Adj R-squared =  0.6734
       Total |  1.0932e+09   495  2208563.05           Root MSE      =  849.35

------------------------------------------------------------------------------
     water81 |      Coef.   Std. Err.      t    P>|t|     [95% Conf. Interval]
-------------+----------------------------------------------------------------
      income |   20.96699   3.463719     6.05   0.000     14.16138     27.7726
     water80 |     .49194   .0263478    18.67   0.000      .440171    .5437089
      educat |  -41.86552   13.22031    -3.17   0.002    -67.84114    -15.8899
      retire |   189.1843   95.02142     1.99   0.047     2.483674     375.885
      peop81 |    248.197    28.7248     8.64   0.000     191.7578    304.6363
       cpeop |    96.4536   80.51903     1.20   0.232    -61.75235    254.6596
       _cons |   242.2204   206.8638     1.17   0.242    -164.2312    648.6721
------------------------------------------------------------------------------

predict DBincome, dfbeta(income)
regress water81 water80 educat retire peop81 cpeop peop80

      Source |       SS       df       MS              Number of obs =     496
-------------+------------------------------           F(  5,   490) =  184.54
       Model |   714043771     5   142808754           Prob > F      =  0.0000
    Residual |   379194939   490  773867.223           R-squared     =  0.6531
-------------+------------------------------           Adj R-squared =  0.6496
       Total |  1.0932e+09   495  2208563.05           Root MSE      =  879.70

------------------------------------------------------------------------------
     water81 |      Coef.   Std. Err.      t    P>|t|     [95% Conf. Interval]
-------------+----------------------------------------------------------------
     water80 |   .5218759   .0268043    19.47   0.000     .4692104    .5745414
      educat |  -17.03541   13.01692    -1.31   0.191    -42.61128    8.540463
      retire |   47.74677   95.39495     0.50   0.617    -139.6869    235.1804
      peop81 |   263.9229   29.62926     8.91   0.000     205.7068     322.139
       cpeop |      134.9   83.13626     1.62   0.105    -28.44755    298.2475
      peop80 |  (dropped)
       _cons |   291.3458   214.0905     1.36   0.174    -129.3028    711.9944
------------------------------------------------------------------------------

predict yresid, residual
regress income water80 educat retire peop81 cpeop peop80

      Source |       SS       df       MS              Number of obs =     496
-------------+------------------------------           F(  5,   490) =   39.56
       Model |  24271.7315     5   4854.3463           Prob > F      =  0.0000
    Residual |  60129.3572   490  122.712974           R-squared     =  0.2876
-------------+------------------------------           Adj R-squared =  0.2803
       Total |  84401.0887   495   170.50725           Root MSE      =  11.078

------------------------------------------------------------------------------
      income |      Coef.   Std. Err.      t    P>|t|     [95% Conf. Interval]
-------------+----------------------------------------------------------------
     water80 |   .0014278   .0003375     4.23   0.000     .0007646     .002091
      educat |   1.184248   .1639156     7.22   0.000     .8621833    1.506312
      retire |  -6.745725   1.201261    -5.62   0.000    -9.105983   -4.385467
      peop81 |   .7500293   .3731065     2.01   0.045     .0169433    1.483115
       cpeop |   1.833663   1.046893     1.75   0.080    -.2232916    3.890617
      peop80 |  (dropped)
       _cons |   2.342986   2.695935     0.87   0.385    -2.954032    7.640004
------------------------------------------------------------------------------

predict xresid, residual

gen rcd = DBincome
replace rcd = . if abs(DBincome) > 2
(0 real changes made)

replace rcd = [(99/18)*abs(DBincome)*((abs(DBincome))+1)^2]+1
(496 real changes made)

replace rcd = 2 if abs(DBincome) ==.
(0 real changes made)

graph twoway (scatter yresid xresid [w=rcd], msymbol(oh)) (lfit yresid xresid), ///
		ylabel(-4000(2000)4000) xlabel(-20(20)60)
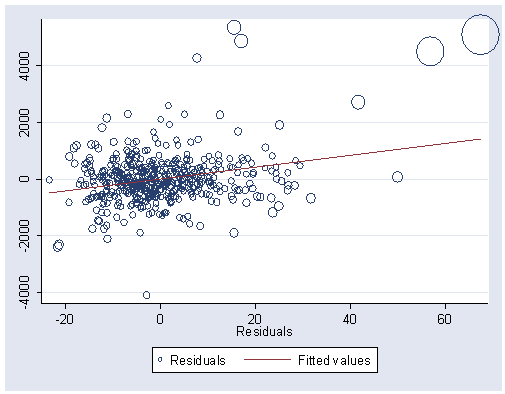
Figure 4.12, page 129.
use https://stats.idre.ucla.edu/stat/stata/examples/rwg/concord1, clear

regress water81 income water80 educat retire peop81 cpeop

      Source |       SS       df       MS              Number of obs =     496
-------------+------------------------------           F(  6,   489) =  171.08
       Model |   740477522     6   123412920           Prob > F      =  0.0000
    Residual |   352761188   489  721393.022           R-squared     =  0.6773
-------------+------------------------------           Adj R-squared =  0.6734
       Total |  1.0932e+09   495  2208563.05           Root MSE      =  849.35

------------------------------------------------------------------------------
     water81 |      Coef.   Std. Err.      t    P>|t|     [95% Conf. Interval]
-------------+----------------------------------------------------------------
      income |   20.96699   3.463719     6.05   0.000     14.16138     27.7726
     water80 |     .49194   .0263478    18.67   0.000      .440171    .5437089
      educat |  -41.86552   13.22031    -3.17   0.002    -67.84114    -15.8899
      retire |   189.1843   95.02142     1.99   0.047     2.483674     375.885
      peop81 |    248.197    28.7248     8.64   0.000     191.7578    304.6363
       cpeop |    96.4536   80.51903     1.20   0.232    -61.75235    254.6596
       _cons |   242.2204   206.8638     1.17   0.242    -164.2312    648.6721
------------------------------------------------------------------------------

predict DBwtr80, dfbeta(water80)
regress water81 income educat retire peop81 cpeop peop80

      Source |       SS       df       MS              Number of obs =     496
-------------+------------------------------           F(  5,   490) =   79.31
       Model |   488996056     5  97799211.3           Prob > F      =  0.0000
    Residual |   604242653   490  1233148.27           R-squared     =  0.4473
-------------+------------------------------           Adj R-squared =  0.4417
       Total |  1.0932e+09   495  2208563.05           Root MSE      =  1110.5

------------------------------------------------------------------------------
     water81 |      Coef.   Std. Err.      t    P>|t|     [95% Conf. Interval]
-------------+----------------------------------------------------------------
      income |   33.10548   4.448118     7.44   0.000     24.36574    41.84522
      educat |  -42.21332   17.28474    -2.44   0.015    -76.17467   -8.251971
      retire |   84.66143    124.019     0.68   0.495    -159.0132    328.3361
      peop81 |  (dropped)
       cpeop |   376.5361   105.6257     3.56   0.000     169.0009    584.0713
      peop80 |   491.5161   33.46848    14.69   0.000     425.7566    557.2755
       _cons |   586.0337   269.3883     2.18   0.030     56.73503    1115.332
------------------------------------------------------------------------------

predict yresid, residual
regress water80 income educat retire peop81 cpeop peop80

      Source |       SS       df       MS              Number of obs =     496
-------------+------------------------------           F(  5,   490) =   47.23
       Model |   500781798     5   100156360           Prob > F      =  0.0000
    Residual |  1.0392e+09   490  2120731.64           R-squared     =  0.3252
-------------+------------------------------           Adj R-squared =  0.3183
       Total |  1.5399e+09   495  3110990.51           Root MSE      =  1456.3

------------------------------------------------------------------------------
     water80 |      Coef.   Std. Err.      t    P>|t|     [95% Conf. Interval]
-------------+----------------------------------------------------------------
      income |   24.67473   5.833263     4.23   0.000     13.21344    36.13602
      educat |  -.7069974   22.66721    -0.03   0.975    -45.24391    43.82992
      retire |  -212.4708   162.6385    -1.31   0.192    -532.0258    107.0841
      peop81 |  (dropped)
       cpeop |   64.81579   138.5176     0.47   0.640    -207.3459    336.9775
      peop80 |   494.6113   43.89057    11.27   0.000     408.3744    580.8482
       _cons |   698.8928   353.2758     1.98   0.048     4.770461    1393.015
------------------------------------------------------------------------------

predict xresid, residual

gen rcd1 = DBwtr80
replace rcd1 = . if abs(DBwtr80) > 2
(0 real changes made)

replace rcd1 = [(99/18)*abs(DBwtr80)*((abs(DBwtr80))+1)^2]+1
(496 real changes made)

replace rcd1 = 2 if abs(DBwtr80) ==.

graph twoway (scatter yresid xresid [w=rcd1], msymbol(oh)) (lfit yresid xresid), ///
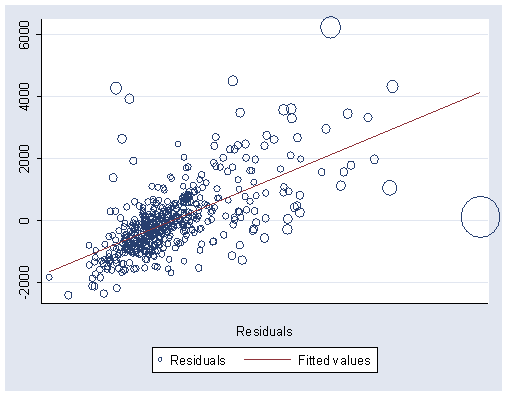
		ylabel(-2000(2000)6000) xlabel(-2000(0)8000)
Figure 4.13, page 129. These are done the same as above, dropping the different variables.
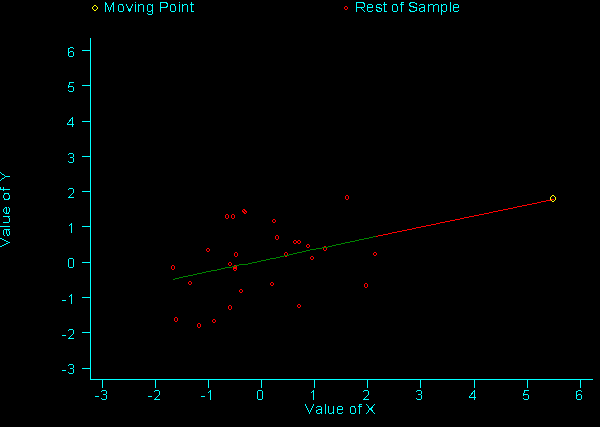
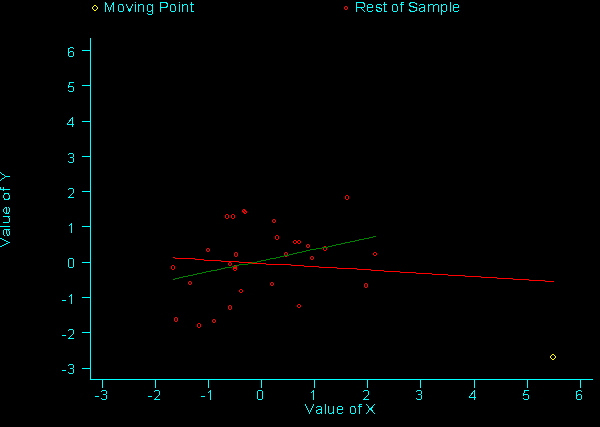
Figure 4.14, page 131. We use the regpt program to make graphs similar to the left and right panel of figure 4.14. You can download regpt from within Stata by typing search regpt (see How can I use the search command to search for programs and get additional help? for more information about using search).
regpt
Table 4.4, page 133.
use https://stats.idre.ucla.edu/stat/stata/examples/rwg/concord1, clear

regress water81 income water80 educat retire peop81 cpeop

      Source |       SS       df       MS              Number of obs =     496
-------------+------------------------------           F(  6,   489) =  171.08
       Model |   740477522     6   123412920           Prob > F      =  0.0000
    Residual |   352761188   489  721393.022           R-squared     =  0.6773
-------------+------------------------------           Adj R-squared =  0.6734
       Total |  1.0932e+09   495  2208563.05           Root MSE      =  849.35

------------------------------------------------------------------------------
     water81 |      Coef.   Std. Err.      t    P>|t|     [95% Conf. Interval]
-------------+----------------------------------------------------------------
      income |   20.96699   3.463719     6.05   0.000     14.16138     27.7726
     water80 |     .49194   .0263478    18.67   0.000      .440171    .5437089
      educat |  -41.86552   13.22031    -3.17   0.002    -67.84114    -15.8899
      retire |   189.1843   95.02142     1.99   0.047     2.483674     375.885
      peop81 |    248.197    28.7248     8.64   0.000     191.7578    304.6363
       cpeop |    96.4536   80.51903     1.20   0.232    -61.75235    254.6596
       _cons |   242.2204   206.8638     1.17   0.242    -164.2312    648.6721
------------------------------------------------------------------------------

predict DBincome, dfbeta(income)
predict DBwtr80, dfbeta(water80)
predict e, residual
predict h, leverage
predict z, rstandard
predict t, rstudent
predict D, cooksd
list case e h z t D DBincome DBwtr80 if D>=.15

Observation 94
        case          101           e    -4037.047           h     .0817331
           z    -4.960134           t     -5.08462           D     .3128368
    DBincome     .0629841     DBwtr80     -1.38789

Observation 118
        case          127           e     3315.585           h      .061611
           z     4.029793           t     4.094227           D     .1523151
    DBincome      .980374     DBwtr80    -.1809267

Observation 125
        case          134           e     3687.116           h     .0903783
           z     4.551666           t     4.646505           D     .2940669
    DBincome     1.340371     DBwtr80     .2510464
Table 4.5, page 134.
use https://stats.idre.ucla.edu/stat/stata/examples/rwg/concord1, clear

quietly regress water81 income water80 educat retire peop81 cpeop

* Stata 8 code.
vif

* Stata 9 code and output.
estat vif

    Variable |       VIF       1/VIF
-------------+----------------------
      peop81 |      1.55    0.643154
     water80 |      1.48    0.674804
      income |      1.40    0.712424
      retire |      1.29    0.775514
      educat |      1.15    0.872996
       cpeop |      1.04    0.956972
-------------+----------------------
    Mean VIF |      1.32

