Figure 6.1, page 184.
use https://stats.idre.ucla.edu/stat/stata/examples/rwg/airpol, clear

gen lnhc = ln(hc)
label variable lnhc "natural log of hydrocarbon pollution potential"
regress  mort lnhc

  Source |       SS       df       MS                  Number of obs =      60
---------+------------------------------               F(  1,    58) =    1.35
   Model |  5179.87999     1  5179.87999               Prob > F      =  0.2506
Residual |  223117.041    58  3846.84554               R-squared     =  0.0227
---------+------------------------------               Adj R-squared =  0.0058
   Total |  228296.921    59  3869.43934               Root MSE      =  62.023

------------------------------------------------------------------------------
    mort |      Coef.   Std. Err.       t     P>|t|       [95% Conf. Interval]
---------+--------------------------------------------------------------------
    lnhc |   7.968576   6.867098      1.160   0.251      -5.777414    21.71457
   _cons |   918.4252   20.53273     44.730   0.000       877.3245    959.5259
------------------------------------------------------------------------------

graph twoway (scatter mort lnhc) (lfit mort lnhc), xlabel(0(2)6) ylabel(800(100)1100)
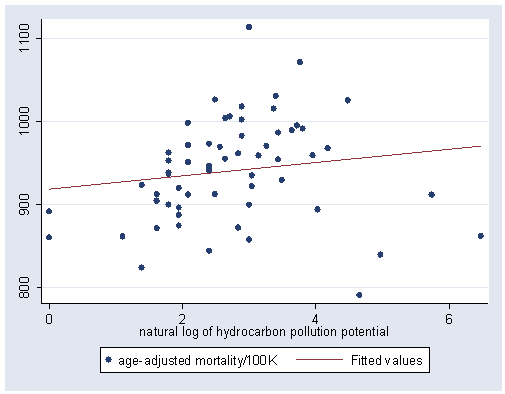
Figure 6.2, page 185.
rreg mort lnhc

   Huber iteration 1:  maximum difference in weights = .58511763
   Huber iteration 2:  maximum difference in weights = .12109939
   Huber iteration 3:  maximum difference in weights = .07054585
   Huber iteration 4:  maximum difference in weights = .02080019
Biweight iteration 5:  maximum difference in weights = .20680335
Biweight iteration 6:  maximum difference in weights = .06324705
Biweight iteration 7:  maximum difference in weights = .05913415
Biweight iteration 8:  maximum difference in weights = .02922746
Biweight iteration 9:  maximum difference in weights = .01978239
Biweight iteration 10:  maximum difference in weights = .01178611
Biweight iteration 11:  maximum difference in weights = .0036652

Robust regression estimates                            Number of obs =      60
                                                       F(  1,    58) =    8.81
                                                       Prob > F      =  0.0043

------------------------------------------------------------------------------
    mort |      Coef.   Std. Err.       t     P>|t|       [95% Conf. Interval]
---------+--------------------------------------------------------------------
    lnhc |   19.45727   6.553716      2.969   0.004       6.338583    32.57596
   _cons |     891.75   19.59571     45.507   0.000        852.525    930.9751
------------------------------------------------------------------------------

predict yhat
graph twoway (scatter mort lnhc) (lfit mort lnhc) (line yhat lnhc) ///
	(scatter mort lnhc if lnhc >=4.5, mlabel(smsa)), ///
	legend(off) xlabel(0(2)6) ylabel(800(100)1100)
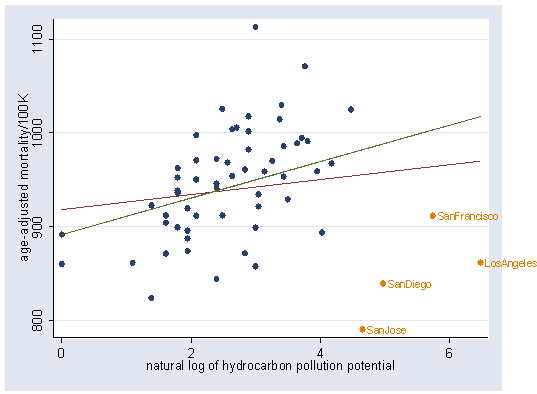
Table 6.1, page186. The genwt option generates the weight and labels it "rweight." The format rweight %3.2f command formats the variable rweight to display only two digits after the decimal.
use https://stats.idre.ucla.edu/stat/stata/examples/rwg/airpol, clear

gen lnhc = ln(hc)
rreg mort lnhc, genwt(rweight)

   Huber iteration 1:  maximum difference in weights = .58511763
   Huber iteration 2:  maximum difference in weights = .12109939
   Huber iteration 3:  maximum difference in weights = .07054585
   Huber iteration 4:  maximum difference in weights = .02080019
Biweight iteration 5:  maximum difference in weights = .20680335
Biweight iteration 6:  maximum difference in weights = .06324705
Biweight iteration 7:  maximum difference in weights = .05913415
Biweight iteration 8:  maximum difference in weights = .02922746
Biweight iteration 9:  maximum difference in weights = .01978239
Biweight iteration 10:  maximum difference in weights = .01178611
Biweight iteration 11:  maximum difference in weights = .0036652

Robust regression estimates                            Number of obs =      60
                                                       F(  1,    58) =    8.81
                                                       Prob > F      =  0.0043

------------------------------------------------------------------------------
    mort |      Coef.   Std. Err.       t     P>|t|       [95% Conf. Interval]
---------+--------------------------------------------------------------------
    lnhc |   19.45727   6.553716      2.969   0.004       6.338583    32.57596
   _cons |     891.75   19.59571     45.507   0.000        852.525    930.9751
------------------------------------------------------------------------------

predict yhat
predict e, r
sort rweight
format mort yhat e lnhc %3.1f
format rweight %3.2f
list smsa hc mort yhat e rweight

             smsa        hc  mort  yhat    e       rweight
  1.      SanJose       105  790.7  982.3  -191.6  0.08
  2.   NewOrleans        20  1113.0  950.0  163.0  0.23
  3.   LosAngeles       648  861.8  1017.7  -155.9  0.27
  4.     SanDiego       144  839.7  988.4  -148.7  0.32
  5.    Baltimore        43  1071.0  964.9  106.1  0.60
  6.      Wichita         4  823.8  918.7  -94.9  0.68
  7.    Lancaster        11  844.1  938.4  -94.3  0.68
  8.  Minneapolis        20  857.6  950.0  -92.4  0.69
  9. SanFrancisco       311  911.7  1003.4  -91.7  0.70
 10.     Richmond        12  1026.0  940.1  85.9  0.73
 11.     Portland        56  894.0  970.1  -76.1  0.79
 12.       Denver        17  871.8  946.9  -75.1  0.79
 13.   Birmingham        30  1030.0  957.9  72.1  0.81
 14.  Chattanooga        18  1018.0  948.0  70.0  0.82
 15.       Albany         8  997.9  932.2  65.7  0.84
 16.      Memphis        15  1006.0  944.4  61.6  0.86
 17.   Wilmington        14  1004.0  943.1  60.9  0.86
 18. Philadelphia        29  1015.0  957.3  57.7  0.87
 19.    Rochester         7  874.3  929.6  -55.3  0.88
 20.      Buffalo        18  1002.0  948.0  54.0  0.89
 21.  GrandRapids         5  871.3  923.1  -51.8  0.90
 22.        Miami         3  861.4  913.1  -51.7  0.90
 23.      Seattle        20  899.3  950.0  -50.7  0.90
 24.      Chicago        88  1025.0  978.9  46.1  0.92
 25.     Hartford         7  887.5  929.6  -42.1  0.93
 26.   Greensboro         8  971.1  932.2  38.9  0.94
 27.    Allentown         6  962.4  926.6  35.8  0.95
 28.      Atlanta        18  982.3  948.0  34.3  0.95
 29.       Toledo        11  972.5  938.4  34.1  0.95
 30.    Worcester         7  895.7  929.6  -33.9  0.96
 31.       Dallas         1  860.1  891.8  -31.7  0.96
 32.      NewYork        41  994.6  964.0  30.6  0.96
 33.    Milwaukee        33  929.2  959.8  -30.6  0.96
 34.        Akron        21  921.9  951.0  -29.1  0.97
 35.       Canton        12  912.3  940.1  -27.8  0.97
 36.    Cleveland        31  986.0  958.6  27.4  0.97
 37.   Bridgeport         6  899.5  926.6  -27.1  0.97
 38. Indianapolis        13  968.7  941.7  27.0  0.97
 39.   Louisville        38  989.3  962.5  26.8  0.97
 40.      Houston         6  952.5  926.6  25.9  0.97
 41.   Pittsburgh        45  991.3  965.8  25.5  0.97
 42.         York         8  911.8  932.2  -20.4  0.98
 43.  Springfield         5  904.2  923.1  -18.9  0.99
 44.     Syracuse         8  950.7  932.2  18.5  0.99
 45.       Boston        21  934.7  951.0  -16.3  0.99
 46.   Cincinnati        26  970.5  955.1  15.4  0.99
 47.    Nashville        17  961.0  946.9  14.1  0.99
 48.   Providence         6  938.5  926.6  11.9  0.99
 49.   Youngstown        14  954.4  943.1  11.3  0.99
 50.        Utica         5  912.2  923.1  -10.9  1.00
 51.   KansasCity         7  919.7  929.6  -9.9  1.00
 52.       Dayton         6  936.2  926.6  9.6  1.00
 53.      Detroit        52  959.2  968.6  -9.4  1.00
 54.      Reading        11  946.2  938.4  7.8  1.00
 55.     Columbus        23  958.8  952.8  6.0  1.00
 56.   Washington        65  967.8  973.0  -5.2  1.00
 57.      StLouis        31  953.6  958.6  -5.0  1.00
 58.     NewHaven         4  923.2  918.7  4.5  1.00
 59.        Flint        11  941.2  938.4  2.8  1.00
 60.    FortWorth         1  891.7  891.8  -0.1  1.00
Figure 6.3, page 188.
format rweight %3.2f
graph twoway (scatter mort lnhc, mlabel(rweight) msymbol(i)) ///
	(line yhat lnhc), xlabel(0(2)6) ylabel(800(100)1100)
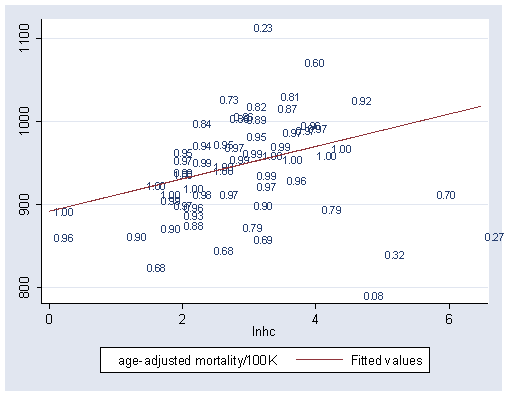
Figure 6.7, page 197.
NOTE: For the following figure, we are going to produce each graph manually. One can specify the graph option in the rreg command to get a slideshow of the changes in weights in the IRLS estimation.
use https://stats.idre.ucla.edu/stat/stata/examples/rwg/airpol, clear
Iteration 1
gen lnhc = ln(hc)
regress mort lnhc

  Source |       SS       df       MS                  Number of obs =      60
---------+------------------------------               F(  1,    58) =    1.35
   Model |  5179.87999     1  5179.87999               Prob > F      =  0.2506
Residual |  223117.041    58  3846.84554               R-squared     =  0.0227
---------+------------------------------               Adj R-squared =  0.0058
   Total |  228296.921    59  3869.43934               Root MSE      =  62.023

------------------------------------------------------------------------------
    mort |      Coef.   Std. Err.       t     P>|t|       [95% Conf. Interval]
---------+--------------------------------------------------------------------
    lnhc |   7.968576   6.867098      1.160   0.251      -5.777414    21.71457
   _cons |   918.4252   20.53273     44.730   0.000       877.3245    959.5259
------------------------------------------------------------------------------

predict e, resid
summarize e, detail

                          Residuals
-------------------------------------------------------------
      Percentiles      Smallest
 1%    -164.8106      -164.8106
 5%    -106.9425      -118.3275
10%    -76.94942      -108.2129       Obs                  60
25%    -40.61413       -105.672       Sum of Wgt.          60

50%     6.803905                      Mean           7.55e-08
                        Largest       Std. Dev.      61.49508
75%     40.52672        84.4721
90%     70.31952       87.77363       Variance       3781.645
95%     86.12286       122.6034       Skewness      -.0801513
99%     170.7031       170.7031       Kurtosis       3.362466
The median is the 50th percentile, 6.803905
gen m0=6.803905
gen ee=abs(e-m0)
summarize ee, detail
ee
-------------------------------------------------------------
Percentiles Smallest
1% 1.00688 1.00688
5% 2.174106 1.00688
10% 5.724127 1.863093 Obs 60
25% 20.17187 2.485118 Sum of Wgt. 60
50% 35.41085 Mean 47.77389
Largest Std. Dev. 38.82904
75% 65.78219 115.7995
90% 106.3564 125.1314 Variance 1507.694
95% 120.4655 163.8992 Skewness 1.190757
99% 171.6145 171.6145 Kurtosis 4.333584
gen m00=35.41085
gen s0=m00/.6745
gen es0=abs(e)/s0
gen w1=.
(60 missing values generated)
replace w1=1 if es0<=1.345
(48 real changes made)
replace w1=1.345/es0 if es0>1.345
(12 real changes made)
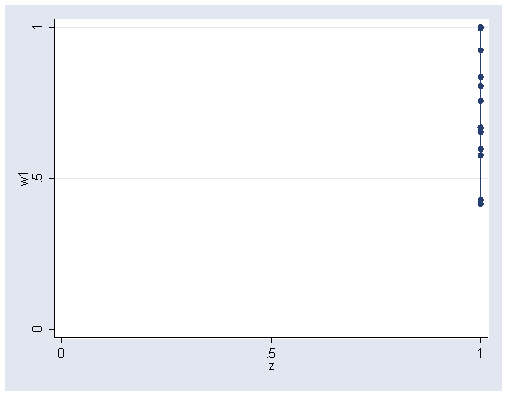
gen z=1
graph twoway scatter w1 z, connect(l) xlabel(0 .5 1) ylabel(0 .5 1)
Iteration 2
gen mortw1=mort*sqrt(w1)
gen lnhcw0=sqrt(w1)
gen lnhcw1=lnhc*sqrt(w1)
regress mortw1 lnhcw1 lnhcw0, nocons
Source | SS df MS Number of obs = 60
---------+------------------------------ F( 2, 58) = 8902.25
Model | 50024076.4 2 25012038.2 Prob > F = 0.0000
Residual | 162958.613 58 2809.63127 R-squared = 0.9968
---------+------------------------------ Adj R-squared = 0.9966
Total | 50187035.0 60 836450.584 Root MSE = 53.006
------------------------------------------------------------------------------
mortw1 | Coef. Std. Err. t P>|t| [95% Conf. Interval]
---------+--------------------------------------------------------------------
lnhcw1 | 12.08538 6.277814 1.925 0.059 -.4810322 24.65179
lnhcw0 | 908.4398 18.31743 49.594 0.000 871.7735 945.1061
------------------------------------------------------------------------------
predict e1, resid
gen e11=e1/lnhcw0
summarize e11, detail
e11
-------------------------------------------------------------
Percentiles Smallest
1% -173.9847 -173.9847
5% -113.1364 -128.8018
10% -78.96231 -124.8792 Obs 60
25% -40.35685 -101.3937 Sum of Wgt. 60
50% 4.943437 Mean -1.349338
Largest Std. Dev. 61.68531
75% 36.87691 80.45545
90% 65.34878 87.52921 Variance 3805.077
95% 83.99233 117.1047 Skewness -.2116352
99% 168.3556 168.3556 Kurtosis 3.577332
gen m1=4.943437
gen ee1=abs(e11-m1)
summarize ee1, detail
ee1
-------------------------------------------------------------
Percentiles Smallest
1% 1.16269 1.16269
5% 1.609889 1.162691
10% 3.902509 1.284287 Obs 60
25% 17.60206 1.935491 Sum of Wgt. 60
50% 33.28572 Mean 47.06011
Largest Std. Dev. 39.91437
75% 63.93033 129.8226
90% 102.2999 133.7453 Variance 1593.157
95% 131.7839 163.4122 Skewness 1.300015
99% 178.9281 178.9281 Kurtosis 4.602989
gen m11= 33.28572gen s1=m11/.6745
gen es1=abs(e11)/s1
gen w2=.
(60 missing values generated)
replace w2=1 if es1<=1.345
(48 real changes made)
replace w2=1.345/es1 if es1>1.345
(12 real changes made)
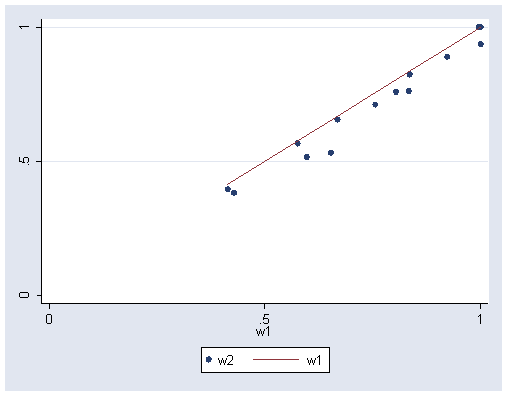
graph twoway (scatter w2 w1) (line w1 w1, sort), xlabel(0 .5 1) ylabel(0 .5 1)
Iteration 3
gen mortw2=mort*sqrt(w2)
gen lnhcw2=sqrt(w2)
gen lnhcw3=lnhc*sqrt(w2)
regress mortw2 lnhcw2 lnhcw3, nocons
Source | SS df MS Number of obs = 60
---------+------------------------------ F( 2, 58) = 9248.78
Model | 49588476.9 2 24794238.5 Prob > F = 0.0000
Residual | 155487.033 58 2680.81092 R-squared = 0.9969
---------+------------------------------ Adj R-squared = 0.9968
Total | 49743964.0 60 829066.066 Root MSE = 51.777
------------------------------------------------------------------------------
mortw2 | Coef. Std. Err. t P>|t| [95% Conf. Interval]
---------+--------------------------------------------------------------------
lnhcw2 | 905.4311 18.09045 50.050 0.000 869.2191 941.6431
lnhcw3 | 13.4653 6.237472 2.159 0.035 .9796466 25.95096
------------------------------------------------------------------------------
predict e2, resid
gen e22=e2/lnhcw2
summarize e22, detail
e22
-------------------------------------------------------------
Percentiles Smallest
1% -177.3981 -177.3981
5% -115.551 -132.6511
10% -79.9754 -130.804 Obs 60
25% -40.03335 -100.298 Sum of Wgt. 60
50% 4.820021 Mean -2.139968
Largest Std. Dev. 61.83381
75% 34.83411 78.77076
90% 64.34794 87.10891 Variance 3823.419
95% 82.93983 114.9232 Skewness -.2607152
99% 167.2305 167.2305 Kurtosis 3.656614
gen m2=4.820021
gen ee2=abs(e22-m2)
summarize ee2, detail
ee2
-------------------------------------------------------------
Percentiles Smallest
1% 1.339484 1.339484
5% 2.356566 1.339485
10% 4.189049 1.822319 Obs 60
25% 17.43784 2.890813 Sum of Wgt. 60
50% 32.98885 Mean 46.90808
Largest Std. Dev. 40.43538
75% 62.89881 135.624
90% 101.7788 137.4711 Variance 1635.02
95% 136.5476 162.4104 Skewness 1.342615
99% 182.2181 182.2181 Kurtosis 4.699437
gen m22=32.98885
gen s2=m22/.6745
gen es2=abs(e22)/s2
gen w3=.
(60 missing values generated)
replace w3=1 if es2<=1.345
(47 real changes made)
replace w3=1.345/es2 if es2>1.345
(13 real changes made)
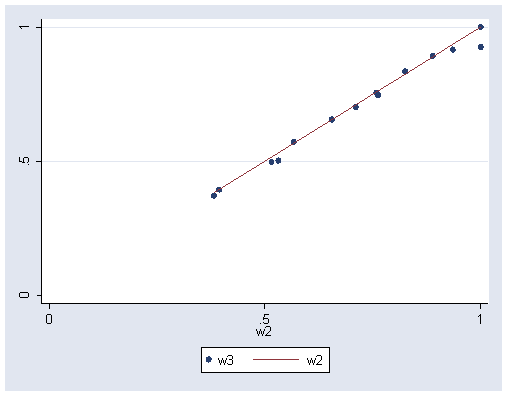
graph twoway (scatter w3 w2) (line w2 w2, sort), xlabel(0 .5 1) ylabel(0 .5 1)
Iteration 4
gen mortw3=mort*sqrt(w3)
gen lnhcw4=sqrt(w3)
gen lnhcw5=lnhc*sqrt(w3)
regress mortw3 lnhcw4 lnhcw5, nocons
Source | SS df MS Number of obs = 60
---------+------------------------------ F( 2, 58) = 9332.34
Model | 49471461.0 2 24735730.5 Prob > F = 0.0000
Residual | 153731.199 58 2650.53791 R-squared = 0.9969
---------+------------------------------ Adj R-squared = 0.9968
Total | 49625192.2 60 827086.537 Root MSE = 51.483
------------------------------------------------------------------------------
mortw3 | Coef. Std. Err. t P>|t| [95% Conf. Interval]
---------+--------------------------------------------------------------------
lnhcw4 | 904.103 18.09088 49.976 0.000 867.8902 940.3159
lnhcw5 | 14.08514 6.258612 2.251 0.028 1.557165 26.61311
------------------------------------------------------------------------------
predict e3, resid
gen e33=e3/lnhcw4
summarize e33, detail
e33
-------------------------------------------------------------
Percentiles Smallest
1% -178.9547 -178.9547
5% -116.6589 -134.4035
10% -80.97359 -133.4887 Obs 60
25% -39.90723 -99.82915 Sum of Wgt. 60
50% 4.111221 Mean -2.518487
Largest Std. Dev. 61.91423
75% 34.29168 77.99062
90% 64.13075 86.89668 Variance 3833.372
95% 82.44365 113.92 Skewness -.2834424
99% 166.7017 166.7017 Kurtosis 3.693297
gen m3=4.111221
gen ee3=abs(e33-m3)
summarize ee3, detail
ee3
-------------------------------------------------------------
Percentiles Smallest
1% .7889185 .7889185
5% 2.865521 .7889187
10% 4.604212 2.748589 Obs 60
25% 16.45549 2.982452 Sum of Wgt. 60
50% 33.48549 Mean 46.83978
Largest Std. Dev. 40.58225
75% 61.8055 137.5999
90% 100.9146 138.5147 Variance 1646.919
95% 138.0573 162.5905 Skewness 1.361655
99% 183.0659 183.0659 Kurtosis 4.749048
gen m33=33.48549
gen s3=m33/.6745
gen es3=abs(e33)/s3
gen w4=.
(60 missing values generated)
replace w4=1 if es3<=1.345
(46 real changes made)
replace w4=1.345/es3 if es3>1.345
(14 real changes made)
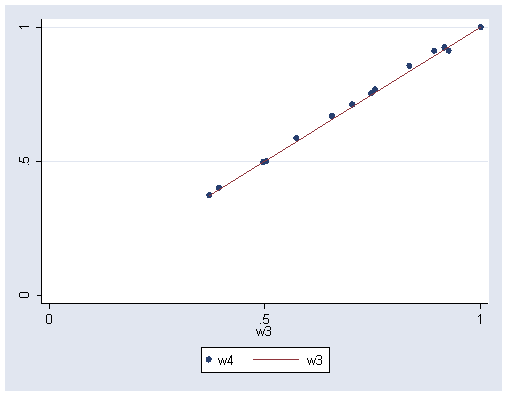
graph twoway (scatter w4 w3) (line w3 w3, sort), xlabel(0 .5 1) ylabel(0 .5 1)
Iteration 5 (change to biweight)
gen mortw4=mort*sqrt(w4)
gen lnhcw6=sqrt(w4)
gen lnhcw7=lnhc*sqrt(w4)
regress mortw4 lnhcw6 lnhcw7, nocons
Source | SS df MS Number of obs = 60
---------+------------------------------ F( 2, 58) = 9291.05
Model | 49565578.2 2 24782789.1 Prob > F = 0.0000
Residual | 154708.151 58 2667.38191 R-squared = 0.9969
---------+------------------------------ Adj R-squared = 0.9968
Total | 49720286.4 60 828671.44 Root MSE = 51.647
------------------------------------------------------------------------------
mortw4 | Coef. Std. Err. t P>|t| [95% Conf. Interval]
---------+--------------------------------------------------------------------
lnhcw6 | 903.8434 18.15556 49.783 0.000 867.5011 940.1857
lnhcw7 | 14.21256 6.283636 2.262 0.027 1.634493 26.79062
------------------------------------------------------------------------------
predict e4, resid
gen e44=e4/lnhcw6
summarize e44, detail
e44
-------------------------------------------------------------
Percentiles Smallest
1% -179.2881 -179.2881
5% -116.9001 -134.7772
10% -81.27055 -134.054 Obs 60
25% -39.77162 -99.74622 Sum of Wgt. 60
50% 3.95209 Mean -2.609724
Largest Std. Dev. 61.93181
75% 34.16674 77.81688
90% 64.08532 86.83968 Variance 3835.549
95% 82.32828 113.7003 Skewness -.2881632
99% 166.5795 166.5795 Kurtosis 3.700915
gen m4=3.95209
gen ee4=abs(e44-m4)
summarize ee4, detail
ee4
-------------------------------------------------------------
Percentiles Smallest
1% .6757395 .6757395
5% 2.970146 .67574
10% 4.538526 2.939001 Obs 60
25% 16.38228 3.00129 Sum of Wgt. 60
50% 33.58758 Mean 46.82574
Largest Std. Dev. 40.61432
75% 61.58075 138.0061
90% 100.737 138.7292 Variance 1649.523
95% 138.3677 162.6274 Skewness 1.365385
99% 183.2402 183.2402 Kurtosis 4.758903
gen m44=33.58758
gen s4=m44/.6745
gen es4=e44/s4
gen w5=.
(60 missing values generated)
replace w5=(1-(es4/4.685)^2)^2 if (abs(e44)/s4)<=4.685
(60 real changes made)
replace w5=0 if (abs(e44)/s4)>4.685
(0 real changes made)
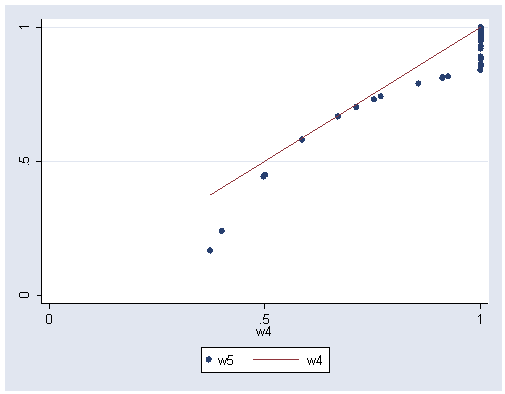
graph twoway (scatter w5 w4) (line w4 w4, sort), xlabel(0 .5 1) ylabel(0 .5 1)
Iteration 6
gen mortw5=mort*sqrt(w5)
gen lnhcw8=sqrt(w5)
gen lnhcw9=lnhc*sqrt(w5)
regress mortw5 lnhcw8 lnhcw9, nocons
Source | SS df MS Number of obs = 60
---------+------------------------------ F( 2, 58) =10199.02
Model | 46795992.5 2 23397996.2 Prob > F = 0.0000
Residual | 133060.189 58 2294.1412 R-squared = 0.9972
---------+------------------------------ Adj R-squared = 0.9971
Total | 46929052.7 60 782150.878 Root MSE = 47.897
------------------------------------------------------------------------------
mortw5 | Coef. Std. Err. t P>|t| [95% Conf. Interval]
---------+--------------------------------------------------------------------
lnhcw8 | 900.2209 17.37487 51.812 0.000 865.4413 935.0005
lnhcw9 | 15.63724 6.060739 2.580 0.012 3.505358 27.76913
------------------------------------------------------------------------------
predict e5, resid
gen e55=e5/lnhcw8
summarize e55, detail
e55
-------------------------------------------------------------
Percentiles Smallest
1% -182.296 -182.296
5% -118.1669 -139.6547
10% -83.87064 -138.2351 Obs 60
25% -37.53524 -98.09869 Sum of Wgt. 60
50% 2.892957 Mean -2.909743
Largest Std. Dev. 62.15267
75% 34.47182 76.59371
90% 64.29753 86.92204 Variance 3862.955
95% 81.75788 111.9643 Skewness -.3419659
99% 165.9341 165.9341 Kurtosis 3.78783
gen m5=2.892957
gen ee5=abs(e55-m5)
summarize ee5, detail
ee5
-------------------------------------------------------------
Percentiles Smallest
1% .589726 .589726
5% 2.40177 .5897262
10% 5.645023 1.591628 Obs 60
25% 16.05141 3.211911 Sum of Wgt. 60
50% 32.65288 Mean 46.70808
Largest Std. Dev. 40.97041
75% 61.40457 141.1281
90% 98.751 142.5477 Variance 1678.574
95% 141.8379 163.0411 Skewness 1.408325
99% 185.1889 185.1889 Kurtosis 4.871201
gen m55=32.65288
gen s5=m55/.6745
gen es5=e55/s5
gen w6=.
(60 missing values generated)
replace w6=(1-(es5/4.685)^2)^2 if (abs(e55)/s5)<=4.685
(60 real changes made)
replace w6=0 if (abs(e55)/s5)>4.685
(0 real changes made)
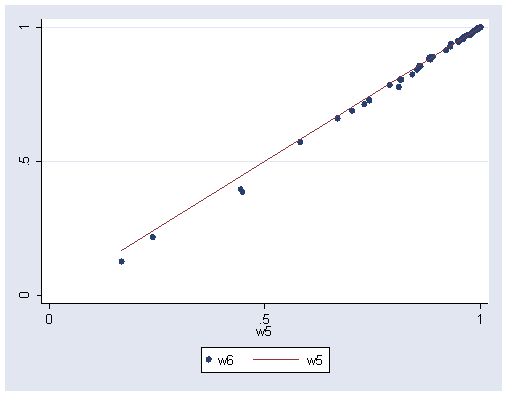
graph twoway (scatter w6 w5) (line w5 w5, sort), xlabel(0 .5 1) ylabel(0 .5 1)
Iteration 7 (Note that iterations 7 and 8 are not graphed in the book.)
gen mortw6=mort*sqrt(w6)
gen lnhcw10=sqrt(w6)
gen lnhcw11=lnhc*sqrt(w6)
regress mortw6 lnhcw10 lnhcw11, nocons

  Source |       SS       df       MS                  Number of obs =      60
---------+------------------------------               F(  2,    58) =10569.43
   Model |  46495826.3     2  23247913.2               Prob > F      =  0.0000
Residual |  127573.451    58  2199.54225               R-squared     =  0.9973
---------+------------------------------               Adj R-squared =  0.9972
   Total |  46623399.8    60  777056.663               Root MSE      =  46.899

------------------------------------------------------------------------------
  mortw6 |      Coef.   Std. Err.       t     P>|t|       [95% Conf. Interval]
---------+--------------------------------------------------------------------
 lnhcw10 |   897.4257   17.15824     52.303   0.000       863.0798    931.7717
 lnhcw11 |   16.85949   6.015829      2.803   0.007       4.817501    28.90148
------------------------------------------------------------------------------

predict e6, resid
gen e66=e6/lnhcw10
summarize e66, detail

                             e66
-------------------------------------------------------------
      Percentiles      Smallest
 1%    -185.1891      -185.1891
 5%    -119.2561      -144.7722
10%      -86.414      -141.5143       Obs                  60
25%    -35.92926      -96.99795       Sum of Wgt.          60

50%     2.874535                      Mean          -3.479797
                        Largest       Std. Dev.       62.3774
75%     34.60612       75.23182
90%     64.16693       86.67999       Variance        3890.94
95%     80.95591       110.1623       Skewness      -.3894314
99%     165.0678       165.0678       Kurtosis       3.864709

gen m6=2.874535
gen ee6=abs(e66-m6)
summarize ee6, detail

                             ee6
-------------------------------------------------------------
      Percentiles      Smallest
 1%     .4724467       .4724467
 5%     3.736962       .4724476
10%     5.664235        2.87833       Obs                  60
25%     15.30565       4.595593       Sum of Wgt.          60

50%       31.832                      Mean           46.64581
                        Largest       Std. Dev.      41.46435
75%      61.2924       144.3889
90%     98.25005       147.6468       Variance       1719.292
95%     146.0178       162.1933       Skewness       1.450591
99%     188.0636       188.0636       Kurtosis       4.977333

gen m66=31.832
gen s6=m66/.6745
gen es6=e66/s6
gen w7=.
(60 missing values generated)

replace w7=(1-(es6/4.685)^2)^2 if (abs(e66)/s6)<=4.685
(60 real changes made)

replace w7=0 if (abs(e66)/s6)>4.685
(0 real changes made)
Iteration 8
gen mortw7=mort*sqrt(w7)
gen lnhcw12=sqrt(w7)
gen lnhcw13=lnhc*sqrt(w7)
regress mortw7 lnhcw12 lnhcw13, nocons

  Source |       SS       df       MS                  Number of obs =      60
---------+------------------------------               F(  2,    58) =10952.16
   Model |  46220949.9     2  23110475.0               Prob > F      =  0.0000
Residual |  122387.492    58  2110.12917               R-squared     =  0.9974
---------+------------------------------               Adj R-squared =  0.9973
   Total |  46343337.4    60  772388.957               Root MSE      =  45.936

------------------------------------------------------------------------------
  mortw7 |      Coef.   Std. Err.       t     P>|t|       [95% Conf. Interval]
---------+--------------------------------------------------------------------
 lnhcw12 |   894.7121   16.95266     52.777   0.000       860.7777    928.6466
 lnhcw13 |   18.07344   5.972631      3.026   0.004       6.117918    30.02896
------------------------------------------------------------------------------

predict e7, resid
gen e77=e7/lnhcw12
summarize e77, detail

                             e77
-------------------------------------------------------------
      Percentiles      Smallest
 1%    -188.1251      -188.1251
 5%    -120.4005      -149.9176
10%    -89.00262      -144.8338       Obs                  60
25%    -34.39677      -95.96723       Sum of Wgt.          60

50%     3.291201                      Mean          -4.108537
                        Largest       Std. Dev.      62.63243
75%     33.61028       73.81649
90%     63.97465       86.37708       Variance       3922.822
95%     80.09678       108.3101       Skewness      -.4375264
99%     164.1446       164.1446       Kurtosis       3.942903

gen m7=3.291201
gen ee7=abs(e77-m7)
summarize ee7, detail

                             ee7
-------------------------------------------------------------
      Percentiles      Smallest
 1%     .1415799       .1415799
 5%     4.492992       .1415806
10%     6.058385       4.127497       Obs                  60
25%      15.0027       4.858488       Sum of Wgt.          60

50%     32.00533                      Mean           46.59337
                        Largest       Std. Dev.       42.0805
75%     60.68345        148.125
90%     98.24997       153.2088       Variance       1770.768
95%     150.6669       160.8534       Skewness       1.492862
99%     191.4163       191.4163       Kurtosis       5.089983

gen m77=32.00533
gen s7=m77/.6745
gen es7=e77/s7
gen w8=.
(60 missing values generated)

replace w8=(1-(es7/4.685)^2)^2 if (abs(e77)/s7)<=4.685
(60 real changes made)

replace w8=0 if (abs(e77)/s7)>4.685
(0 real changes made)
Iteration 9
gen mortw8=mort*sqrt(w8)
gen lnhcw14=sqrt(w8)
gen lnhcw15=lnhc*sqrt(w8)
regress mortw8 lnhcw14 lnhcw15, nocons
Source | SS df MS Number of obs = 60
---------+------------------------------ F( 2, 58) =11032.70
Model | 46288732.5 2 23144366.2 Prob > F = 0.0000
Residual | 121672.237 58 2097.79719 R-squared = 0.9974
---------+------------------------------ Adj R-squared = 0.9973
Total | 46410404.7 60 773506.745 Root MSE = 45.802
------------------------------------------------------------------------------
mortw8 | Coef. Std. Err. t P>|t| [95% Conf. Interval]
---------+--------------------------------------------------------------------
lnhcw14 | 893.1722 16.95102 52.691 0.000 859.2411 927.1034
lnhcw15 | 18.78453 5.985631 3.138 0.003 6.802987 30.76607
------------------------------------------------------------------------------
predict e8, resid
gen e88=e8/lnhcw14
summarize e88, detail
e88
-------------------------------------------------------------
Percentiles Smallest
1% -189.8946 -189.8946
5% -121.1205 -152.9813
10% -90.56861 -146.8279 Obs 60
25% -33.54876 -95.41312 Sum of Wgt. 60
50% 3.485634 Mean -4.526487
Largest Std. Dev. 62.79643
75% 32.97723 72.93785
90% 63.81236 86.14997 Variance 3943.392
95% 79.54391 107.1754 Skewness -.4660449
99% 163.5544 163.5544 Kurtosis 3.989447
gen m8=3.485634
gen ee8=abs(e88-m8)
summarize ee8, detail
ee8
-------------------------------------------------------------
Percentiles Smallest
1% .5012119 .5012119
5% 3.871048 .5012128
10% 6.578306 3.243295 Obs 60
25% 14.83559 4.4988 Sum of Wgt. 60
50% 32.01626 Mean 46.58111
Largest Std. Dev. 42.45112
75% 60.54584 150.3135
90% 98.25001 156.4669 Variance 1802.098
95% 153.3902 160.0687 Skewness 1.518493
99% 193.3803 193.3803 Kurtosis 5.161077
gen m88=32.01626
gen s8=m88/.6745
gen es8=e88/s8
gen w9=.
(60 missing values generated)
replace w9=(1-(es8/4.685)^2)^2 if (abs(e88)/s8)<=4.685
(60 real changes made)
replace w9=0 if (abs(e88)/s8)>4.685
(0 real changes made)
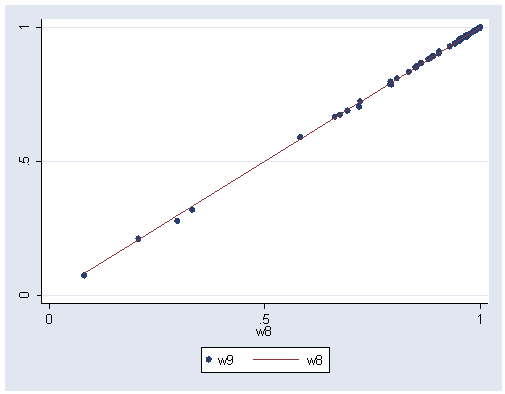
graph twoway (scatter w9 w8) (line w8 w8, sort), xlabel(0 .5 1) ylabel(0 .5 1)
Iteration 10
gen mortw9=mort*sqrt(w9)
gen lnhcw16=sqrt(w9)
gen lnhcw17=lnhc*sqrt(w9)
regress mortw9 lnhcw16 lnhcw17, nocons
Source | SS df MS Number of obs = 60
---------+------------------------------ F( 2, 58) =11114.84
Model | 46295327.8 2 23147663.9 Prob > F = 0.0000
Residual | 120790.281 58 2082.59105 R-squared = 0.9974
---------+------------------------------ Adj R-squared = 0.9973
Total | 46416118.0 60 773601.967 Root MSE = 45.635
------------------------------------------------------------------------------
mortw9 | Coef. Std. Err. t P>|t| [95% Conf. Interval]
---------+--------------------------------------------------------------------
lnhcw16 | 892.1295 16.92993 52.695 0.000 858.2405 926.0184
lnhcw17 | 19.26631 5.987742 3.218 0.002 7.280545 31.25208
------------------------------------------------------------------------------
predict e9, resid
gen e99=e9/lnhcw16
summarize e99, detail
e99
-------------------------------------------------------------
Percentiles Smallest
1% -191.0941 -191.0941
5% -121.6088 -155.0575
10% -91.63017 -148.1794 Obs 60
25% -32.97474 -95.03825 Sum of Wgt. 60
50% 3.61685 Mean -4.810208
Largest Std. Dev. 62.91361
75% 32.54779 72.342
90% 63.70186 85.99552 Variance 3958.123
95% 79.16876 106.4061 Skewness -.4854825
99% 163.1539 163.1539 Kurtosis 4.021253
gen m9=3.61685
gen ee9=abs(e99-m9)
summarize ee9, detail
ee9
-------------------------------------------------------------
Percentiles Smallest
1% .7448692 .7448692
5% 3.345251 .7448692
10% 6.870948 2.644254 Obs 60
25% 14.72238 4.046248 Sum of Wgt. 60
50% 32.31808 Mean 46.5728
Largest Std. Dev. 42.71478
75% 60.51368 151.7963
90% 98.25004 158.6744 Variance 1824.553
95% 155.2353 159.537 Skewness 1.535109
99% 194.711 194.711 Kurtosis 5.209073
gen m99=32.31808
gen s9=m99/.6745
gen es9=e99/s9
gen w10=.
(60 missing values generated)
replace w10=(1-(es9/4.685)^2)^2 if (abs(e99)/s9)<=4.685
(60 real changes made)
replace w10=0 if (abs(e99)/s9)>4.685
(0 real changes made)
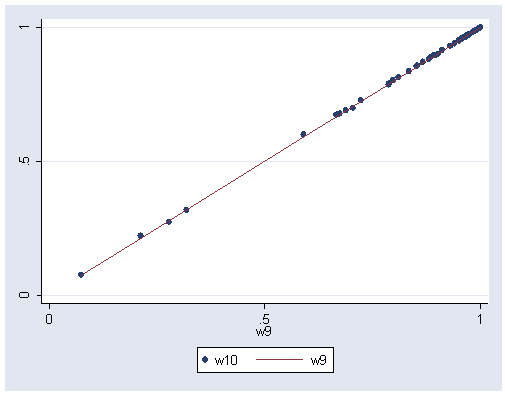
graph twoway (scatter w10 w9) (line w9 w9, sort), xlabel(0 .5 1) ylabel(0 .5 1)
Iteration 11
gen mortw10=mort*sqrt(w10)
gen lnhcw18=sqrt(w10)
gen lnhcw19=lnhc*sqrt(w10)
regress mortw10 lnhcw18 lnhcw19, nocons

  Source |       SS       df       MS                  Number of obs =      60
---------+------------------------------               F(  2,    58) =11069.26
   Model |  46399353.4     2  23199676.7               Prob > F      =  0.0000
Residual |  121560.159    58  2095.86482               R-squared     =  0.9974
---------+------------------------------               Adj R-squared =  0.9973
   Total |  46520913.5    60  775348.559               Root MSE      =  45.781

------------------------------------------------------------------------------
 mortw10 |      Coef.   Std. Err.       t     P>|t|       [95% Conf. Interval]
---------+--------------------------------------------------------------------
 lnhcw18 |   891.8404   16.97908     52.526   0.000       857.8531    925.8278
 lnhcw19 |   19.41061   6.006624      3.232   0.002       7.387048    31.43418
------------------------------------------------------------------------------

predict e10, resid
gen e1010=e10/lnhcw18
summarize e1010, detail

                            e1010
-------------------------------------------------------------
      Percentiles      Smallest
 1%    -191.4766      -191.4766
 5%    -121.7784      -155.7027
10%    -91.97139      -148.6076       Obs                  60
25%    -32.82613      -94.94926       Sum of Wgt.          60

50%     3.632838                      Mean          -4.918479
                        Largest       Std. Dev.      62.94965
75%      32.3959       72.14027
90%     63.64549         85.926       Variance       3962.659
95%     79.03314       106.1523       Skewness      -.4913203
99%     163.0105       163.0105       Kurtosis       4.030817

gen m10=3.632838
gen ee10=abs(e1010-m10)
summarize ee10, detail

                            ee10
-------------------------------------------------------------
      Percentiles      Smallest
 1%     .8178842       .8178842
 5%     3.119054       .8178847
10%     6.824313       2.464844       Obs                  60
25%     14.68851       3.773263       Sum of Wgt.          60

50%     32.40845                      Mean           46.57032
                        Largest       Std. Dev.      42.79567
75%     60.50405       152.2404
90%     98.25003       159.3355       Variance        1831.47
95%     155.7879       159.3777       Skewness       1.539966
99%     195.1095       195.1095       Kurtosis         5.2234

gen m1010=32.40845
gen s10=m1010/.6745
gen es10=e1010/s10
gen w11=.
(60 missing values generated)

replace w11=(1-(es10/4.685)^2)^2 if (abs(e1010)/s10)<=4.685
(60 real changes made)

replace w11=0 if (abs(e1010)/s10)>4.685
(0 real changes made)

graph twoway (scatter w11 w10) (line w10 w10, sort), xlabel(0 .5 1) ylabel(0 .5 1)

Figure 6.8, page 197.
rreg mort lnhc

   Huber iteration 1:  maximum difference in weights = .58511763
   Huber iteration 2:  maximum difference in weights = .12109939
   Huber iteration 3:  maximum difference in weights = .07054585
   Huber iteration 4:  maximum difference in weights = .02080019
Biweight iteration 5:  maximum difference in weights = .20680335
Biweight iteration 6:  maximum difference in weights = .06324705
Biweight iteration 7:  maximum difference in weights = .05913415
Biweight iteration 8:  maximum difference in weights = .02922746
Biweight iteration 9:  maximum difference in weights = .01978239
Biweight iteration 10:  maximum difference in weights = .01178611
Biweight iteration 11:  maximum difference in weights = .0036652

Robust regression estimates                            Number of obs =      60
                                                       F(  1,    58) =    8.81
                                                       Prob > F      =  0.0043

------------------------------------------------------------------------------
    mort |      Coef.   Std. Err.       t     P>|t|       [95% Conf. Interval]
---------+--------------------------------------------------------------------
    lnhc |   19.45727   6.553716      2.969   0.004       6.338583    32.57596
   _cons |     891.75   19.59571     45.507   0.000        852.525    930.9751
------------------------------------------------------------------------------

predict e15, r
gen se=e15/48.09
sort se
graph twoway scatter w11 se, xlabel(-5(1)5) ylabel(0(.2)1) xline(0)
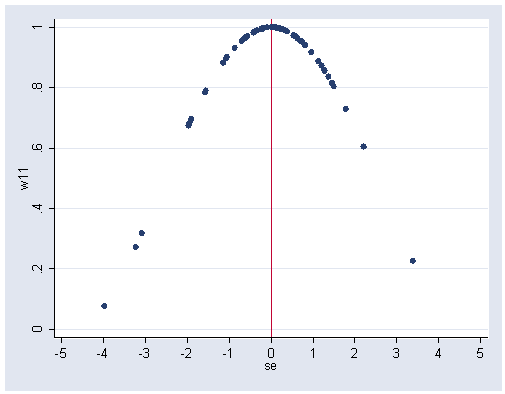
Figure 6.9, page 202.
Note: The robust regression line for this graph does not match the book. Further, the next Figure does match when the two outlying points are removed.
use https://stats.idre.ucla.edu/stat/stata/examples/rwg/airpol, clear

regress mort hc

  Source |       SS       df       MS                  Number of obs =      60
---------+------------------------------               F(  1,    58) =    1.88
   Model |   7181.1855     1   7181.1855               Prob > F      =  0.1752
Residual |  221115.736    58  3812.34027               R-squared     =  0.0315
---------+------------------------------               Adj R-squared =  0.0148
   Total |  228296.921    59  3869.43934               Root MSE      =  61.744

------------------------------------------------------------------------------
    mort |      Coef.   Std. Err.       t     P>|t|       [95% Conf. Interval]
---------+--------------------------------------------------------------------
      hc |  -.1199471   .0873952     -1.372   0.175      -.2948875    .0549934
   _cons |    944.905   8.630252    109.488   0.000       927.6297    962.1803
------------------------------------------------------------------------------

predict h, leverage
rreg mort hc, genwt(tempwt)

   Huber iteration 1:  maximum difference in weights = .47764579
   Huber iteration 2:  maximum difference in weights = .01386864
Biweight iteration 3:  maximum difference in weights = .15809529
Biweight iteration 4:  maximum difference in weights = .00210305

Robust regression estimates                            Number of obs =      60
                                                       F(  1,    58) =    1.63
                                                       Prob > F      =  0.2075

------------------------------------------------------------------------------
    mort |      Coef.   Std. Err.       t     P>|t|       [95% Conf. Interval]
---------+--------------------------------------------------------------------
      hc |  -.1138386    .089299     -1.275   0.207      -.2925899    .0649127
   _cons |   944.1757   8.818254    107.071   0.000        926.524    961.8273
------------------------------------------------------------------------------

predict yhat2
sort hc
. graph twoway (scatter mort hc) (lfit mort hc) (line yhat2 hc)
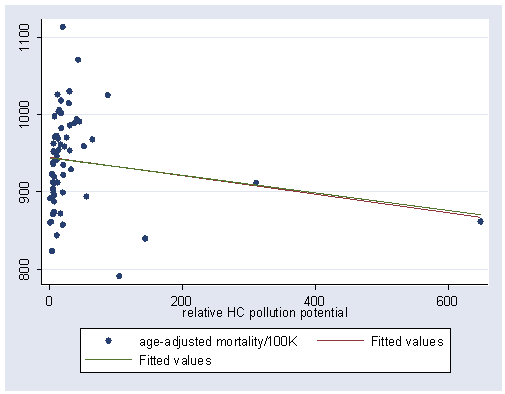
Figure 6.10, page 202.
drop if h>=.166
(2 observations deleted)

regress mort hc

  Source |       SS       df       MS                  Number of obs =      58
---------+------------------------------               F(  1,    56) =    0.04
   Model |  157.327497     1  157.327497               Prob > F      =  0.8424
Residual |  220947.205    56   3945.4858               R-squared     =  0.0007
---------+------------------------------               Adj R-squared = -0.0171
   Total |  221104.532    57  3879.02688               Root MSE      =  62.813

------------------------------------------------------------------------------
    mort |      Coef.   Std. Err.       t     P>|t|       [95% Conf. Interval]
---------+--------------------------------------------------------------------
      hc |  -.0636877    .318936     -0.200   0.842      -.7025932    .5752178
   _cons |   943.6545   10.95789     86.116   0.000       921.7032    965.6057
------------------------------------------------------------------------------

rreg mort hc

   Huber iteration 1:  maximum difference in weights = .63453732
   Huber iteration 2:  maximum difference in weights = .23102242
   Huber iteration 3:  maximum difference in weights = .04856842
Biweight iteration 4:  maximum difference in weights = .26244177
Biweight iteration 5:  maximum difference in weights = .10250554
Biweight iteration 6:  maximum difference in weights = .01126607
Biweight iteration 7:  maximum difference in weights = .00181083

Robust regression estimates                            Number of obs =      57
                                                       F(  1,    55) =   15.93
                                                       Prob > F      =  0.0002

------------------------------------------------------------------------------
    mort |      Coef.   Std. Err.       t     P>|t|       [95% Conf. Interval]
---------+--------------------------------------------------------------------
      hc |   1.408462   .3529216      3.991   0.000       .7011917    2.115733
   _cons |    918.531   10.21261     89.941   0.000       898.0645    938.9975
------------------------------------------------------------------------------

predict yhat6
graph twoway (scatter mort hc) (lfit mort hc) (line yhat6 hc, sort), ///
	xlabel(0(50)150) ylabel(800(100)1100)
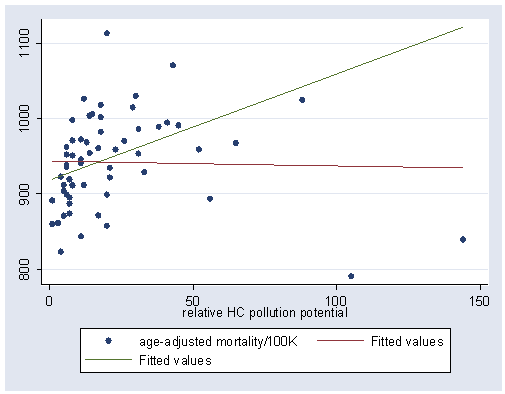
Figure 6.11, page 204.
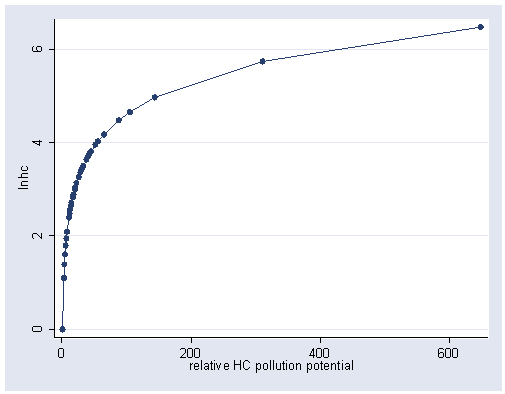
use https://stats.idre.ucla.edu/stat/stata/examples/rwg/airpol, clear

gen lnhc = ln(hc)
graph twoway scatter lnhc hc, connect(l) sort xlabel(0(200)600) ylabel(0(2)6)
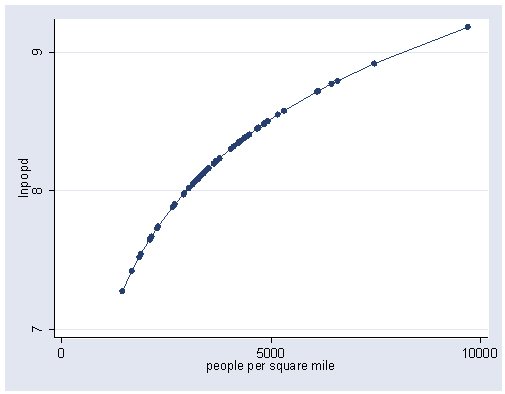
gen lnpopd = ln(popden)
graph twoway scatter lnpopd popden, connect(l) sort xlabel(0 5000 10000) ylabel(7 8 9)
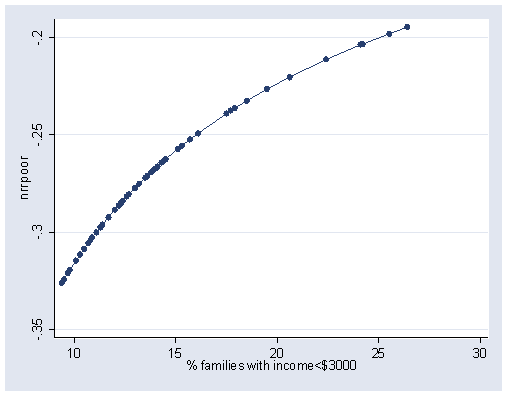
gen nrrpoor = -(1/(sqrt(poor)))
graph  twoway scatter nrrpoor poor, connect(l) sort xlabel(10(5)30) ylabel(-.35(.05)-.2)
gen srnonw = sqrt(nonw)
graph twoway scatter  srnonw nonw, connect(l) sort xlabel(0(10)40) ylabel(0(2)6)
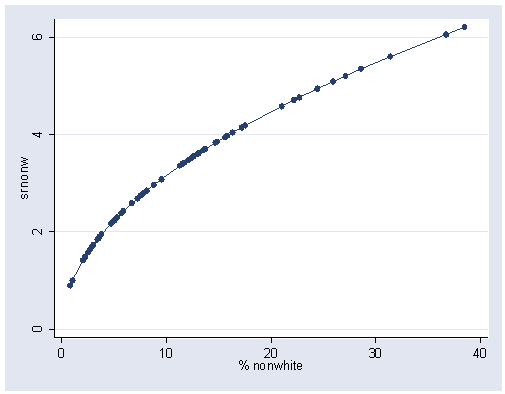
Figure 6.12, page 205.
regress mort rain jan educ srnonw

  Source |       SS       df       MS                  Number of obs =      60
---------+------------------------------               F(  4,    55) =   26.00
   Model |  149326.539     4  37331.6348               Prob > F      =  0.0000
Residual |  78970.3819    55  1435.82513               R-squared     =  0.6541
---------+------------------------------               Adj R-squared =  0.6289
   Total |  228296.921    59  3869.43934               Root MSE      =  37.892

------------------------------------------------------------------------------
    mort |      Coef.   Std. Err.       t     P>|t|       [95% Conf. Interval]
---------+--------------------------------------------------------------------
    rain |   1.038763   .5972583      1.739   0.088      -.1581692    2.235696
     jan |    -1.9212   .5579225     -3.443   0.001      -3.039302   -.8030985
    educ |  -21.13074   6.844689     -3.087   0.003       -34.8478   -7.413674
  srnonw |   32.40913   4.662617      6.951   0.000       23.06503    41.75322
   _cons |   1094.805   86.29434     12.687   0.000       921.8676    1267.743
------------------------------------------------------------------------------
avplot lnhc, mlabel(smsa) msymbol(i) xlabel(-4(2)2) ylabel(-100(50)50)
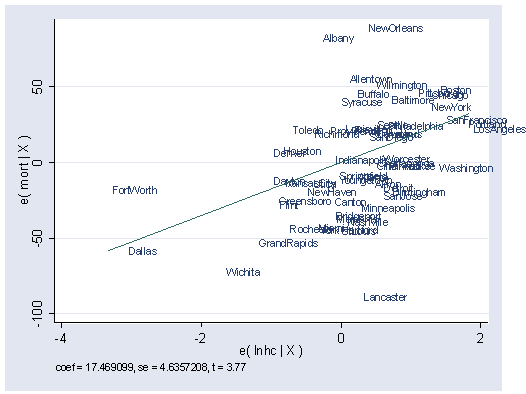
Figure 6.13, page 206.
use https://stats.idre.ucla.edu/stat/stata/examples/rwg/airpol, clear

gen lnhc=log(hc)
gen srnonw=sqrt(nonw)
rreg mort lnhc  rain jan educ srnonw, genwt(rweight)

   Huber iteration 1:  maximum difference in weights = .45915614
   Huber iteration 2:  maximum difference in weights = .04128307
Biweight iteration 3:  maximum difference in weights = .14223798
Biweight iteration 4:  maximum difference in weights = .00447933

Robust regression estimates                            Number of obs =      60
                                                       F(  5,    54) =   28.12
                                                       Prob > F      =  0.0000

------------------------------------------------------------------------------
    mort |      Coef.   Std. Err.       t     P>|t|       [95% Conf. Interval]
---------+--------------------------------------------------------------------
    lnhc |   17.76648   4.625325      3.841   0.000       8.493262     27.0397
    rain |   2.317299   .6382043      3.631   0.001       1.037776    3.596821
     jan |  -2.110483   .5029979     -4.196   0.000      -3.118933   -1.102033
    educ |  -19.10964   6.190165     -3.087   0.003      -31.52017   -6.699102
  srnonw |   26.21364    4.38846      5.973   0.000       17.41531    35.01197
   _cons |   1001.758   82.48887     12.144   0.000       836.3781    1167.139
------------------------------------------------------------------------------

predict e, r
gen e1=e/48.09
sort e1
graph twoway scatter rweight e1, connect(l) xlabel(-5(1)5) ylabel(0(.2)1) xline(0)
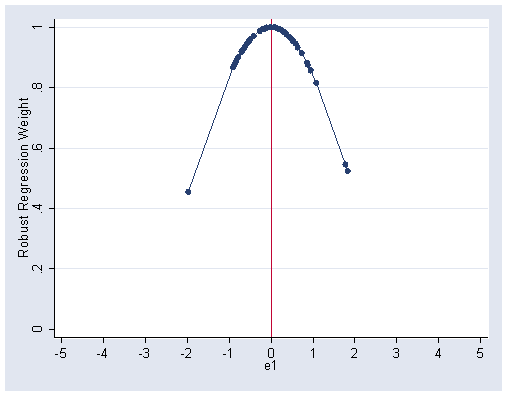
Table 6.3, page 206.
use https://stats.idre.ucla.edu/stat/stata/examples/rwg/airpol, clear

gen lnhc = ln(hc)
gen srnonw = sqrt(nonw)
regress mort lnhc rain jan educ srnonw

  Source |       SS       df       MS                  Number of obs =      60
---------+------------------------------               F(  5,    54) =   28.63
   Model |  165769.597     5  33153.9194               Prob > F      =  0.0000
Residual |  62527.3244    54  1157.91341               R-squared     =  0.7261
---------+------------------------------               Adj R-squared =  0.7008
   Total |  228296.921    59  3869.43934               Root MSE      =  34.028

------------------------------------------------------------------------------
    mort |      Coef.   Std. Err.       t     P>|t|       [95% Conf. Interval]
---------+--------------------------------------------------------------------
    lnhc |    17.4691   4.635721      3.768   0.000       8.175039    26.76316
    rain |   2.352107   .6396387      3.677   0.001       1.069709    3.634505
     jan |    -2.1316   .5041284     -4.228   0.000      -3.142316   -1.120883
    educ |  -17.95806   6.204078     -2.895   0.005      -30.39649   -5.519631
  srnonw |    27.3349   4.398323      6.215   0.000        18.5168    36.15301
   _cons |    986.261   82.67427     11.929   0.000        820.509    1152.013
------------------------------------------------------------------------------

predict h, leverage
format h %3.2f
list smsa h if h>.23

             smsa    h
 16.       Dallas  0.23
 21.    FortWorth  0.25
 29.   LosAngeles  0.28
 32.        Miami  0.36
 46.     SanDiego  0.25
Table 6.14, page 209.
use https://stats.idre.ucla.edu/stat/stata/examples/rwg/bays, clear

list bay pcb84 pcb85

                         bay      pcb84      pcb85
  1.               Casco Bay      95.28      77.55
  2.         Merrimack River      52.97      29.23
  3.            Salem Harbor     533.58      403.1
  4.           Boston Harbor   17104.86        736
  5.           Buzzards' Bay     308.46     192.15
  6.        Narragansett Bay     159.96      220.6
  7.  East Long Island Sound         10       8.62
  8.  West Long Island Sound     234.43     174.31
  9.             Raritan Bay     443.89     529.28
 10.            Delaware Bay        2.5     130.67
 11.    Lower Chesapeake Bay         51      39.74
 12.          Pamilico Sound          0          0
 13.       Charleston Harbor        9.1       8.43
 14.            Sapelo Sound          0          0
 15.         St. Johns River        140     120.04
 16.               Tampa Bay          0          0
 17.        Apalachicola Bay         12      11.93
 18.              Mobile Bay          0          0
 19.            Round Island          0          0
 20. Mississippi River Delta         34      30.14
 21.           Barataria Bay          0          0
 22.         San Antonio Bay          0          0
 23.      Corpus Christi Bay          0          0
 24.        San Diego Harbor      422.1     531.67
 25.           San Diego Bay       6.74        9.3
 26.              Dana Point       7.06       5.74
 27.              Seal Beach      46.71      46.47
 28.        San Pedro Canyon     159.56      176.9
 29.        Santa Monica Bay         14      13.69
 30.              Bodega Bay       4.18       4.89
 31.                Coos Bay       3.19        6.6
 32.    Columbia River Mouth       8.77       6.73
 33.         Nisqually Beach       4.23       4.28
 34.        Commencement Bay       20.6       20.5
 35.             Elliott Bay     329.97      414.5
 36.             Lutak Inlet        5.5        5.8
 37.               Nahku Bay        6.6       5.08
Figure 6.15, page 210.
use https://stats.idre.ucla.edu/stat/stata/examples/rwg/bays, clear

qreg pcb85 pcb84

Iteration  1:  WLS sum of weighted deviations =  3864.9265

Iteration  1: sum of abs. weighted deviations =  16672.456
Iteration  2: sum of abs. weighted deviations =  4312.7581
Iteration  3: sum of abs. weighted deviations =  2969.6801

Median regression                                    Number of obs =        37
  Raw sum of deviations  3821.07 (about 11.93)
  Min sum of deviations  2969.68                     Pseudo R2     =    0.2228

------------------------------------------------------------------------------
   pcb85 |      Coef.   Std. Err.       t     P>|t|       [95% Conf. Interval]
---------+--------------------------------------------------------------------
   pcb84 |   .0425018   .0005854     72.608   0.000       .0413134    .0436901
   _cons |   9.013539     9.6191      0.937   0.355      -10.51427    28.54135
------------------------------------------------------------------------------

predict h1
graph twoway (scatter pcb85 pcb84) (lfit pcb85 pcb84) (line h1 pcb84, sort), ///
	xlabel(0(4000)16000) ylabel(0(200)800)
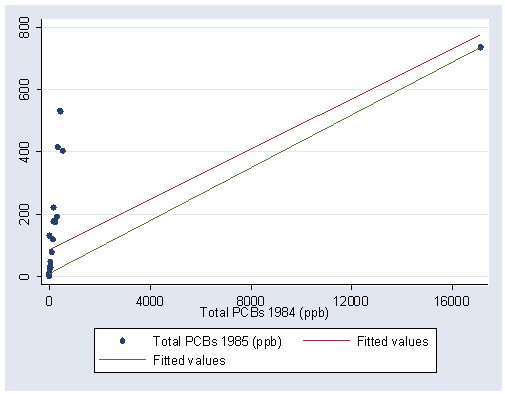
Figure 6.16, page 210.
NOTE: The prediction for id #4 is far above the highest point on the scale and is excluded from this analysis so that the line shown in the text can be produced.
use https://stats.idre.ucla.edu/stat/stata/examples/rwg/bays, clear

regress pcb85 pcb84

  Source |       SS       df       MS                  Number of obs =      37
---------+------------------------------               F(  1,    35) =   21.77
   Model |  462349.858     1  462349.858               Prob > F      =  0.0000
Residual |  743254.192    35  21235.8341               R-squared     =  0.3835
---------+------------------------------               Adj R-squared =  0.3659
   Total |  1205604.05    36  33489.0014               Root MSE      =  145.73

------------------------------------------------------------------------------
   pcb85 |      Coef.   Std. Err.       t     P>|t|       [95% Conf. Interval]
---------+--------------------------------------------------------------------
   pcb84 |   .0404537   .0086698      4.666   0.000       .0228532    .0580543
   _cons |    85.0138   24.42159      3.481   0.001       35.43533    134.5923
------------------------------------------------------------------------------

predict h, leverage
summarize h, detail

                          Leverage
-------------------------------------------------------------
      Percentiles      Smallest
 1%     .0270276       .0270276
 5%     .0270645       .0270645
10%     .0271934       .0270821       Obs                  37
25%     .0277486       .0271934       Sum of Wgt.          37

50%     .0280503                      Mean           .0540541
                        Largest       Std. Dev.      .1594038
75%     .0280756       .0280853
90%     .0280853       .0280853       Variance       .0254096
95%     .0280853       .0280853       Skewness       5.833291
99%     .9974615       .9974615       Kurtosis       35.02746
Note that the 90th percentile is .0280853
gen wh=.
(37 missing values generated)

replace wh=1 if h<=.0280853
(36 real changes made)

replace wh=(.0280853/h)^2 if h>.0280853
(1 real change made)

qreg pcb85 pcb84 [aw=wh]
(sum of wgt is  3.6001e+001)
Iteration  1:  WLS sum of weighted deviations =  13713.003

(sum of wgt is  3.6001e+001)
Iteration  1: sum of abs. weighted deviations =  1122.2417
Iteration  2: sum of abs. weighted deviations =  942.67567
Iteration  3: sum of abs. weighted deviations =  921.36162
Iteration  4: sum of abs. weighted deviations =  921.36163

Median regression                                    Number of obs =        37
  Raw sum of deviations 3183.548 (about 11.93)
  Min sum of deviations 921.3616                     Pseudo R2     =    0.7106

------------------------------------------------------------------------------
   pcb85 |      Coef.   Std. Err.       t     P>|t|       [95% Conf. Interval]
---------+--------------------------------------------------------------------
   pcb84 |    .994862   .0009638   1032.218   0.000       .9929053    .9968186
   _cons |  -7.92e-07   .1708606      0.000   1.000      -.3468662    .3468646
------------------------------------------------------------------------------

predict yhat3 if id~=4
(option xb assumed; fitted values)
(1 missing value generated)

graph twoway (scatter pcb85 pcb84) (line yhat3 pcb84, sort) ///
	(scatter pcb85 pcb84 if pcb84 >= 16000, mlabel(bay) mlabposition(9)), ///
	xlabel(0(4000)16000) ylabel(0(200)800)
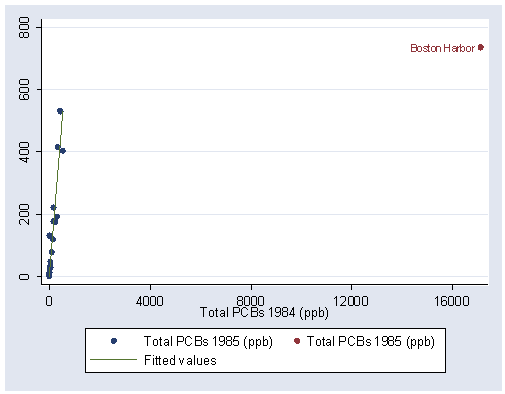
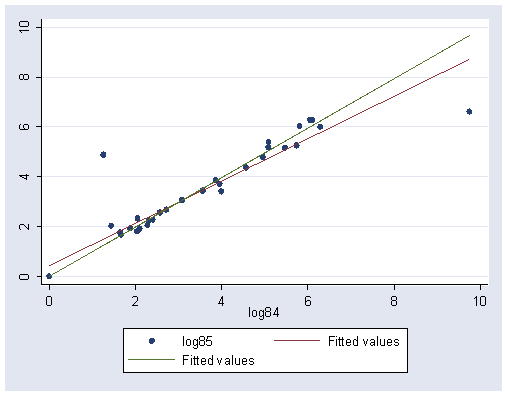
Figure 6.17, page 211.
use https://stats.idre.ucla.edu/stat/stata/examples/rwg/bays, clear

gen log84=log(pcb84+1)
gen log85=log(pcb85+1)
regress log85 log84

  Source |       SS       df       MS                  Number of obs =      37
---------+------------------------------               F(  1,    35) =  251.17
   Model |  145.581687     1  145.581687               Prob > F      =  0.0000
Residual |  20.2863138    35  .579608967               R-squared     =  0.8777
---------+------------------------------               Adj R-squared =  0.8742
   Total |  165.868001    36  4.60744448               Root MSE      =  .76132

------------------------------------------------------------------------------
   log85 |      Coef.   Std. Err.       t     P>|t|       [95% Conf. Interval]
---------+--------------------------------------------------------------------
   log84 |   .8508259   .0536852     15.848   0.000        .741839    .9598127
   _cons |   .4251097    .202327      2.101   0.043        .014364    .8358553
------------------------------------------------------------------------------

predict h, leverage
summarize h, detail

                          Leverage
-------------------------------------------------------------
      Percentiles      Smallest
 1%     .0270889       .0270889
 5%     .0273455       .0273455
10%     .0286045       .0278075       Obs                  37
25%     .0311876       .0286045       Sum of Wgt.          37

50%     .0415393                      Mean           .0540541
                        Largest       Std. Dev.       .038911
75%     .0706273       .0743968
90%     .0743968       .0759508       Variance       .0015141
95%     .0818475       .0818475       Skewness       3.870526
99%     .2560128       .2560128       Kurtosis        20.8041
Note that the 90th percentile is .0743968. The [aw=wh] option tells Stata to use wh as the aweight.
gen wh=.
(37 missing values generated)

replace wh=1 if h<=.0743968
(33 real changes made)

replace wh=(.0743968/h)^2 if h>.0743968
(4 real changes made)

qreg log85 log84 [aw=wh]
(sum of wgt is  3.5870e+001)
Iteration  1:  WLS sum of weighted deviations =  14.000723

(sum of wgt is  3.5870e+001)
Iteration  1: sum of abs. weighted deviations =  11.648956
Iteration  2: sum of abs. weighted deviations =  9.4317616
Iteration  3: sum of abs. weighted deviations =  9.3947206

Median regression                                    Number of obs =        37
  Raw sum of deviations 63.89834 (about 2.332144)
  Min sum of deviations 9.394721                     Pseudo R2     =    0.8530

------------------------------------------------------------------------------
   log85 |      Coef.   Std. Err.       t     P>|t|       [95% Conf. Interval]
---------+--------------------------------------------------------------------
   log84 |   .9922884   .0076806    129.194   0.000       .9766959    1.007881
   _cons |  -1.49e-09   .0211771      0.000   1.000      -.0429919    .0429919
------------------------------------------------------------------------------

predict yhat1
graph twoway (scatter log85 log84) (lfit log85 log84) (line yhat1 log84), ///
	xlabel(0(2)10) ylabel(0(2)10)