Figure 7.1, page 218.
use https://stats.idre.ucla.edu/stat/stata/examples/rwg/toxic, clear

regress close lived

  Source |       SS       df       MS                  Number of obs =     153
---------+------------------------------               F(  1,   151) =   13.65
   Model |  3.11094265     1  3.11094265               Prob > F      =  0.0003
Residual |  34.4184691   151  .227936882               R-squared     =  0.0829
---------+------------------------------               Adj R-squared =  0.0768
   Total |  37.5294118   152  .246904025               Root MSE      =  .47743

------------------------------------------------------------------------------
   close |      Coef.   Std. Err.       t     P>|t|       [95% Conf. Interval]
---------+--------------------------------------------------------------------
   lived |  -.0084379    .002284     -3.694   0.000      -.0129506   -.0039252
   _cons |    .593954   .0585363     10.147   0.000       .4782981    .7096099
------------------------------------------------------------------------------

graph twoway (scatter close lived if close == 1, connect(l)) ///
	(scatter close lived if close == 0, connect(l)) ///
        (lfit close lived), xlabel(0(10)80) ylabel(0(.2)1)
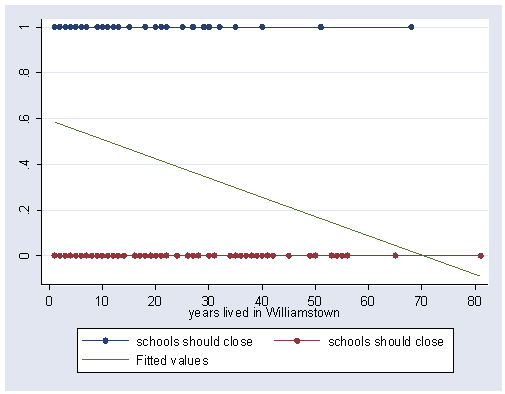
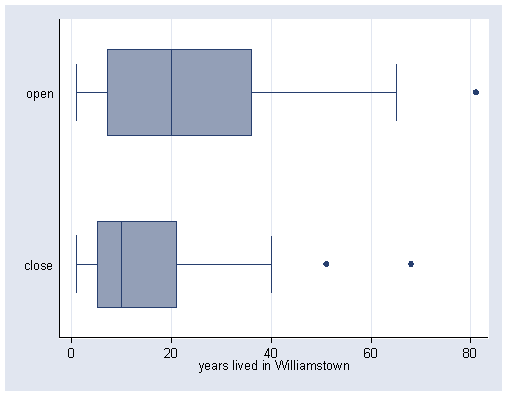
Figure 7.2, page 219.
use https://stats.idre.ucla.edu/stat/stata/examples/rwg/toxic, clear

graph hbox lived, over(close)
Figure 7.4, page 222.
use https://stats.idre.ucla.edu/stat/stata/examples/rwg/toxic, clear

logit close lived

Iteration 0:   log likelihood = -104.60578
Iteration 1:   log likelihood =  -97.80942
Iteration 2:   log likelihood = -97.634236
Iteration 3:   log likelihood = -97.633571

Logit estimates                                   Number of obs   =        153
                                                  LR chi2(1)      =      13.94
                                                  Prob > chi2     =     0.0002
Log likelihood = -97.633571                       Pseudo R2       =     0.0667

------------------------------------------------------------------------------
   close |      Coef.   Std. Err.       z     P>|z|       [95% Conf. Interval]
---------+--------------------------------------------------------------------
   lived |  -.0409876   .0121398     -3.376   0.001      -.0647811   -.0171941
   _cons |   .4599786   .2625643      1.752   0.080       -.054638    .9745953
------------------------------------------------------------------------------

predict yhat1

graph twoway  (scatter close lived if close == 1, connect(l)) ///
		(scatter close lived if close == 0, connect(l)) ///
		(line yhat1 lived, sort) (lfit close lived), xlabel(0(10)80) ylabel(0(.2)1)
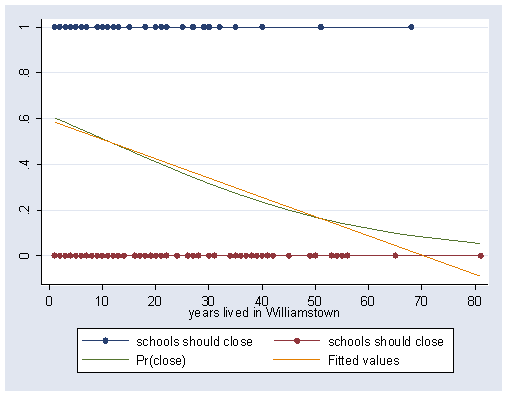
Table 224, page 224.
use https://stats.idre.ucla.edu/stat/stata/examples/rwg/toxic, clear

logit close lived

Iteration 0:   log likelihood = -104.60578
Iteration 1:   log likelihood =  -97.80942
Iteration 2:   log likelihood = -97.634236
Iteration 3:   log likelihood = -97.633571

Logit estimates                                   Number of obs   =        153
                                                  LR chi2(1)      =      13.94
                                                  Prob > chi2     =     0.0002
Log likelihood = -97.633571                       Pseudo R2       =     0.0667

------------------------------------------------------------------------------
   close |      Coef.   Std. Err.       z     P>|z|       [95% Conf. Interval]
---------+--------------------------------------------------------------------
   lived |  -.0409876   .0121398     -3.376   0.001      -.0647811   -.0171941
   _cons |   .4599786   .2625643      1.752   0.080       -.054638    .9745953
------------------------------------------------------------------------------
Table 7.2, page 226.
use https://stats.idre.ucla.edu/stat/stata/examples/rwg/toxic, clear

logit close lived educ contam hsc

Iteration 0:   log likelihood = -104.60578
Iteration 1:   log likelihood = -76.104878
Iteration 2:   log likelihood = -74.725772
Iteration 3:   log likelihood = -74.690849
Iteration 4:   log likelihood = -74.690816

Logit estimates                                   Number of obs   =        153
                                                  LR chi2(4)      =      59.83
                                                  Prob > chi2     =     0.0000
Log likelihood = -74.690816                       Pseudo R2       =     0.2860

------------------------------------------------------------------------------
   close |      Coef.   Std. Err.       z     P>|z|       [95% Conf. Interval]
---------+--------------------------------------------------------------------
   lived |  -.0464826   .0149263     -3.114   0.002      -.0757376   -.0172276
    educ |  -.1659221   .0899316     -1.845   0.065      -.3421849    .0103407
  contam |   1.208137   .4653958      2.596   0.009       .2959783    2.120296
     hsc |    2.17289   .4641192      4.682   0.000       1.263233    3.082547
   _cons |   1.731439   1.301999      1.330   0.184      -.8204311     4.28331
------------------------------------------------------------------------------
Table 7.3, page 227.
use https://stats.idre.ucla.edu/stat/stata/examples/rwg/toxic, clear

logit close lived educ contam hsc female kids nodad

Iteration 0:   log likelihood = -104.60578
Iteration 1:   log likelihood = -73.307756
Iteration 2:   log likelihood = -70.718684
Iteration 3:   log likelihood = -70.526461
Iteration 4:   log likelihood =  -70.52469
Iteration 5:   log likelihood = -70.524689

Logit estimates                                   Number of obs   =        153
                                                  LR chi2(7)      =      68.16
                                                  Prob > chi2     =     0.0000
Log likelihood = -70.524689                       Pseudo R2       =     0.3258

------------------------------------------------------------------------------
   close |      Coef.   Std. Err.       z     P>|z|       [95% Conf. Interval]
---------+--------------------------------------------------------------------
   lived |  -.0466422   .0169751     -2.748   0.006      -.0799129   -.0133716
    educ |  -.2060233    .093197     -2.211   0.027      -.3886861   -.0233605
  contam |   1.282082   .4813682      2.663   0.008       .3386177    2.225546
     hsc |   2.418002   .5096638      4.744   0.000       1.419079    3.416924
  female |  -.0515618   .5571215     -0.093   0.926        -1.1435    1.040376
    kids |  -.6706227   .5656146     -1.186   0.236      -1.779207    .4379616
   nodad |  -2.225988   .9991178     -2.228   0.026      -4.184223   -.2677527
   _cons |   2.893725   1.602985      1.805   0.071      -.2480675    6.035517
------------------------------------------------------------------------------
Table 7.4, page 228.
use https://stats.idre.ucla.edu/stat/stata/examples/rwg/toxic, clear

logit close lived educ contam hsc nodad

Iteration 0:   log likelihood = -104.60578
Iteration 1:   log likelihood = -73.813367
Iteration 2:   log likelihood =  -71.47445
Iteration 3:   log likelihood = -71.327206
Iteration 4:   log likelihood = -71.326227
Iteration 5:   log likelihood = -71.326227

Logit estimates                                   Number of obs   =        153
                                                  LR chi2(5)      =      66.56
                                                  Prob > chi2     =     0.0000
Log likelihood = -71.326227                       Pseudo R2       =     0.3181

------------------------------------------------------------------------------
   close |      Coef.   Std. Err.       z     P>|z|       [95% Conf. Interval]
---------+--------------------------------------------------------------------
   lived |  -.0396488   .0154812     -2.561   0.010      -.0699914   -.0093062
    educ |  -.1966667   .0926128     -2.124   0.034      -.3781846   -.0151489
  contam |   1.298551   .4766294      2.724   0.006       .3643749    2.232728
     hsc |    2.27855   .4903703      4.647   0.000       1.317441    3.239658
   nodad |  -1.730948   .7252746     -2.387   0.017       -3.15246    -.309436
   _cons |   2.182273   1.330141      1.641   0.101      -.4247561    4.789301
------------------------------------------------------------------------------
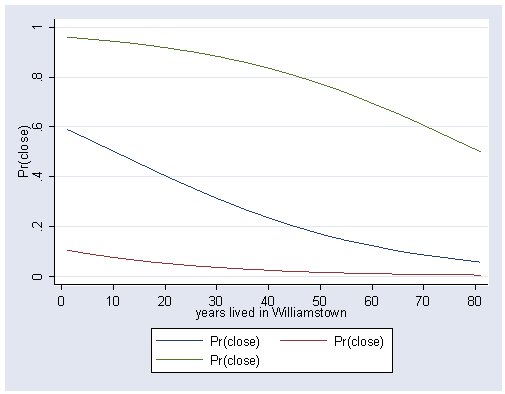
Figure 7.5, page 232.
Note that the equations for these curves are listed and explained on page 231.
use https://stats.idre.ucla.edu/stat/stata/examples/rwg/toxic, clear

logit close lived educ contam hsc nodad

Iteration 0:   log likelihood = -104.60578
Iteration 1:   log likelihood = -73.813367
Iteration 2:   log likelihood =  -71.47445
Iteration 3:   log likelihood = -71.327206
Iteration 4:   log likelihood = -71.326227
Iteration 5:   log likelihood = -71.326227

Logit estimates                                   Number of obs   =        153
                                                  LR chi2(5)      =      66.56
                                                  Prob > chi2     =     0.0000
Log likelihood = -71.326227                       Pseudo R2       =     0.3181

------------------------------------------------------------------------------
   close |      Coef.   Std. Err.       z     P>|z|       [95% Conf. Interval]
---------+--------------------------------------------------------------------
   lived |  -.0396488   .0154812     -2.561   0.010      -.0699914   -.0093062
    educ |  -.1966667   .0926128     -2.124   0.034      -.3781846   -.0151489
  contam |   1.298551   .4766294      2.724   0.006       .3643749    2.232728
     hsc |    2.27855   .4903703      4.647   0.000       1.317441    3.239658
   nodad |  -1.730948   .7252746     -2.387   0.017       -3.15246    -.309436
   _cons |   2.182273   1.330141      1.641   0.101      -.4247561    4.789301
------------------------------------------------------------------------------
To obtain the predicted probabilities for a subject’s profile, we are going to use the postgr3 command and use the x( ) option to define the profile that we are interested. You can download postgr3 from within Stata by typing search postgr3 (see How can I use the search command to search for programs and get additional help? for more information about using search).
postgr3 lived, gen(avg) nodraw
postgr3 lived, gen(bottom) x(contam=0 hsc=0 nodad=1)  nodraw
postgr3 lived, gen(top) x(contam=1 hsc=1 nodad=0) nodraw
graph twoway (line avg lived, sort) (line bottom lived, sort) (line top lived, sort), ///
	       xlabel(0(10)80)
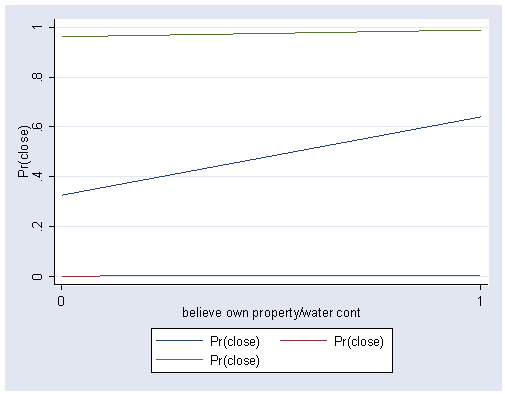
Figure 7.6, page 232.
use https://stats.idre.ucla.edu/stat/stata/examples/rwg/toxic, clear

logit close lived educ contam hsc nodad

Iteration 0:   log likelihood = -104.60578
Iteration 1:   log likelihood = -73.813367
Iteration 2:   log likelihood =  -71.47445
Iteration 3:   log likelihood = -71.327206
Iteration 4:   log likelihood = -71.326227
Iteration 5:   log likelihood = -71.326227

Logit estimates                                   Number of obs   =        153
                                                  LR chi2(5)      =      66.56
                                                  Prob > chi2     =     0.0000
Log likelihood = -71.326227                       Pseudo R2       =     0.3181

------------------------------------------------------------------------------
   close |      Coef.   Std. Err.       z     P>|z|       [95% Conf. Interval]
---------+--------------------------------------------------------------------
   lived |  -.0396488   .0154812     -2.561   0.010      -.0699914   -.0093062
    educ |  -.1966667   .0926128     -2.124   0.034      -.3781846   -.0151489
  contam |   1.298551   .4766294      2.724   0.006       .3643749    2.232728
     hsc |    2.27855   .4903703      4.647   0.000       1.317441    3.239658
   nodad |  -1.730948   .7252746     -2.387   0.017       -3.15246    -.309436
   _cons |   2.182273   1.330141      1.641   0.101      -.4247561    4.789301
------------------------------------------------------------------------------

summ lived educ contam hsc nodad

Variable |     Obs        Mean   Std. Dev.       Min        Max
---------+-----------------------------------------------------
   lived |     153    19.26797   16.95466          1         81
    educ |     153    12.95425   2.431536          6         20
  contam |     153    .2810458    .450986          0          1
     hsc |     153    .3071895   .4628437          0          1
   nodad |     153    .1699346   .3768088          0          1
postgr3 contam, gen(avg1) nodraw
postgr3 contam, gen(top1) x(lived=min educ=min hsc=1 nodad=0) nodraw
postgr3 contam, gen(bottom1) x(lived=max educ=max hsc=0 nodad=1) nodraw
graph twoway (line avg1 contam, sort) (line bottom1 contam, sort) (line top1 contam, sort), ///
		xlabel(0 1)
Table 7.5, page 234.
NOTE: Hamilton gives the data set at the top of the page. You need to input it before you can run the logit.
clear
input less mother cnt
0 0 202
0 1 79
1 0 44
1 1 0
end

logit less mother [fw=cnt]

Note: mother~=0 predicts failure perfectly
mother dropped and 1 obs not used

Iteration 0: log likelihood = -115.53714

Logit estimates Number of obs = 246
LR chi2(0) = 0.00
Prob > chi2 = .
Log likelihood = -115.53714 Pseudo R2 = 0.0000

------------------------------------------------------------------------------
less | Coef. Std. Err. z P>|z| [95% Conf. Interval]
---------+--------------------------------------------------------------------
_cons | -1.524078 .1663664 -9.161 0.000 -1.85015 -1.198006
------------------------------------------------------------------------------
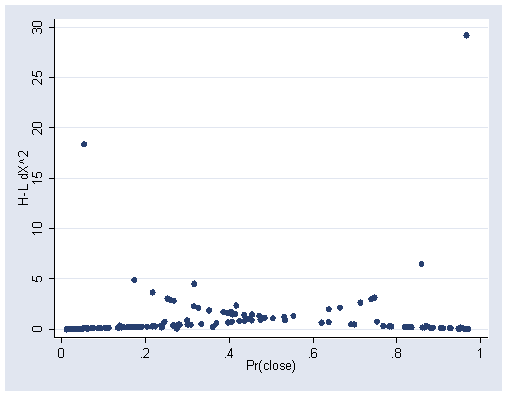
Figure 7.7, page 239.
use https://stats.idre.ucla.edu/stat/stata/examples/rwg/toxic, clear

logistic close lived educ contam hsc nodad

Logit estimates                                   Number of obs   =        153
                                                  LR chi2(5)      =      66.56
                                                  Prob > chi2     =     0.0000
Log likelihood = -71.326227                       Pseudo R2       =     0.3181

------------------------------------------------------------------------------
   close | Odds Ratio   Std. Err.       z     P>|z|       [95% Conf. Interval]
---------+--------------------------------------------------------------------
   lived |   .9611269   .0148794     -2.561   0.010       .9324019    .9907369
    educ |   .8214643   .0760781     -2.124   0.034       .6851041    .9849652
  contam |   3.663985   1.746363      2.724   0.006       1.439614    9.325267
     hsc |    9.76251   4.787244      4.647   0.000       3.733856    25.52498
   nodad |   .1771164    .128458     -2.387   0.017       .0427468    .7338607
------------------------------------------------------------------------------

predict x, dx2
predict lhat
graph twoway (scatter x lhat), xlabel(0(.2)1) ylabel(0(5)30)
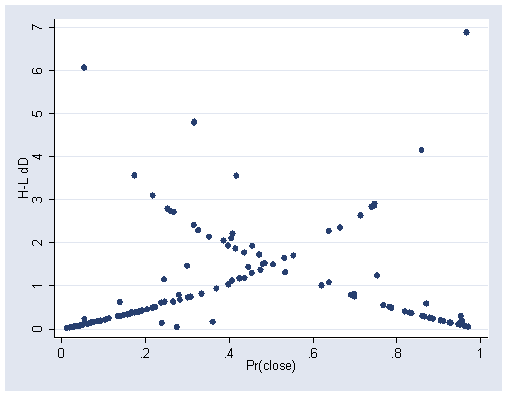
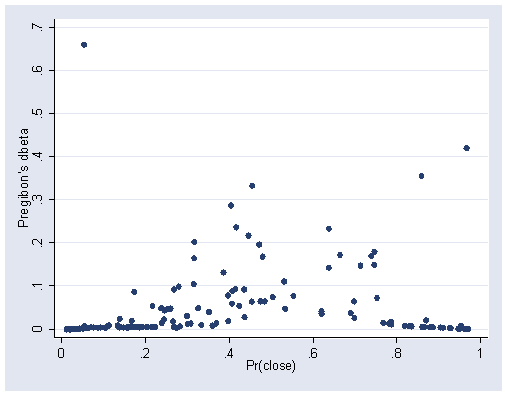
Figure 7.8, page 240.
predict z, ddeviance
graph twoway scatter z lhat, xlabel(0(.2)1) ylabel(0(1)7)
graph twoway scatter b lhat, xlabel(0(.2)1) ylabel(0(.1).7)
Table 7.8, page 241.
use https://stats.idre.ucla.edu/stat/stata/examples/rwg/toxic, clear
logit model estimated with full sample (n=153)
logit close lived educ contam hsc nodad

Iteration 0:   log likelihood = -104.60578
Iteration 1:   log likelihood = -73.813367
Iteration 2:   log likelihood =  -71.47445
Iteration 3:   log likelihood = -71.327206
Iteration 4:   log likelihood = -71.326227
Iteration 5:   log likelihood = -71.326227

Logit estimates                                   Number of obs   =        153
                                                  LR chi2(5)      =      66.56
                                                  Prob > chi2     =     0.0000
Log likelihood = -71.326227                       Pseudo R2       =     0.3181

------------------------------------------------------------------------------
   close |      Coef.   Std. Err.       z     P>|z|       [95% Conf. Interval]
---------+--------------------------------------------------------------------
   lived |  -.0396488   .0154812     -2.561   0.010      -.0699914   -.0093062
    educ |  -.1966667   .0926128     -2.124   0.034      -.3781846   -.0151489
  contam |   1.298551   .4766294      2.724   0.006       .3643749    2.232728
     hsc |    2.27855   .4903703      4.647   0.000       1.317441    3.239658
   nodad |  -1.730948   .7252746     -2.387   0.017       -3.15246    -.309436
   _cons |   2.182273   1.330141      1.641   0.101      -.4247561    4.789301
------------------------------------------------------------------------------
with X pattern 131 deleted (n=152)
use https://stats.idre.ucla.edu/stat/stata/examples/rwg/toxic, clear

logistic close lived educ contam hsc nodad

Logit estimates                                   Number of obs   =        153
                                                  LR chi2(5)      =      66.56
                                                  Prob > chi2     =     0.0000
Log likelihood = -71.326227                       Pseudo R2       =     0.3181

------------------------------------------------------------------------------
   close | Odds Ratio   Std. Err.       z     P>|z|       [95% Conf. Interval]
---------+--------------------------------------------------------------------
   lived |   .9611269   .0148794     -2.561   0.010       .9324019    .9907369
    educ |   .8214643   .0760781     -2.124   0.034       .6851041    .9849652
  contam |   3.663985   1.746363      2.724   0.006       1.439614    9.325267
     hsc |    9.76251   4.787244      4.647   0.000       3.733856    25.52498
   nodad |   .1771164    .128458     -2.387   0.017       .0427468    .7338607
------------------------------------------------------------------------------

predict b, dbeta
predict y, number
drop if y==131
(1 observation deleted)

logit close lived educ contam hsc nodad

Iteration 0:   log likelihood = -103.76066
Iteration 1:   log likelihood = -71.127431
Iteration 2:   log likelihood = -68.285763
Iteration 3:   log likelihood =  -68.06416
Iteration 4:   log likelihood = -68.061885
Iteration 5:   log likelihood = -68.061885

Logit estimates                                   Number of obs   =        152
                                                  LR chi2(5)      =      71.40
                                                  Prob > chi2     =     0.0000
Log likelihood = -68.061885                       Pseudo R2       =     0.3440

------------------------------------------------------------------------------
   close |      Coef.   Std. Err.       z     P>|z|       [95% Conf. Interval]
---------+--------------------------------------------------------------------
   lived |  -.0524225   .0168844     -3.105   0.002      -.0855153   -.0193297
    educ |  -.2140323   .0951634     -2.249   0.025      -.4005492   -.0275155
  contam |   1.381912   .4896501      2.822   0.005       .4222155    2.341609
     hsc |   2.346783   .5030237      4.665   0.000       1.360875    3.332691
   nodad |  -1.658292   .7484702     -2.216   0.027      -3.125267   -.1913172
   _cons |    2.52996   1.370969      1.845   0.065      -.1570907    5.217011
------------------------------------------------------------------------------
with X pattern 3 deleted (n=152)
use https://stats.idre.ucla.edu/stat/stata/examples/rwg/toxic, clear

logistic close lived educ contam hsc nodad

Logit estimates                                   Number of obs   =        153
                                                  LR chi2(5)      =      66.56
                                                  Prob > chi2     =     0.0000
Log likelihood = -71.326227                       Pseudo R2       =     0.3181

------------------------------------------------------------------------------
   close | Odds Ratio   Std. Err.       z     P>|z|       [95% Conf. Interval]
---------+--------------------------------------------------------------------
   lived |   .9611269   .0148794     -2.561   0.010       .9324019    .9907369
    educ |   .8214643   .0760781     -2.124   0.034       .6851041    .9849652
  contam |   3.663985   1.746363      2.724   0.006       1.439614    9.325267
     hsc |    9.76251   4.787244      4.647   0.000       3.733856    25.52498
   nodad |   .1771164    .128458     -2.387   0.017       .0427468    .7338607
------------------------------------------------------------------------------

predict b, dbeta
predict y, number
drop if y==3
(1 observation deleted)

logit close lived educ contam hsc nodad

Iteration 0:   log likelihood = -104.03876
Iteration 1:   log likelihood = -70.928977
Iteration 2:   log likelihood = -67.960963
Iteration 3:   log likelihood = -67.715507
Iteration 4:   log likelihood = -67.712659
Iteration 5:   log likelihood = -67.712659

Logit estimates                                   Number of obs   =        152
                                                  LR chi2(5)      =      72.65
                                                  Prob > chi2     =     0.0000
Log likelihood = -67.712659                       Pseudo R2       =     0.3492

------------------------------------------------------------------------------
   close |      Coef.   Std. Err.       z     P>|z|       [95% Conf. Interval]
---------+--------------------------------------------------------------------
   lived |  -.0446571   .0161192     -2.770   0.006      -.0762503    -.013064
    educ |  -.2236421   .0957586     -2.335   0.020      -.4113255   -.0359586
  contam |    1.48958   .4975889      2.994   0.003       .5143239    2.464836
     hsc |    2.49197   .5238655      4.757   0.000       1.465213    3.518728
   nodad |  -1.888628   .7622651     -2.478   0.013       -3.38264   -.3946154
   _cons |   2.575416   1.370319      1.879   0.060      -.1103597    5.261191
------------------------------------------------------------------------------
with X pattern 115 deleted (n=152)
use https://stats.idre.ucla.edu/stat/stata/examples/rwg/toxic, clear

logistic close lived educ contam hsc nodad

Logit estimates                                   Number of obs   =        153
                                                  LR chi2(5)      =      66.56
                                                  Prob > chi2     =     0.0000
Log likelihood = -71.326227                       Pseudo R2       =     0.3181

------------------------------------------------------------------------------
   close | Odds Ratio   Std. Err.       z     P>|z|       [95% Conf. Interval]
---------+--------------------------------------------------------------------
   lived |   .9611269   .0148794     -2.561   0.010       .9324019    .9907369
    educ |   .8214643   .0760781     -2.124   0.034       .6851041    .9849652
  contam |   3.663985   1.746363      2.724   0.006       1.439614    9.325267
     hsc |    9.76251   4.787244      4.647   0.000       3.733856    25.52498
   nodad |   .1771164    .128458     -2.387   0.017       .0427468    .7338607
------------------------------------------------------------------------------

predict b, dbeta
predict y, number
drop if y==115
(1 observation deleted)

logit close lived educ contam hsc nodad

Iteration 0:   log likelihood = -104.03876
Iteration 1:   log likelihood = -72.041161
Iteration 2:   log likelihood = -69.387543
Iteration 3:   log likelihood = -69.190424
Iteration 4:   log likelihood = -69.188607
Iteration 5:   log likelihood = -69.188607

Logit estimates                                   Number of obs   =        152
                                                  LR chi2(5)      =      69.70
                                                  Prob > chi2     =     0.0000
Log likelihood = -69.188607                       Pseudo R2       =     0.3350

------------------------------------------------------------------------------
   close |      Coef.   Std. Err.       z     P>|z|       [95% Conf. Interval]
---------+--------------------------------------------------------------------
   lived |  -.0355651   .0154349     -2.304   0.021      -.0658168   -.0053133
    educ |  -.2042185   .0940803     -2.171   0.030      -.3886124   -.0198246
  contam |   1.451658   .4911553      2.956   0.003       .4890117    2.414305
     hsc |   2.460228   .5164483      4.764   0.000       1.448008    3.472448
   nodad |   -1.90518   .7502902     -2.539   0.011      -3.375722   -.4346386
   _cons |   2.183335   1.342716      1.626   0.104      -.4483392    4.815009
------------------------------------------------------------------------------
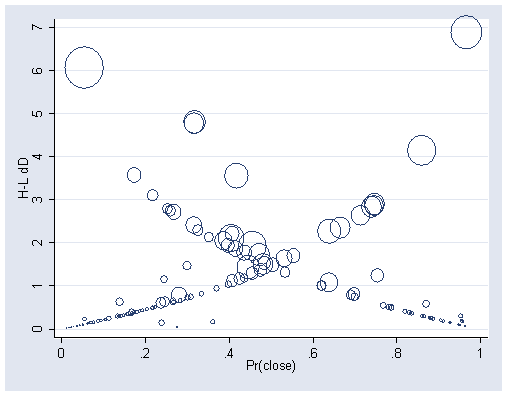
Figure 7.10, page 242.
use https://stats.idre.ucla.edu/stat/stata/examples/rwg/toxic, clear

logistic close lived educ contam hsc nodad

Logit estimates                                   Number of obs   =        153
                                                  LR chi2(5)      =      66.56
                                                  Prob > chi2     =     0.0000
Log likelihood = -71.326227                       Pseudo R2       =     0.3181

------------------------------------------------------------------------------
   close | Odds Ratio   Std. Err.       z     P>|z|       [95% Conf. Interval]
---------+--------------------------------------------------------------------
   lived |   .9611269   .0148794     -2.561   0.010       .9324019    .9907369
    educ |   .8214643   .0760781     -2.124   0.034       .6851041    .9849652
  contam |   3.663985   1.746363      2.724   0.006       1.439614    9.325267
     hsc |    9.76251   4.787244      4.647   0.000       3.733856    25.52498
   nodad |   .1771164    .128458     -2.387   0.017       .0427468    .7338607
------------------------------------------------------------------------------

predict lhat
predict x, ddeviance
predict b, dbeta
graph twoway scatter x lhat [weight=b], msymbol(oh) xlabel(0(.2)1) ylabel(0(1)7)

