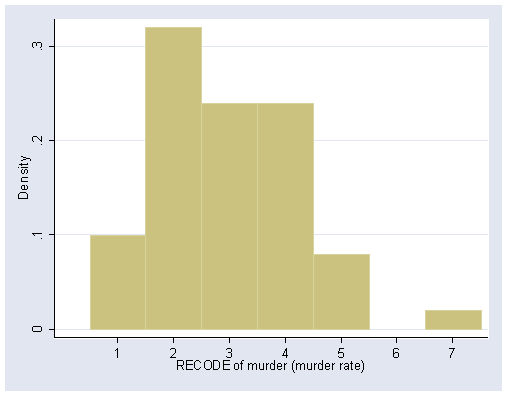
Table 3.2, page 37; figure 3.1, page 39 and table 3.3, page 38.
use https://stats.idre.ucla.edu/stat/stata/examples/smss/murder1, clear

/* raw frequency distribution */

tabulate murder

murder rate |      Freq.     Percent        Cum.
------------+-----------------------------------
        1.6 |          1        2.00        2.00
        1.7 |          1        2.00        4.00
          2 |          1        2.00        6.00
        2.3 |          1        2.00        8.00
        2.9 |          1        2.00       10.00
          3 |          1        2.00       12.00
        3.1 |          1        2.00       14.00
        3.4 |          3        6.00       20.00
        3.6 |          1        2.00       22.00
        3.8 |          1        2.00       24.00
        3.9 |          3        6.00       30.00
        4.4 |          1        2.00       32.00
        4.6 |          1        2.00       34.00
          5 |          1        2.00       36.00
        5.2 |          1        2.00       38.00
        5.3 |          1        2.00       40.00
        5.8 |          1        2.00       42.00
          6 |          1        2.00       44.00
        6.3 |          1        2.00       46.00
        6.4 |          1        2.00       48.00
        6.6 |          1        2.00       50.00
        6.8 |          1        2.00       52.00
        6.9 |          1        2.00       54.00
        7.5 |          1        2.00       56.00
          8 |          1        2.00       58.00
        8.3 |          1        2.00       60.00
        8.4 |          1        2.00       62.00
        8.6 |          1        2.00       64.00
        8.9 |          1        2.00       66.00
          9 |          1        2.00       68.00
        9.8 |          1        2.00       70.00
       10.2 |          2        4.00       74.00
       10.3 |          1        2.00       76.00
       10.4 |          1        2.00       78.00
       11.3 |          2        4.00       82.00
       11.4 |          2        4.00       86.00
       11.6 |          1        2.00       88.00
       11.9 |          1        2.00       90.00
       12.7 |          1        2.00       92.00
       13.1 |          1        2.00       94.00
       13.3 |          1        2.00       96.00
       13.5 |          1        2.00       98.00
       20.3 |          1        2.00      100.00
------------+-----------------------------------
      Total |         50      100.00


recode murder (min/2.9=1 0.0-2.9) (3/5.9=2 3.0-5.9) (6/8.9=3 6.0-8.9) (9/11.9=4 9.0-11.9) ///
		  (12/14.9=5 12.0-14.9) (15/17.9=6 15.0-17.9) (18/max=7 18.0-20.9), gen(rmurder)
histogram rmurder, discrete xlabel(1(1)7)
tabulate rmurder

  RECODE of |
     murder |
    (murder |
      rate) |      Freq.     Percent        Cum.
------------+-----------------------------------
    0.0-2.9 |          5       10.00       10.00
    3.0-5.9 |         16       32.00       42.00
    6.0-8.9 |         12       24.00       66.00
   9.0-11.9 |         12       24.00       90.00
  12.0-14.9 |          4        8.00       98.00
  18.0-20.9 |          1        2.00      100.00
------------+-----------------------------------
      Total |         50      100.00
Figure 3.4, page 41.
stem murder

Stem-and-leaf plot for murder (murder rate)

murder rounded to nearest multiple of .1
plot in units of .1

   1* | 67
   2* | 039
   3* | 0144468999
   4* | 46
   5* | 0238
   6* | 034689
   7* | 5
   8* | 03469
   9* | 08
  10* | 2234
  11* | 334469
  12* | 7
  13* | 135
  14* |
  15* |
  16* |
  17* |
  18* |
  19* |
  20* | 3
Canada data for figure 3.5, page 43.
use https://stats.idre.ucla.edu/stat/stata/examples/smss/murder2, clear

bysort country: stem murder, line(1)

-----------------------------------------------------------------------------------------
-> country = USA

Stem-and-leaf plot for murder (murder rate)

murder rounded to nearest multiple of .1
plot in units of .1

   1* | 67
   2* | 039
   3* | 0144468999
   4* | 46
   5* | 0238
   6* | 034689
   7* | 5
   8* | 03469
   9* | 08
  10* | 2234
  11* | 334469
  12* | 7
  13* | 135
  14* |
  15* |
  16* |
  17* |
  18* |
  19* |
  20* | 3

-----------------------------------------------------------------------------------------
-> country = Canada

Stem-and-leaf plot for murder (murder rate)

murder rounded to nearest multiple of .1
plot in units of .1

  0* | 7
  1* | 123
  2* | 023679
Table 3.6, page 46.
use https://stats.idre.ucla.edu/stat/stata/examples/smss/femecon, clear

list

     +-----------------------------------------+
     |        country   activity        region |
     |-----------------------------------------|
  1. |        austria         60   west europe |
  2. |        belgium         47   west europe |
  3. |        denmark         77   west europe |
  4. |         france         64   west europe |
  5. |        ireland         41   west europe |
     |-----------------------------------------|
  6. |          italy         44   west europe |
  7. |    netherlands         42   west europe |
  8. |         norway         68   west europe |
  9. |       portugal         51   west europe |
 10. |          spain         31   west europe |
     |-----------------------------------------|
 11. |         sweden         77   west europe |
 12. |    switzerland         60   west europe |
 13. | united kingdom         60   west europe |
 14. |       bulgaria         88   east europe |
 15. | czech republic         84   east europe |
     |-----------------------------------------|
 16. |        hungary         70   east europe |
 17. |         poland         77   east europe |
 18. |        romania         77   east europe |
 19. |       slovakia         81   east europe |
     +-----------------------------------------+
Example 3.4, page 45 and 48.
summarize activity if region==2

    Variable |       Obs        Mean    Std. Dev.       Min        Max
-------------+--------------------------------------------------------
    activity |         6        79.5    6.284903         70         88

summarize activity if region==1

    Variable |       Obs        Mean    Std. Dev.       Min        Max
-------------+--------------------------------------------------------
    activity |        13    55.53846    14.23385         31         77

/* alternative method */

tabstat activity, by(region) stat(n mean sd min max)

Summary for variables: activity
     by categories of: region

     region |         N      mean        sd       min       max
------------+--------------------------------------------------
west europe |        13  55.53846  14.23385        31        77
east europe |         6      79.5  6.284903        70        88
------------+--------------------------------------------------
      Total |        19  63.10526  16.64297        31        88
--------------------------------------------------------------


/* mean for all of Europe, page 48 */
/* manual computation */

display (13*55.5+6*79.5)/(13+6)

63.078947

/* using the summarize command */

summarize activity


    Variable |       Obs        Mean    Std. Dev.       Min        Max
-------------+--------------------------------------------------------
    activity |        19    63.10526    16.64297         31         88
Example 3.5, page 47.
clear input income 10200 10400 10700 11200 11300 11500 200000 endsave mnincome, replace
summarize income
Variable | Obs Mean Std. Dev. Min Max ————-+——————————————————– income | 7 37900 71481 10200 200000
summarize income in 1/6
Variable | Obs Mean Std. Dev. Min Max ————-+——————————————————– income | 6 10883.33 526.9409 10200 11500
Various medians, page 49.
use https://stats.idre.ucla.edu/stat/stata/examples/smss/mnincome, clear

summarize income, detail

                           income
-------------------------------------------------------------
      Percentiles      Smallest
 1%        10200          10200
 5%        10200          10400
10%        10200          10700       Obs                   7
25%        10400          11200       Sum of Wgt.           7

50%        11200                      Mean              37900
                        Largest       Std. Dev.         71481
75%        11500          11200
90%       200000          11300       Variance       5.11e+09
95%       200000          11500       Skewness       2.041047
99%       200000         200000       Kurtosis       5.166244

use https://stats.idre.ucla.edu/stat/stata/examples/smss/femecon, clear

tabstat activity, by(region) stat(n mean median)

Summary for variables: activity
     by categories of: region

     region |         N      mean       p50
------------+------------------------------
west europe |        13  55.53846        60
east europe |         6      79.5        79
------------+------------------------------
      Total |        19  63.10526        64
-------------------------------------------
Example 3.6, page 49.
clear
input degree freq
1 38012
2 65291
3 33191
4 7570
5 22845
6 7599
7 3110
end

label define edu 1 "no hs" 2 "hs only" 3 "some coll" 4 "associate" 5 "bachelors" ///
                   6 "masters" 7 "doctorate"

label values degree edu

tab d [fw = freq]

     degree |      Freq.     Percent        Cum.
------------+-----------------------------------
      no hs |     38,012       21.40       21.40
    hs only |     65,291       36.76       58.16
  some coll |     33,191       18.69       76.85
  associate |      7,570        4.26       81.11
  bachelors |     22,845       12.86       93.97
    masters |      7,599        4.28       98.25
  doctorate |      3,110        1.75      100.00
------------+-----------------------------------
      Total |    177,618      100.00

summarize d [fw = freq], detail

                           degree
-------------------------------------------------------------
      Percentiles      Smallest
 1%            1              1
 5%            1              2
10%            1              3       Obs              177618
25%            2              4       Sum of Wgt.      177618

50%            2                      Mean           2.702631
                        Largest       Std. Dev.      1.535418
75%            3              4
90%            5              5       Variance       2.357509
95%            6              6       Skewness       .9384876
99%            7              7       Kurtosis       2.990797
Example 3.7, page 51.
use https://stats.idre.ucla.edu/stat/stata/examples/smss/murder1, clear

set obs 51
replace sid=51 in 51
replace state="wash dc" in 51
replace murder=78.5 in 51
summarize murder, detail

                         murder rate
-------------------------------------------------------------
      Percentiles      Smallest
 1%          1.6            1.6
 5%            2            1.7
10%            3              2       Obs                  51
25%          3.9            2.3       Sum of Wgt.          51

50%          6.8                      Mean           8.727451
                        Largest       Std. Dev.      10.71758
75%         10.4           13.3
90%         12.7           13.5       Variance       114.8664
95%         13.5           20.3       Skewness       5.552901
99%         78.5           78.5       Kurtosis       36.70193
Percentiles, page 53.
use https://stats.idre.ucla.edu/stat/stata/examples/smss/murder1, clear

summarize murder, detail

                         murder rate
-------------------------------------------------------------
      Percentiles      Smallest
 1%          1.6            1.6
 5%            2            1.7
10%         2.95              2       Obs                  50
25%          3.9            2.3       Sum of Wgt.          50

50%          6.7                      Mean              7.332
                        Largest       Std. Dev.      3.984021
75%         10.3           13.1
90%         12.3           13.3       Variance       15.87242
95%         13.3           13.5       Skewness       .7050897
99%         20.3           20.3       Kurtosis       3.420989

/* interquartile range */

display 10.3-3.9
6.4

/* alternative method */

tabstat murder, stat(iqr)

    variable |       iqr
-------------+----------
      murder |       6.4
------------------------
Example 3.8, page 58.
clear
input score sample
 0 1
 4 1
 4 1
 5 1
 7 1
10 1
 0 2
 0 2
 1 2
 9 2
10 2
10 2
end

list

     +----------------+
     | score   sample |
     |----------------|
  1. |     0        1 |
  2. |     4        1 |
  3. |     4        1 |
  4. |     5        1 |
  5. |     7        1 |
     |----------------|
  6. |    10        1 |
  7. |     0        2 |
  8. |     0        2 |
  9. |     1        2 |
 10. |     9        2 |
     |----------------|
 11. |    10        2 |
 12. |    10        2 |
     +----------------+

tabstat score, by(sample) stat(n mean sd var)

Summary for variables: score
     by categories of: sample

  sample |         N      mean        sd  variance
---------+----------------------------------------
       1 |         6         5   3.34664      11.2
       2 |         6         5  5.138093      26.4
---------+----------------------------------------
   Total |        12         5  4.134115  17.09091
--------------------------------------------------
Table 3.9, page 62.
use https://stats.idre.ucla.edu/stat/stata/examples/smss/aidsdat, clear

tabulate aids [fw=freq]

       aids |      Freq.     Percent        Cum.
------------+-----------------------------------
          0 |      1,214       75.97       75.97
          1 |        204       12.77       88.74
          2 |         85        5.32       94.06
          3 |         49        3.07       97.12
          4 |         19        1.19       98.31
          5 |         13        0.81       99.12
          6 |          5        0.31       99.44
          7 |          8        0.50       99.94
          8 |          1        0.06      100.00
------------+-----------------------------------
      Total |      1,598      100.00

sum aids [fw=freq], detail

                            aids
-------------------------------------------------------------
      Percentiles      Smallest
 1%            0              0
 5%            0              1
10%            0              2       Obs                1598
25%            0              3       Sum of Wgt.        1598

50%            0                      Mean           .4730914
                        Largest       Std. Dev.      1.088548
75%            0              5
90%            2              6       Variance       1.184936
95%            3              7       Skewness       3.170576
99%            5              8       Kurtosis       14.87321
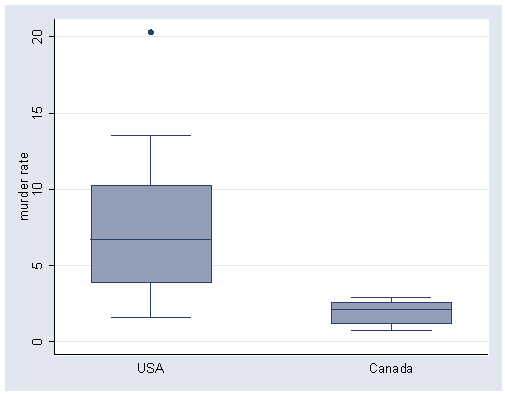
Figure 3.17, page 63.
use https://stats.idre.ucla.edu/stat/stata/examples/smss/murder2, clear

graph box murder, over(country)


