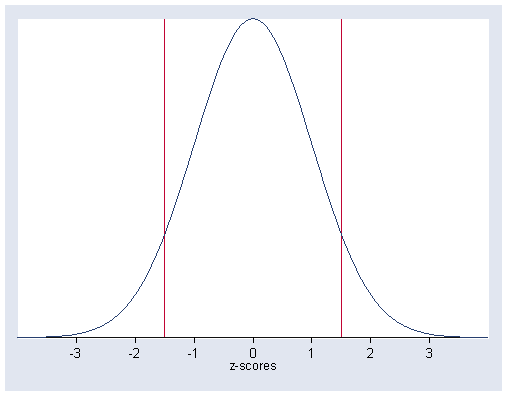
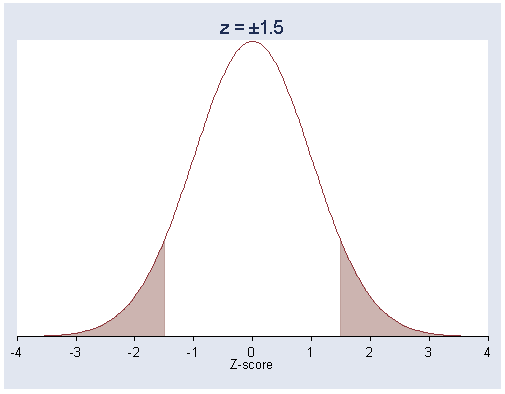
Figure 6.3, page 161. ztail and zdemo are available from ATS and can be downloaded over the Internet using the search command (see How can I use the search command to search for programs and get additional help? for more information about using search).
zdemo 1.5 -1.5
ztail .1336 2
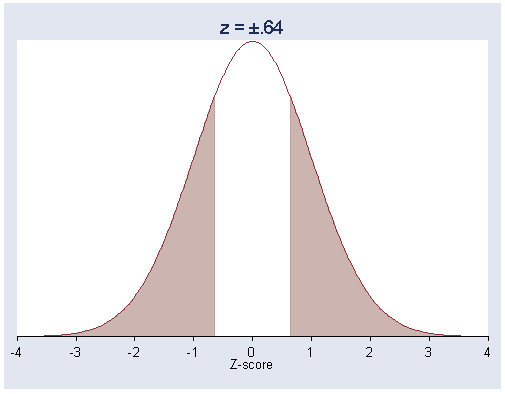
Z-score, page 163; figure 6.4, page 164. zcalc is available from ATS and can be downloaded over the Internet using the search command (see How can I use the search command to search for programs and get additional help? for more information about using search).
zcalc 4.032 4 1.257 627

z-score for sample means


      (m - mu)       (4.032 - 4)           (4.032 - 4)
 z = ----------  =  ---------------- =  -----------------  =  0.64
     s/sqrt(n)       1.257/sqrt(627)           0.0502

ztail .5222 2
Z-score, page 164. zcalc is available from ATS and can be downloaded over the Internet using the search command (see How can I use the search command to search for programs and get additional help? for more information about using search).
zcalc 4.032 4 1.257 6270

z-score for sample means


      (m - mu)       (4.032 - 4)           (4.032 - 4)
 z = ----------  =  ---------------- =  -----------------  =  2.02
     s/sqrt(n)       1.257/sqrt(6270)           0.0159
Confidence interval, page 165.
cii 627 4.032 1.257

    Variable |     Obs         Mean    Std. Err.       [95% Conf. Interval]
-------------+-------------------------------------------------------------
             |     627        4.032    .0501997         3.93342     4.13058
Z-score, page 166.
zcalc 3.01 0 7.309 29

z-score for sample means


      (m - mu)       (3.01 - 0)           (3.01 - 0)
 z = ----------  =  ---------------- =  -----------------  =  2.22
     s/sqrt(n)       7.309/sqrt(29)           1.3572
Test for a single proportion, page 170; confidence interval, page 171.
prtesti 1227 .482 .5

One-sample test of proportion                      x: Number of obs =     1227

------------------------------------------------------------------------------
Variable |      Mean    Std. Err.       z     P>|z|       [95% Conf. Interval]
---------+--------------------------------------------------------------------
       x |      .482    .0142648   33.7894   0.0000       .4540415    .5099585
------------------------------------------------------------------------------

                          Ho: proportion(x) = .5

       Ha: x < .5              Ha: x ~= .5               Ha: x > .5
        z = -1.261               z = -1.261               z = -1.261
    P < z =  0.1036        P > |z| =  0.2073          P > z =  0.8964

cii 1227 .482

                                                       -- Binomial Exact --
    Variable |     Obs         Mean    Std. Err.       [95% Conf. Interval]
-------------+-------------------------------------------------------------
             |    1227     .4816626    .0142645        .4533704    .5100448
Z-score, page 178.
zcalc 4.17 4 1.39 2879

z-score for sample means


      (m - mu)       (4.17 - 4)           (4.17 - 4)
 z = ----------  =  ---------------- =  -----------------  =  6.56
     s/sqrt(n)       1.39/sqrt(2879)           0.0259
Confidence interval using t, page 184.
cii 29 3.01 7.31

    Variable |     Obs         Mean    Std. Err.       [95% Conf. Interval]
-------------+-------------------------------------------------------------
             |      29         3.01    1.357433        .2294247    5.790575
Single-sample t-test, page 185.
ttesti 29 3.01 7.31 0

One-sample t test

------------------------------------------------------------------------------
         |     Obs        Mean    Std. Err.   Std. Dev.   [95% Conf. Interval]
---------+--------------------------------------------------------------------
       x |      29        3.01    1.357433        7.31    .2294247    5.790575
------------------------------------------------------------------------------
Degrees of freedom: 28

                               Ho: mean(x) = 0

     Ha: mean < 0               Ha: mean ~= 0              Ha: mean > 0
       t =   2.2174                t =   2.2174              t =   2.2174
   P < t =   0.9826          P > |t| =   0.0349          P > t =   0.0174
Power of a test, page 195. Stata uses the t-distribution rather than the z-distribution so the results below will differ slightly for the book value.
sampsi 0 10, alpha(.05) sd(18) n(36) onesample onesided

Estimated power for one-sample comparison of mean
  to hypothesized value

Test Ho: m =      0, where m is the mean in the population

Assumptions:

         alpha =   0.0500  (one-sided)
 alternative m =       10
            sd =       18
 sample size n =       36

Estimated power:

         power =   0.9543


