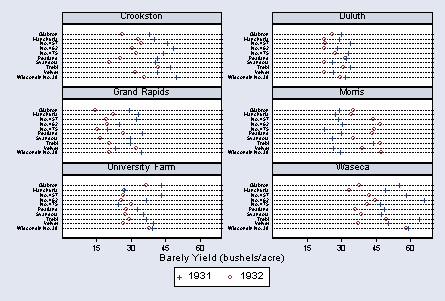
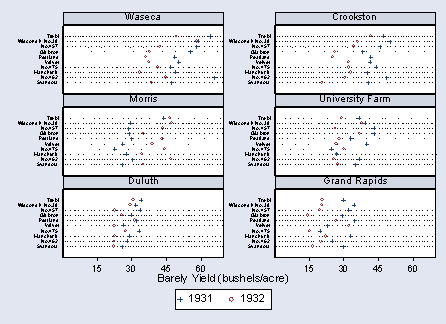
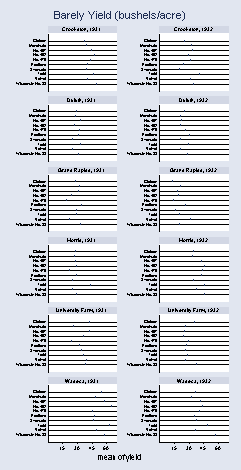
page 4, Figure 1.1
use "c:vizdatabarley.dta", clear

drop rownames

reshape wide yield, i(variety site) j(year)
(note: j = 1931 1932)


Data                               long   ->   wide
-----------------------------------------------------------------------------
Number of obs.                      120   ->      60
Number of variables                   4   ->       4
j variable (2 values)              year   ->   (dropped)
xij variables:
                                  yield   ->   yield1931 yield1932
-----------------------------------------------------------------------------


graph dot yield1931 yield1932, ///
 over(variety, gap(20) label(labsize(vsmall))) ///
 by(site, compact cols(2) b1title("Barely Yield (bushels/acre)") ///
 note("")) ylabel(15(15)60) marker(1,msymbol(+)) marker(2,msymbol(Oh)) ///
 legend(label(1 1931) label(2 1932))
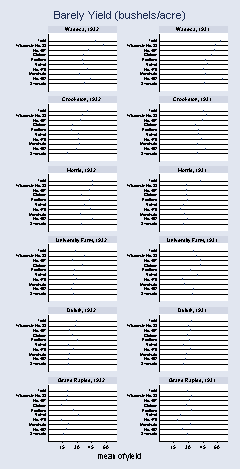
You can use the code below to have the graph ordered as it is in the text.
use "c:vizdatabarley.dta", clear

drop rownames

reshape wide yield, i(variety site) j( year)
(note: j = 1931 1932)


Data                               long   ->   wide
-----------------------------------------------------------------------------
Number of obs.                      120   ->      60
Number of variables                   4   ->       4
j variable (2 values)              year   ->   (dropped)
xij variables:
                                  yield   ->   yield1931 yield1932
-----------------------------------------------------------------------------


gen site2 = 1 if site=="Waseca"
(50 missing values generated)


replace site2 = 2 if site=="Crookston"
(10 real changes made)


replace site2 = 3 if site=="Morris"
(10 real changes made)


replace site2 = 4 if site=="University Farm"
(10 real changes made)


replace site2 = 5 if site=="Duluth"
(10 real changes made)


replace site2 = 6 if site=="Grand Rapids"
(10 real changes made)


label define sitelbl 1 "Waseca" 2 "Crookston" 3 "Morris" ///
 4 "University Farm" 5 "Duluth" 6 "Grand Rapids"


label values site2 sitelbl


gen var = 1


replace var = 2 if variety == "Wisconsin No. 38"
(6 real changes made)


replace var = 3 if variety == "No. 457"
(6 real changes made)


replace var = 4 if variety == "Glabron"
(6 real changes made)


replace var = 5 if variety == "Peatland"
(6 real changes made)


replace var = 6 if variety == "Velvet"
(6 real changes made)


replace var = 7 if variety == "No. 475"
(6 real changes made)


replace var = 8 if variety == "Manchuria"
(6 real changes made)


replace var = 9 if variety == "No. 462"
(6 real changes made)


replace var = 10 if variety == "Svansota"
(6 real changes made)


label define varlbl 1 "Trebi" 2 "Wisconsin No. 38" 3 "No. 457" ///
 4 "Glabron" 5 "Peatland" 6 "Velvet" 7 "No. 475" 8 "Manchuria" ///
 9 "No. 462" 10 "Svansota"


label values var varlbl


graph dot yield1931 yield1932, ///
 over(var, gap(20) label(labsize(vsmall))) ///
 by(site2, compact cols(2) b1title("Barely Yield (bushels/acre)") ///
 note("")) ylabel(15(15)60) marker(1,msymbol(+)) marker(2,msymbol(Oh)) ///
 legend(label(1 1931) label(2 1932))
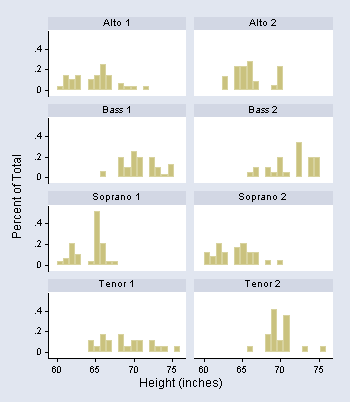
page 7, Figure 1.2
use "c:vizdatasinger.dta", clear


histogram height, by(voice, col(2) note("")) bin(20) ///
 ylabel(0 .20 .40, nogrid) xtitle("Height (inches)") ///
 ytitle("Percent of Total") xlabel(60(5)75) xsize(1) ysize(1.2) ///
 ylabel( , angle(0))
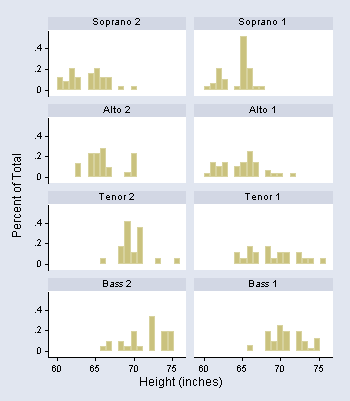
To have the panels ordered as they are in the text, you need to create a new variable and label its values.
gen voice1 = 1


replace voice1 = 2 if voice_part == "Soprano 1"
(36 real changes made)


replace voice1 = 3 if voice_part == "Alto 2"
(27 real changes made)


replace voice1 = 4 if voice_part == "Alto 1"
(35 real changes made)


replace voice1 = 5 if voice_part == "Tenor 2"
(21 real changes made)


replace voice1 = 6 if voice_part == "Tenor 1"
(21 real changes made)


replace voice1 = 7 if voice_part == "Bass 2"
(26 real changes made)


replace voice1 = 8 if voice_part == "Bass 1"
(39 real changes made)


label define voicelbl 1 "Soprano 2" 2 "Soprano 1" 3 "Alto 2" ///
 4 "Alto 1" 5 "Tenor 2" 6 "Tenor 1" 7 "Bass 2" 8 "Bass 1"


label values voice1 voicelbl


histogram height, by(voice1, col(2) note("")) bin(20) ///
 ylabel(0 .20 .40, nogrid) xtitle("Height (inches)") ///
 ytitle("Percent of Total") xlabel(60(5)75) xsize(1) ysize(1.2) ///
 ylabel( , angle(0))
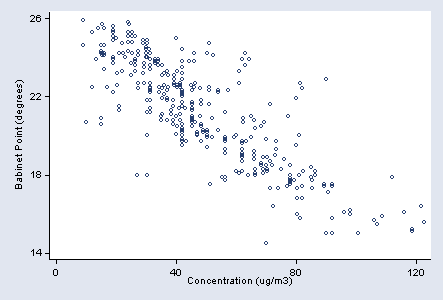
page 9, Figure 1.3
use "c:vizdatapolarization.dta", clear


scatter babinet concentration, xlabel(0(40)120) ///
 ylabel(14(4)26, nogrid angle(0)) xtitle("Concentration (ug/m3)") ///
 ytitle("Babinet Point (degrees)") msymbol(Oh)
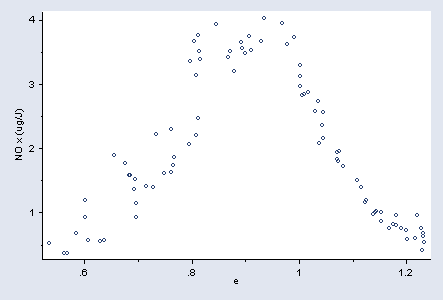
page 11, Figure 1.4
use "c:vizdataethanol.dta", clear


scatter nox e, ylabel(1(1)4, nogrid angle(0)) xlabel(.6(.2)1.2) ///
 ylabel(1(1)4) ymtick(.5(1)3.5) msymbol(Oh) xmtick(.7(.2)1.2) ///
 ytitle("NO x (ug/J)")
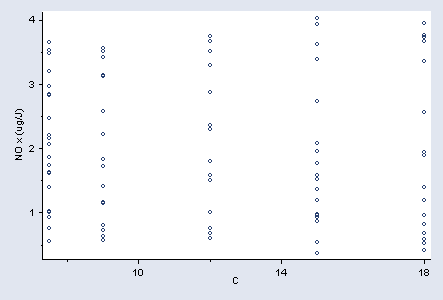
page 11, Figure 1.5
scatter nox c, ylabel(1(1)4, nogrid angle(0)) xlabel(10(4)18) ///
 ylabel(1(1)4) ymtick(.5(1)3.5) msymbol(Oh) xmtick(8(2)12) xtitle("C") ///
 ytitle("NO x (ug/J)")
page 13, Figure 1.6
use "c:vizdatabarley.dta", clear


graph dot yield, over(variety, label( labsize(small))) ///
 by(site year, title("Barely Yield (bushels/acre)") ///
 note("") cols(2)) ylabel(15(15)60) ysize(4) xsize(2) ymtick(20(5)65)
You can use the code below to have the graph ordered as it is in the text.
use "c:vizdatabarley.dta", clear


gen site2 = 1 if site=="Waseca" & year == 1932
(110 missing values generated)


replace site2 = 2 if site=="Waseca" & year == 1931
(10 real changes made)


replace site2 = 3 if site=="Crookston" & year == 1932
(10 real changes made)


replace site2 = 4 if site=="Crookston" & year == 1931
(10 real changes made)


replace site2 = 5 if site=="Morris" & year == 1932
(10 real changes made)


replace site2 = 6 if site=="Morris" & year == 1931
(10 real changes made)


replace site2 = 7 if site=="University Farm" & year == 1932
(10 real changes made)


replace site2 = 8 if site=="University Farm" & year == 1931
(10 real changes made)


replace site2 = 9 if site=="Duluth" & year == 1932
(10 real changes made)


replace site2 = 10 if site=="Duluth" & year == 1931
(10 real changes made)


replace site2 = 11 if site=="Grand Rapids" & year == 1932
(10 real changes made)


replace site2 = 12 if site=="Grand Rapids" & year == 1931
(10 real changes made)


label define sitelbl 1 "Waseca" 2 "Waseca" 3 "Crookston" 4 "Crookston" ///
 5 "Morris" 6 "Morris" 7 "University Farm" 8 "University Farm" ///
 9 "Duluth" 10 "Duluth" 11 "Grand Rapids" 12 "Grand Rapids"


label values site2 sitelbl


gen var = 1


replace var = 2 if variety == "Wisconsin No. 38"
(12 real changes made)


replace var = 3 if variety == "No. 457"
(12 real changes made)


replace var = 4 if variety == "Glabron"
(12 real changes made)


replace var = 5 if variety == "Peatland"
(12 real changes made)


replace var = 6 if variety == "Velvet"
(12 real changes made)


replace var = 7 if variety == "No. 475"
(12 real changes made)


replace var = 8 if variety == "Manchuria"
(12 real changes made)


replace var = 9 if variety == "No. 462"
(12 real changes made)


replace var = 10 if variety == "Svansota"
(12 real changes made)


label define varlbl 1 "Trebi" 2 "Wisconsin No. 38" 3 "No. 457" ///
 4 "Glabron" 5 "Peatland" 6 "Velvet" 7 "No. 475" 8 "Manchuria" ///
 9 "No. 462" 10 "Svansota"


label values var varlbl


graph dot yield, over(var, label(labsize(small))) ///
 by(site2 year, title("Barely Yield (bushels/acre)") note("") cols(2)) ///
 ymtick(20(5)65) ylabel(15(15)60) ysize(4) xsize(2)

