This page presents examples of user written graphics programs. You can obtain these programs by typing, search command_name, into the Stata command line and following the instructions. This page is not an exhaustive list of all user written graphics commands but merely a collection of the ones that we use most frequently. To our knowledge there is no cannonical list of user written graph commands.
This page contains only the commands and the plots themselves, there is no further explanation. We envision that users will look through the plots and when they find one that appears to do what they want, they will download the program and carefully read the help files.
Most of these examples use the the hsb2 dataset which can be downloaded from within Stata using the following command:
use https://stats.idre.ucla.edu/stat/stata/notes3/hsb2, clearNote: Most of the graphs were produced using the scheme lean1. Whenever a different scheme is used, it is given in the command.
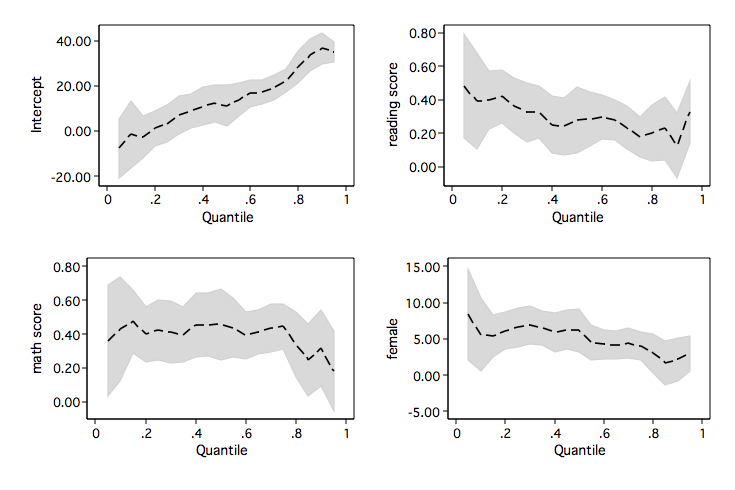
grqreg — graph the coefficients of a quantile regression
qreg write read math female
grqreg, cons ci
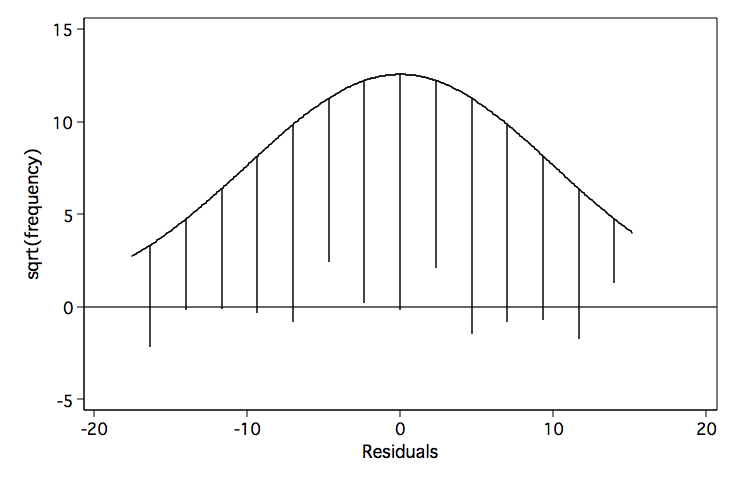
hangroot — hanging rootogram
regress write read female
predict resid, resid
hangroot resid


