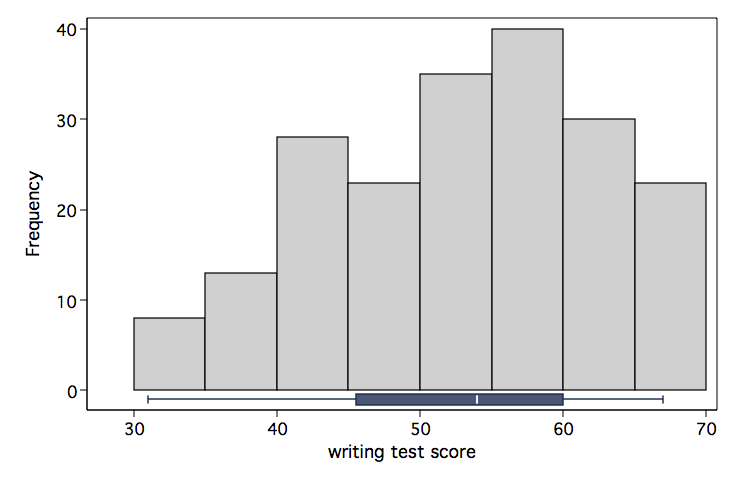
UCLA ATS has written a command called histbox that will produce this type of graph. To get this program just type the following into the Stata command box and follow the instructions: search histbox
use https://stats.idre.ucla.edu/stat/stata/notes/hsb2, clear

histbox write, start(30) width(5) xtitle(Writing Test Score)
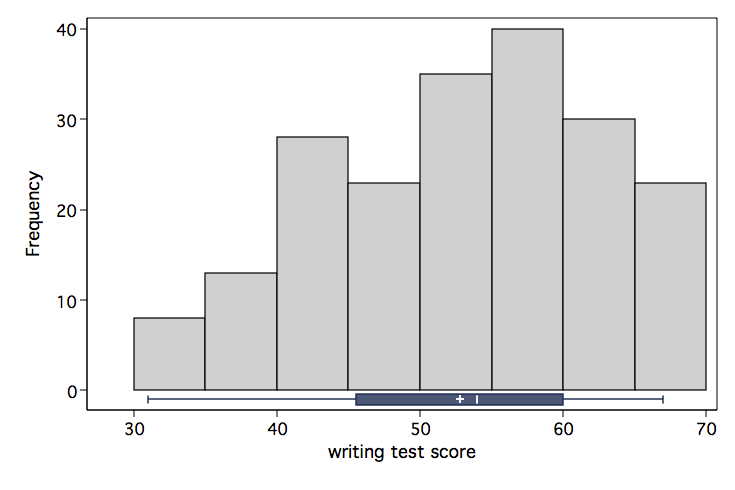
The histbox command also has an option to display the mean in the boxplot.
histbox write, mean start(30) width(5) xtitle(Writing Test Score)
If you would like to see how this type of graph can be constructed please view A code fragment for combining a histogram and boxplot in one graph on our Stata Code Fragments page.


