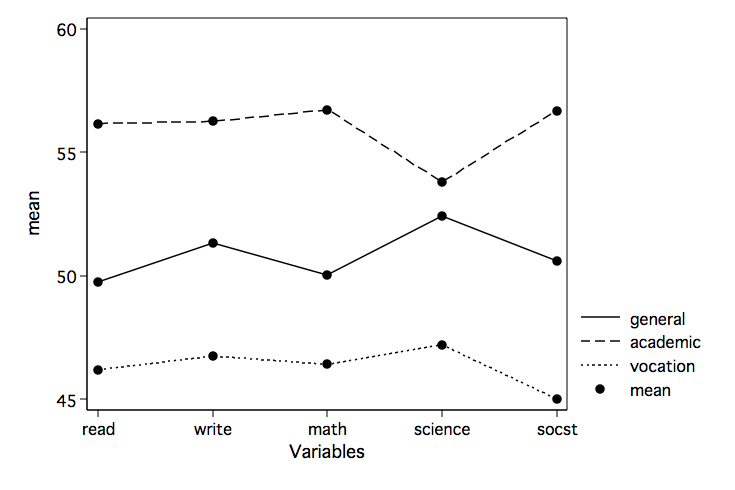
A profileplot graphs the levels of several variables for two or more groups. One can then compare the profiles of the groups to one another. The user-written a command called profileplot that will produce this type of graph. To get this program just type the following into the Stata command box and follow the instructions: search profileplot (see How can I use the search command to search for programs and get additional help? for more information about using search).
use https://stats.idre.ucla.edu/stat/stata/notes/hsb2, clear

profileplot read write math science socst, by(prog)
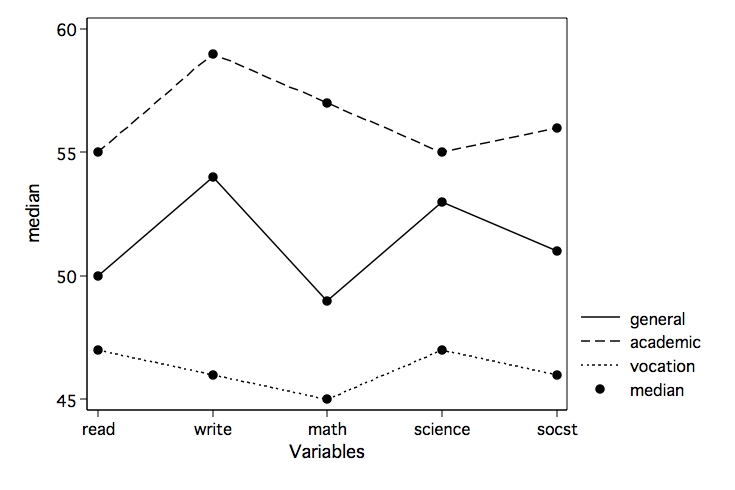
The profileplot command also has an option to display the profile using medians instead of means.
profileplot read write math science socst, by(prog) median


