Stata makes it very easy to create a scatterplot and regression line using the graph twoway command. We will illustrate this using the hsb2 data file.
use https://stats.idre.ucla.edu/stat/stata/notes/hsb2
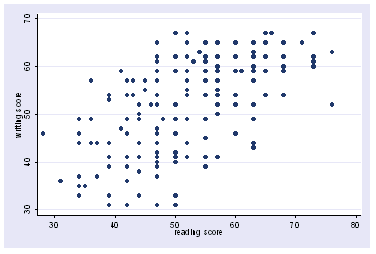
Here we can make a scatterplot of the variables write with read
graph twoway scatter write read
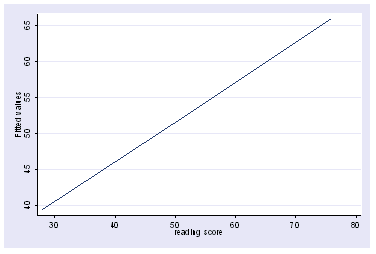
We can likewise show a graph showing the predicted values of write by read as shown below.
graph twoway lfit write read
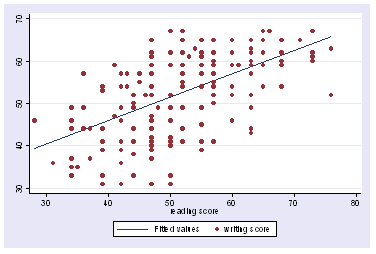
Having seen how to make these separately, we can overlay them into one graph as shown below.
graph twoway (lfit write read) (scatter write read)
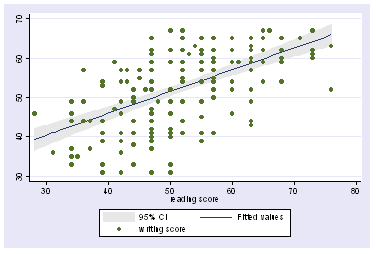
And we can even show the fitted value with a confidence interval for the mean as shown below.
graph twoway (lfitci write read) (scatter write read)


