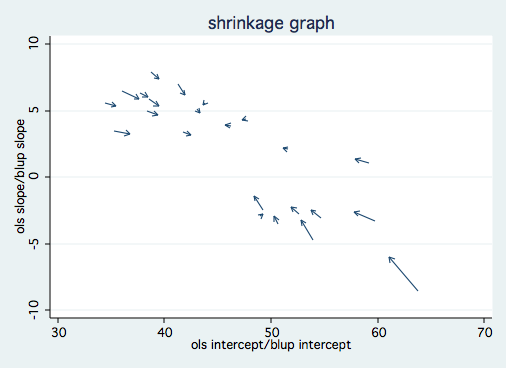
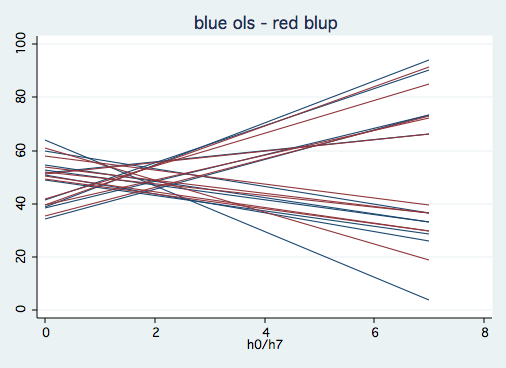
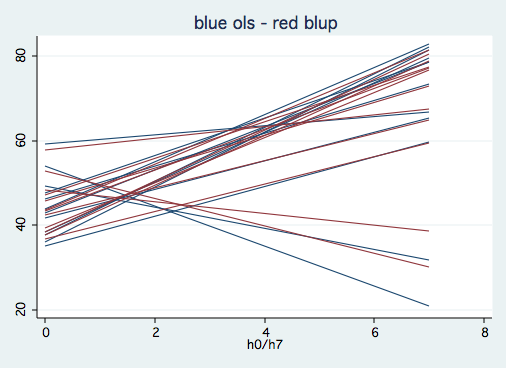
There are two ways you could go about this: 1) graph the shrinkage of OLS to BLUP (Best Linear Unbiased Predictor) and 2) graph both the fitted OLS regression lines and the BLUP fitted lines on the same graph.
Below is a do-file that does both of these for the imm23.dta that was used in the Kreft and de Leeuw Introduction to multilevel modeling.
The shrinkage graph has slopes on the vertical axis and intercepts on the horizontal axis. The tails of the arrows give the OLS values and the points give the BLUP values.
Note that there is less variability in the BLUP intercepts which also have flatter slopes than their OLS counterparts.
/* generate ols intercepts and slopes using statsby */

use https://stats.idre.ucla.edu/stat/stata/examples/mlm_imm/imm23.dta, clear
statsby , by(schi): regress math homework
rename _b_homework slope
rename _b_cons intercept
label var slope "ols slope"
label var intercept "ols intercept"
sort schid
save t2, replace

/* generate blup intercepts and slopes using xtmixed */

use https://stats.idre.ucla.edu/stat/stata/examples/mlm_imm/imm23.dta, clear
egen grp=group(schid)
quietly mixed math homework || schid: homework, covar(un)
predict u1 u0, reffects
generate s = _b[homework] + u1
generate i = _b[_cons] + u0
label var s "blup slope"
label var i "blup intercept"

by schid, sort: generate n = _n
merge schid using t2
list schid slope intercept s i if n==1, clean

/* graph one -- shrinkage graph */

twoway pcarrow slope intercept s i if n==1
more

/* graphs two & three -- graphs of regression lines */

generate h0 = 0
generate h7 = 7
generate o0 = intercept + slope*h0
generate o7 = intercept + slope*h7
generate b0 = i + s*h0
generate b7 = i + s*h7

/* graph is split into two parts due to the number of fitted lines being displayed */

twoway (pcspike  o0 h0 o7 h7 if n==1 & grp<12)  ///
       (pcspike b0 h0 b7 h7 if n==1 &  grp<12), /// legend(off) title("blue ols - red blup") more twoway (pcspike o0 h0 o7 h7 if n==1 & grp>11)  ///
       (pcspike b0 h0 b7 h7 if n==1 &  grp>11), ///
       legend(off) title("blue ols - red blup")
Below is the output generated by the do-file.
       schid       slope   interc~t           s          i
  1.    6053    2.091476   51.61236    2.167148    51.1254
 45.    6327   -8.566667       63.8   -6.033969   61.11028
 53.    6467    6.981482   41.24074    6.158613   41.90844
 58.    7194   -2.795455   52.65152   -2.215304   51.89136
 82.    7472   -3.553797   50.68354   -2.952869   50.28959
105.    7474   -3.306123   59.77551   -2.600884   57.82726
122.    7801   -3.069767   54.69556   -2.453294   53.71066
144.    7829   -2.920123   49.01229   -2.777317   49.28519
164.    7930    7.909091      38.75     7.39565   39.50748
188.   24371           5      38.35    4.681487   39.36426
208.   24725    5.592664   34.39382    5.351505   35.48435
230.   25456   -4.718411   53.93863   -3.234086   52.85429
252.   25642   -2.486056   49.25896   -1.397812   48.43803
272.   26537    3.874317   46.20492    3.900892   45.72621
288.   46417     4.40731   47.64752    4.299445     47.299
311.   47583    3.376682   41.76413    3.198847   42.51505
331.   54344    3.507732   35.22423     3.24509   36.74875
350.   62821     1.09464   59.21022      1.3621   57.89467
417.   68448     6.49631   36.05535    5.893169   37.65525
438.   68493        5.86      38.52     5.31894     39.459
459.   72080    5.094132   43.03178    4.821579   43.33112
486.   72292    6.335052   37.71392     6.01733   38.44124
506.   72991       5.575   43.77857    5.397511   43.62207


