
This sounds like it should be pretty easy. Let’s load the hsbdemo
dataset and overlay histograms for males and female for the variable write.
use https://stats.idre.ucla.edu/stat/data/hsbdemo, clear

twoway (histogram write if female==1, start(30) width(5)) ///
       (histogram write if female==0, start(30) width(5))
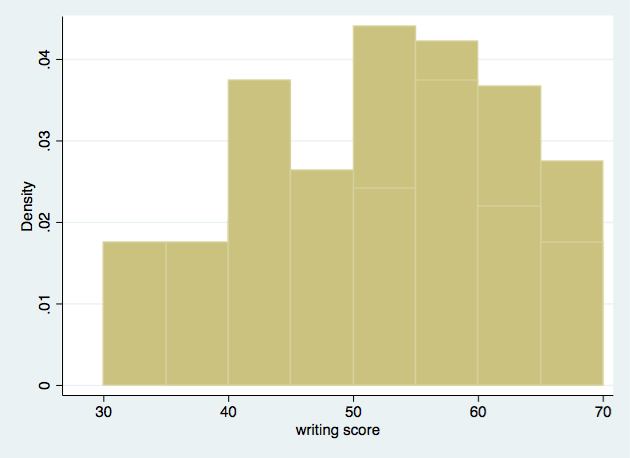
Well, that didn’t work out so well. Both histograms were rendered in the same color. Let’s
change the female histogram color to green. We can do this with the color(green)
option, which sets both the fill color and line color to green.
twoway (histogram write if female==1, start(30) width(5) color(green)) ///
       (histogram write if female==0, start(30) width(5)), ///
	   legend(order(1 "Female" 2 "Male" ))
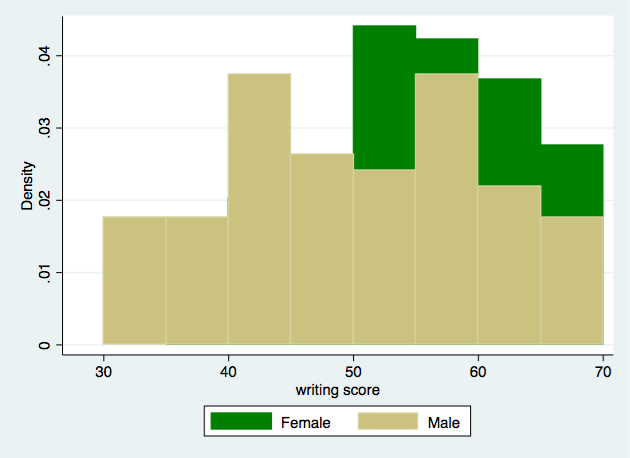
That’s a bit better, but parts of the male histogram still block out our view of the
female histogram. So, let’s render the male histogram as transparent rectangles with
black outlines. The option fcolor(none) sets the fill color to none while
the lcolor(black) option sets the line color to black.
twoway (histogram write if female==1, start(30) width(5) color(green)) ///
       (histogram write if female==0, start(30) width(5) ///
	   fcolor(none) lcolor(black)), legend(order(1 "Female" 2 "Male" ))
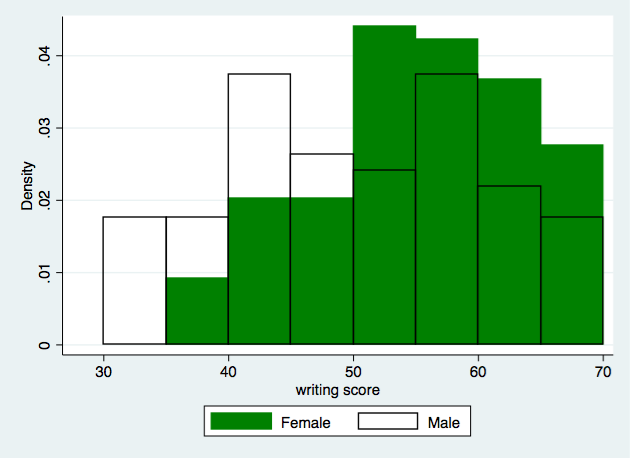
Now the we can see that females have more density to the right of the graph while the males have more density towards the left side.
An even better method is to add transparency, which became available as of Stata 15. Transparency is specified as a color modifier. The option color(red%30) makes the female histogram red with 30 percent opacity and color(green%30) makes the male histogram green with 30 percent opacity. The higher the opacity, the less transparent the histogram will become. So 100% opacity is the same as the original histogram.
twoway (histogram write if female==1, start(30) width(5) color(red%30)) ///
       (histogram write if female==0, start(30) width(5) color(green%30)), ///
       legend(order(1 "Female" 2 "Male" ))
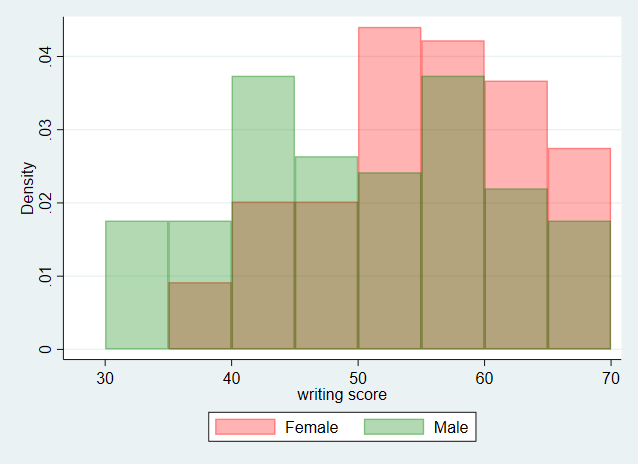
Thanks to Maxim Massenkoff for submitting the additional code and figure.