In Stata it is very easy to get the area under the ROC curve following either logit or logistic by using the lroc command. However, with lroc you cannot compare the areas under the ROC curve for two different models. It is possible to do this using the logistic linear predictors and the roccomp command.Here is an example:
use https://stats.idre.ucla.edu/stat/stata/notes/hsb2.dta, clear

generate hon=write>=60  /* create binary response variable */

logit hon female, nolog

Logit estimates                                   Number of obs   =        200
                                                  LR chi2(1)      =       3.94
                                                  Prob > chi2     =     0.0473
Log likelihood =  -113.6769                       Pseudo R2       =     0.0170

------------------------------------------------------------------------------
         hon |      Coef.   Std. Err.      z    P>|z|     [95% Conf. Interval]
-------------+----------------------------------------------------------------
      female |   .6513707   .3336752     1.95   0.051    -.0026207    1.305362
       _cons |  -1.400088   .2631619    -5.32   0.000    -1.915876   -.8842998
------------------------------------------------------------------------------

lroc, nograph

Logistic model for hon

number of observations =      200
area under ROC curve   =   0.5785

predict xb1, xb  /* create linear predictor for model 1 */

logit hon female read, nolog

Logit estimates                                   Number of obs   =        200
                                                  LR chi2(2)      =      60.40
                                                  Prob > chi2     =     0.0000
Log likelihood =  -85.44372                       Pseudo R2       =     0.2612

------------------------------------------------------------------------------
         hon |      Coef.   Std. Err.      z    P>|z|     [95% Conf. Interval]
-------------+----------------------------------------------------------------
      female |   1.120926   .4081028     2.75   0.006      .321059    1.920793
        read |   .1443657   .0233337     6.19   0.000     .0986325    .1900989
       _cons |  -9.603365   1.426404    -6.73   0.000    -12.39906   -6.807665
------------------------------------------------------------------------------


lroc, nograph

Logistic model for hon

number of observations =      200
area under ROC curve   =   0.8330


predict xb2, xb  /* create linear predictor for model 2 */
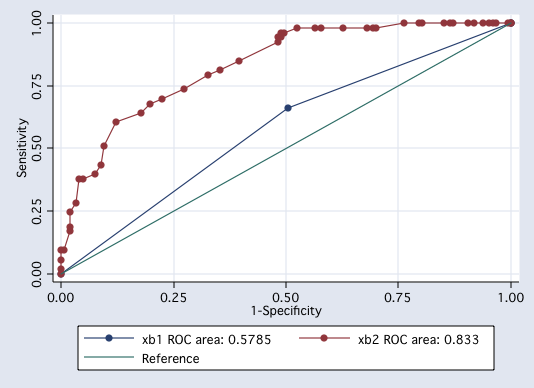
We have run two different models and have areas under the ROC curve of .5785 and .8330. Next, we will use the two linear predictors with the roccomp command to get a test of the differences in area under the ROC curve.
roccomp hon xb1 xb2, graph summary

                              ROC                    -Asymptotic Normal--
                   Obs       Area     Std. Err.      [95% Conf. Interval]
-------------------------------------------------------------------------
xb1                200     0.5785       0.0254        0.52870     0.62828
xb2                200     0.8330       0.0305        0.77329     0.89274
-------------------------------------------------------------------------
Ho: area(xb1) = area(xb2)
    chi2(1) =    50.18       Prob>chi2 =   0.0000
Using roccomp with linear predictors from logistic regression will work with both nested and non-nested models.
Thanks to Sid Port for suggesting this approach.
Reference
Mario A. Cleves, From the help desk: Comparing areas under receiver operating characteristic curves from two or more probit or logit models, The Stata Journal (2002) 2, No. 3, pp 301-313.