It is not very difficult to perform path analysis using Stata’s regress command, but it does require the use of a regress command for each stage in the path analysis model. pathreg is a convenience command that can compute the path analysis with a single command. You can download pathreg over the internet by typing search pathreg (see How can I used the search command to search for programs and get additional help? for more information about using search).
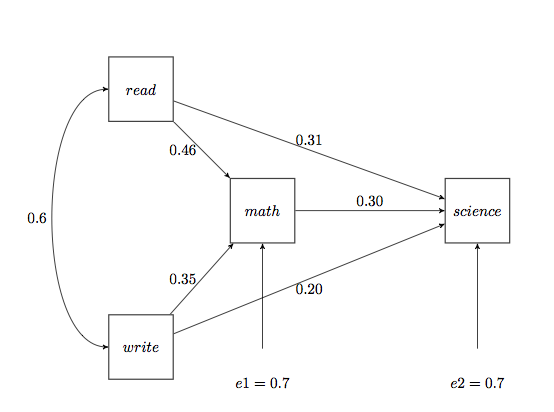
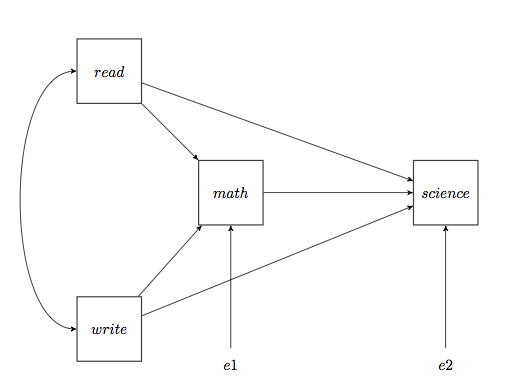
Let’s say that we want to estimate the following path model using the hsb2 dataset.
We will begin by downloading the data over the internet and getting the correlation between the two exogenous variables, read and write.
use https://stats.idre.ucla.edu/stat/data/hsb2, clear

corr read write
(obs=200)

             |     read    write
-------------+------------------
        read |   1.0000
       write |   0.5968   1.0000
This path analysis is really just two regression models. The first model is
math = _cons + read + write while
the second model is science = _cons + math + read + write. Using pathreg we just
place each model inside parentheses (leaving off the equal signs, plus signs and constants). We will use the standardized regression coefficients (Beta) as our path coefficients. Now we can
add the path coefficients and errors,
sqrt(1 – R2) to the path diagram as shown below.
pathreg (math read write)(science math read write)

------------------------------------------------------------------------------
        math |      Coef.   Std. Err.      t    P>|t|                     Beta
-------------+----------------------------------------------------------------
        read |   .4169486   .0564838     7.38   0.000                 .4563134
       write |   .3411219   .0610982     5.58   0.000                 .3451322
       _cons |   12.86507    2.82162     4.56   0.000                        .
------------------------------------------------------------------------------
                 n = 200  R2 = 0.5153  sqrt(1 - R2) = 0.6962

------------------------------------------------------------------------------
     science |      Coef.   Std. Err.      t    P>|t|                     Beta
-------------+----------------------------------------------------------------
        math |   .3190094   .0766753     4.16   0.000                  .301854
        read |   .3015317   .0686815     4.39   0.000                 .3122533
       write |   .2065257   .0707644     2.92   0.004                 .1977167
       _cons |   8.407353   3.192799     2.63   0.009                        .
------------------------------------------------------------------------------
                 n = 200  R2 = 0.4999  sqrt(1 - R2) = 0.7071


