This module shows examples of the different kinds of graphs that can be created with the graph twoway command. This is illustrated by showing the command and the resulting graph. For more information, see the Stata Graphics Manual available over the web and from within Stata by typing help graph, and in particular the section on Two Way Scatterplots.
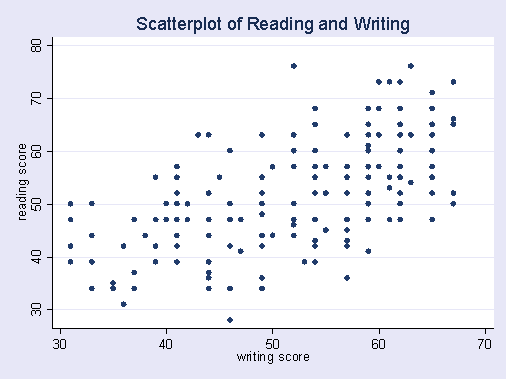
Adding a titlegraph twoway scatter read write, ///
title("Scatterplot of Reading and Writing")
|
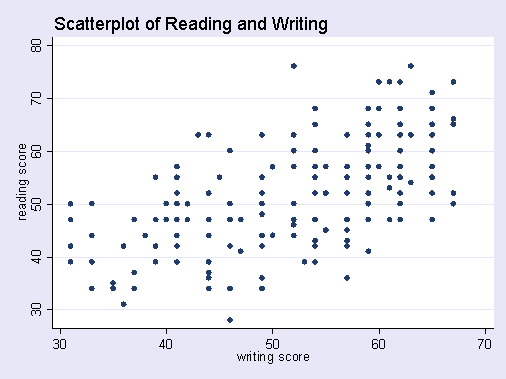
Black title, positioned at 11 O’Clockgraph twoway scatter read write, ///
title("Scatterplot of Reading and Writing", ///
color(black) position(11))
|
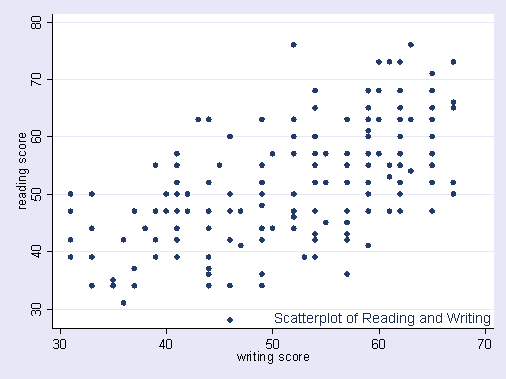
Title at 5 O’Clock, medium size text, positioned within the graphgraph twoway scatter read write, ///
title("Scatterplot of Reading and Writing", ///
size(medium) position(5) ring(0))
|
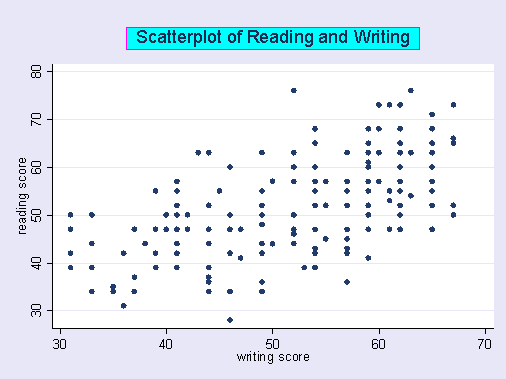
Title in a box with cyan background, magenta border and a medium margin around the titlegraph twoway scatter read write, ///
title("Scatterplot of Reading and Writing", ///
box bcolor(cyan) blcolor(magenta) bmargin(medium))
|
Two line title with a gap of 3 between the titlesgraph twoway scatter read write, ///
title("Scatterplot of Reading and Writing" ///
"Sample of 200 Students", linegap(3) )
|
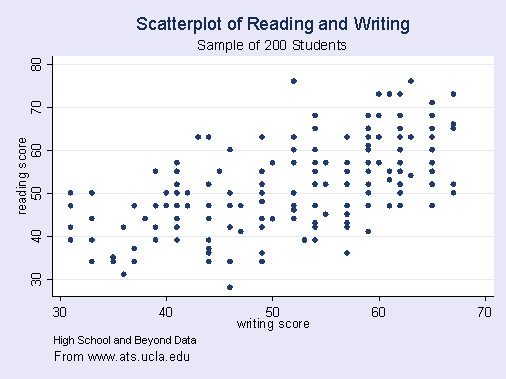
Graph with title, subtitle, caption, and a notegraph twoway scatter read write, ///
title("Scatterplot of Reading and Writing") ///
subtitle("Sample of 200 Students") ///
note(High School and Beyond Data) ///
caption(From www.ats.ucla.edu)
|
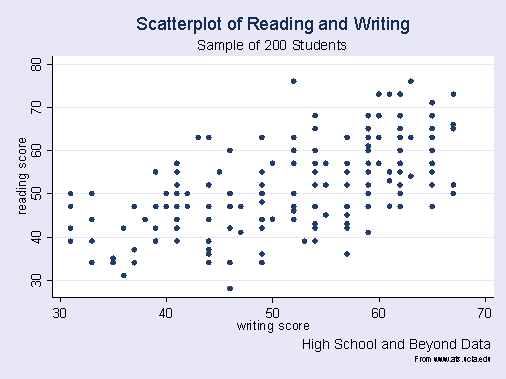
Moving and sizing note and captiongraph twoway scatter read write, ///
title("Scatterplot of Reading and Writing") ///
subtitle("Sample of 200 Students") ///
note(High School and Beyond Data, size(medium) position(5)) ///
caption(From www.ats.ucla.edu, size(vsmall) position(5))
|
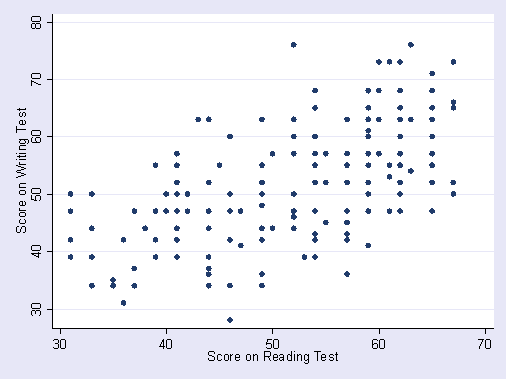
Modifying title on x and y axistwoway scatter read write, /// ytitle(Score on Writing Test) /// xtitle(Score on Reading Test)
|
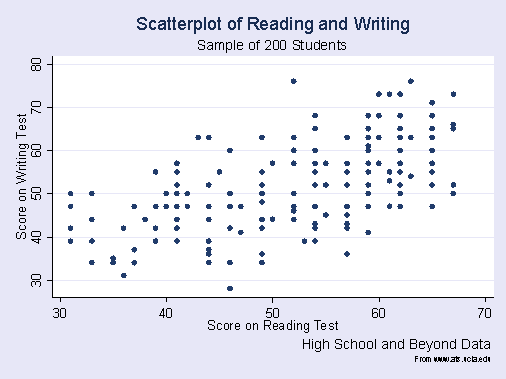
Complete exampletwoway scatter read write, ///
title("Scatterplot of Reading and Writing") ///
subtitle("Sample of 200 Students") ///
note(High School and Beyond Data, size(medium) position(5)) ///
caption(From www.ats.ucla.edu, size(vsmall) position(5)) ///
ytitle(Score on Writing Test) ///
xtitle(Score on Reading Test)
|
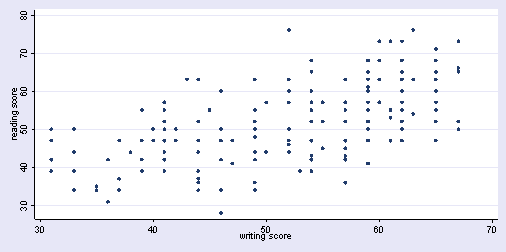
Sizing graph to have 4 by 2 aspect ratiotwoway scatter read write, ysize(2) xsize(4) |
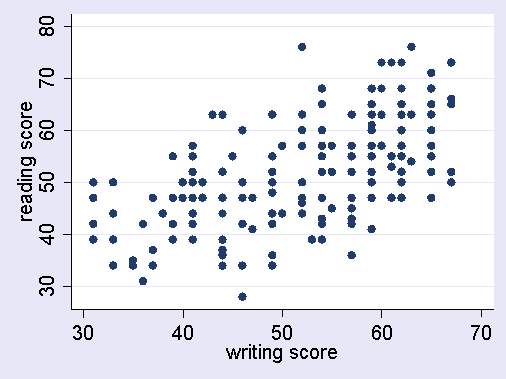
Making text scaled 1.5 times normal sizegraph twoway scatter read write, scale(1.5) |
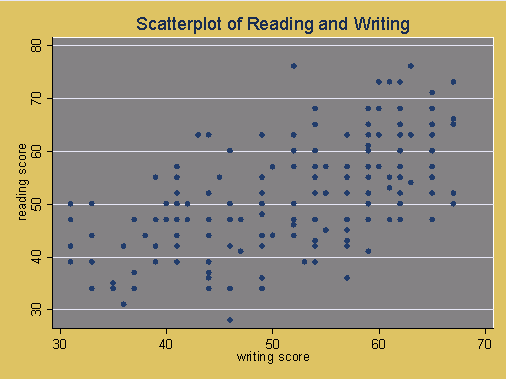
Graph with sand color outside graph, gray inside graphgraph twoway scatter read write, ///
title("Scatterplot of Reading and Writing") ///
graphregion( color(sand) ) plotregion( fcolor(gray) )
|
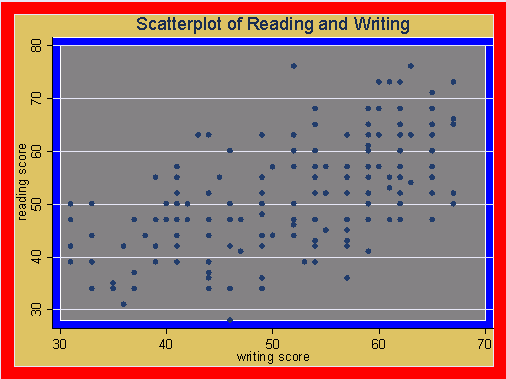
Graph with sand color outside graph, gray inside graph, red outer border, blue inner bordergraph twoway scatter read write, ///
title("Scatterplot of Reading and Writing") ///
graphregion( fcolor(red) ifcolor(sand) ) ///
plotregion( fcolor(blue) ifcolor(gray))
|
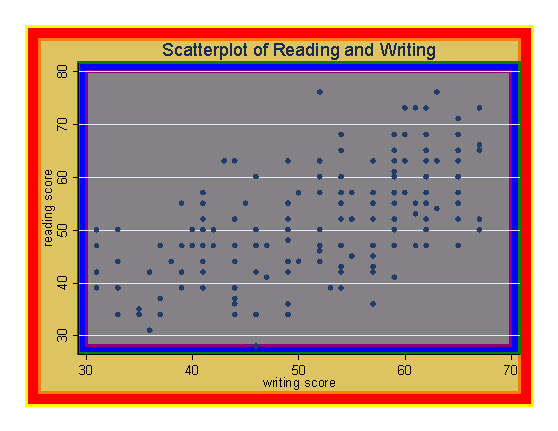
Graph with colors for many border elementsgraph twoway scatter read write, ///
title("Scatterplot of Reading and Writing") ///
graphregion( fcolor(red) lcolor(yellow) lwidth(thick) ///
ifcolor(sand) ilcolor(orange) ilwidth(thick)) ///
plotregion( fcolor(blue) lcolor(green) lwidth(thick) ///
ifcolor(gray) ilcolor(purple) ilwidth(thick))
|

