This module shows examples of the different kinds of graphs that can be created with the graph twoway command. This is illustrated by showing the command and the resulting graph. For more information, see the Stata Graphics Manual available over the web and from within Stata by typing help graph, and in particular the section on Two Way Scatterplots.
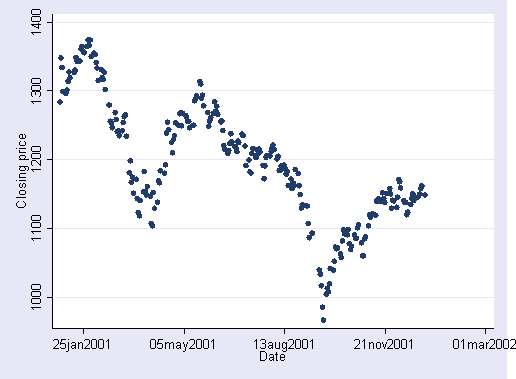
Basic twoway scatterplotsysuse sp500 graph twoway scatter close date
|
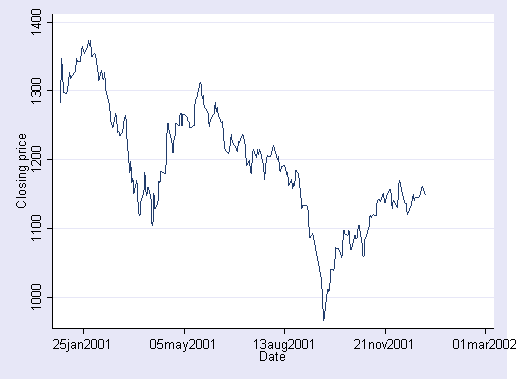
Line Plotgraph twoway line close date
|
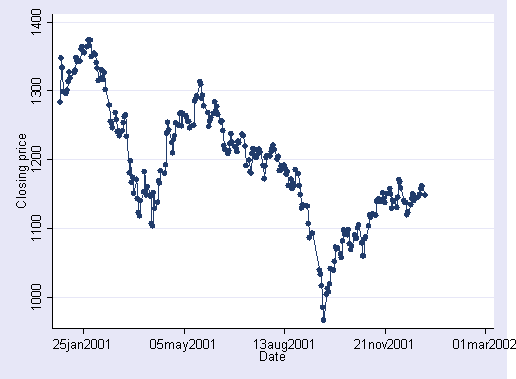
Connected Line Plotgraph twoway connected close date
|
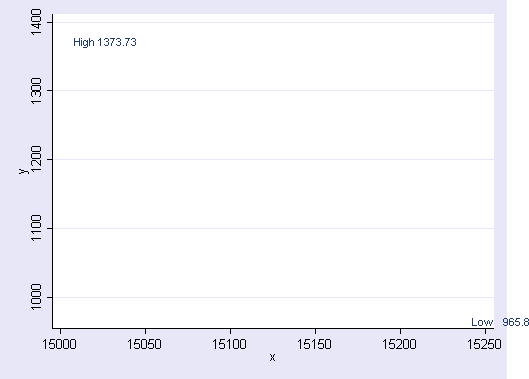
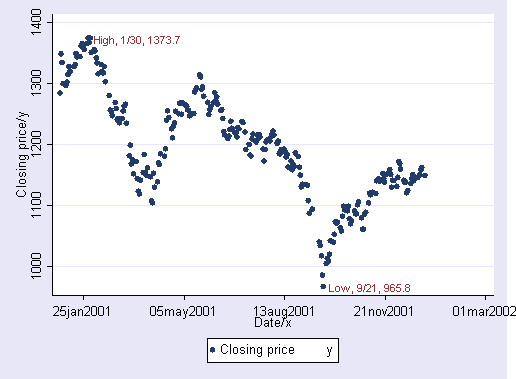
Immediate scatterplotgraph twoway scatteri /// 965.8 15239 (3) "Low 965.8" /// 1373.73 15005 (3) "High 1373.73" , msymbol(i) Note: Including (3) denotes the label position, by default labels are positioned at 3 o’clock
|
Scatterplot and Immediate Scatterplot
|
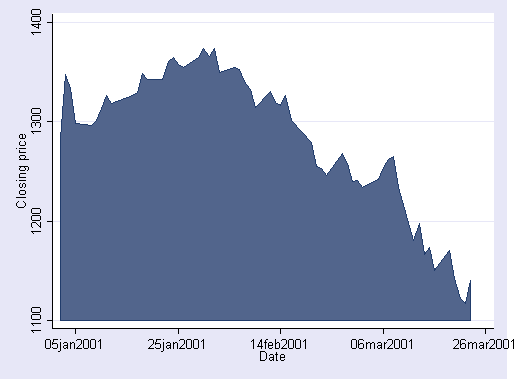
Area Graphdrop if _n > 57 graph twoway area close date, sort
|
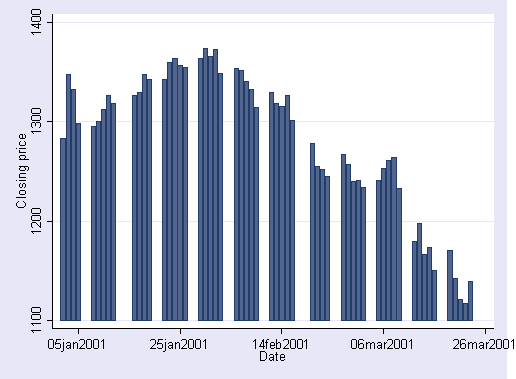
Bar plotgraph twoway bar close date
|
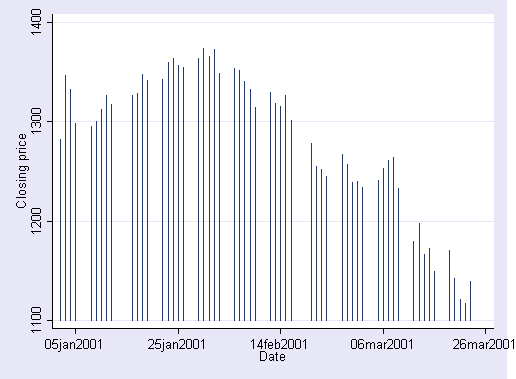
Spike plotgraph twoway spike close date
|
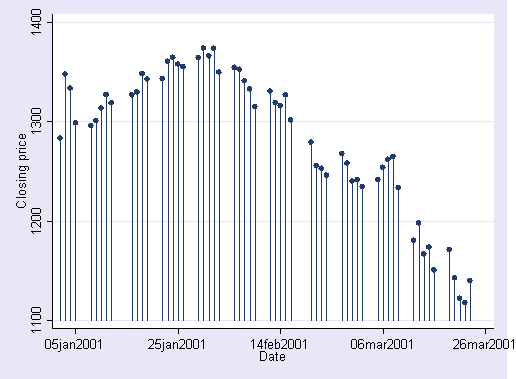
Dropline plotgraph twoway dropline close date
|
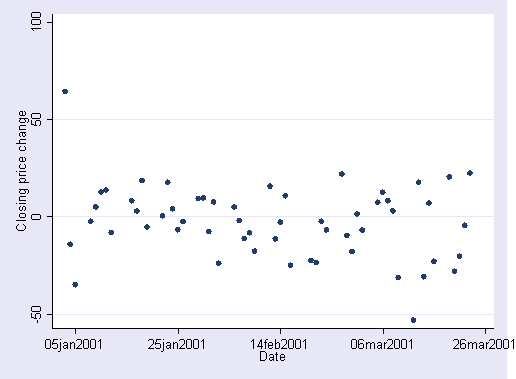
Dot plotgraph twoway dot change date
|
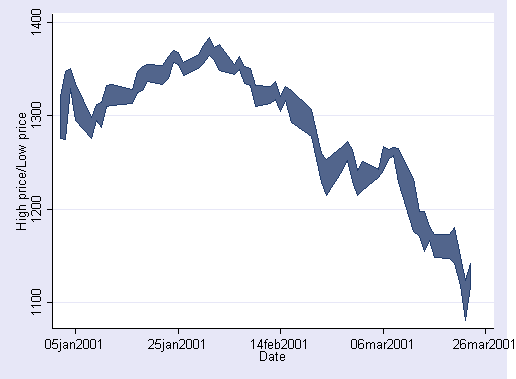
Range plot with area shadinggraph twoway rarea high low date
|
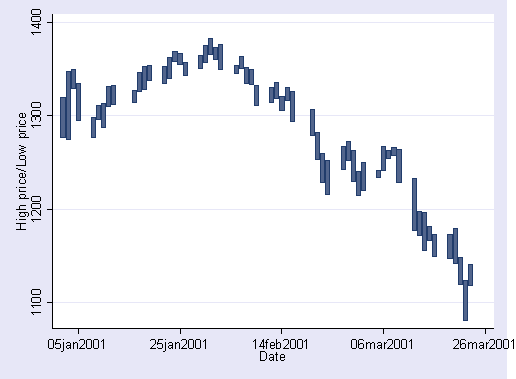
Range plot with barsgraph twoway rbar high low date
|
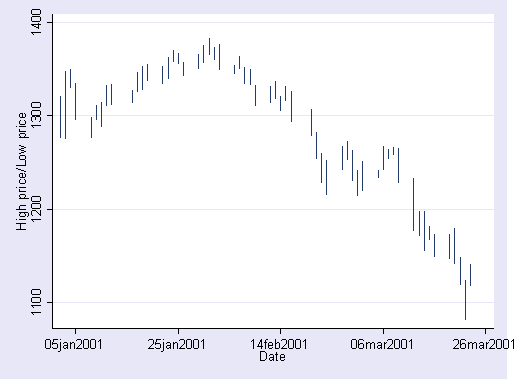
Range plot with spikesgraph twoway rspike high low date
|
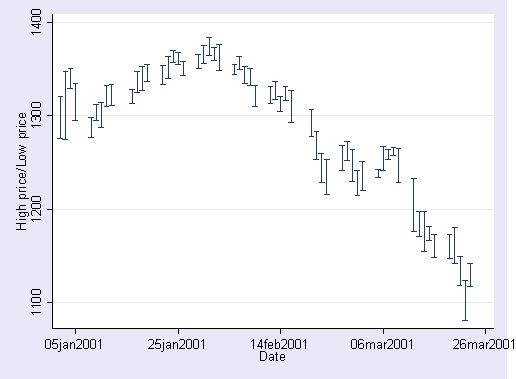
Range plot with capped spikesgraph twoway rcap high low date
|
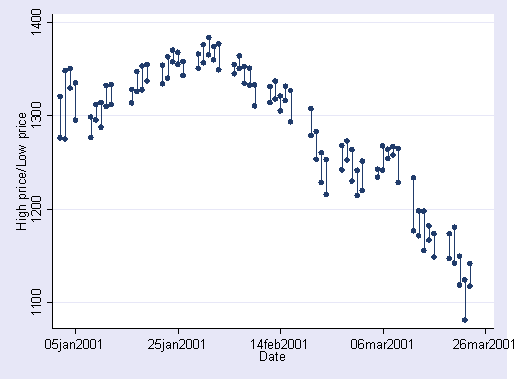
Range plot with spikes capped with symbolsgraph twoway rcapsym high low date
|
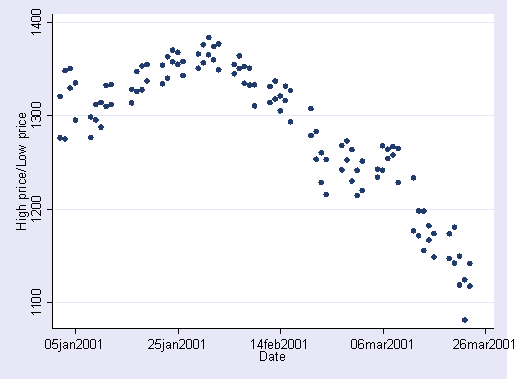
Range plot with markersgraph twoway rscatter high low date
|
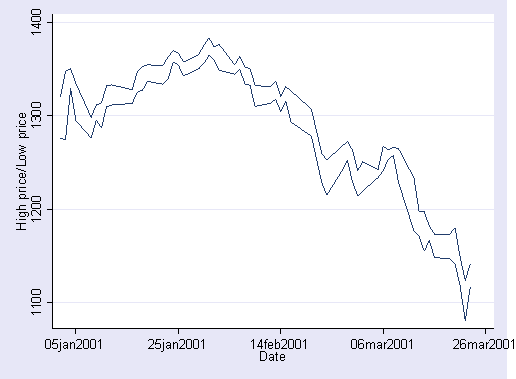
Range plot with linesgraph twoway rline high low date
|
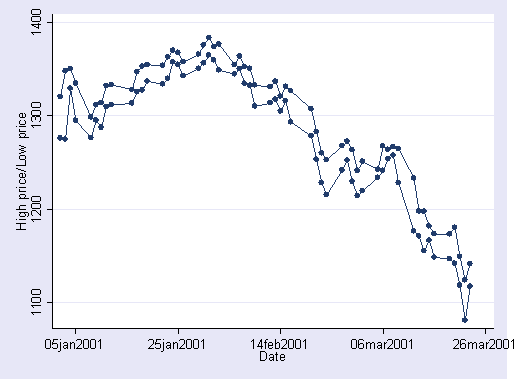
Range plot with lines and markersgraph twoway rconnected high low date
|
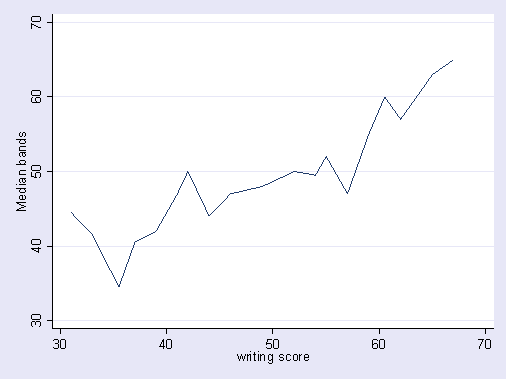
Median band line plotuse https://stats.idre.ucla.edu/stat/stata/notes/hsb2, clear graph twoway mband read write
|
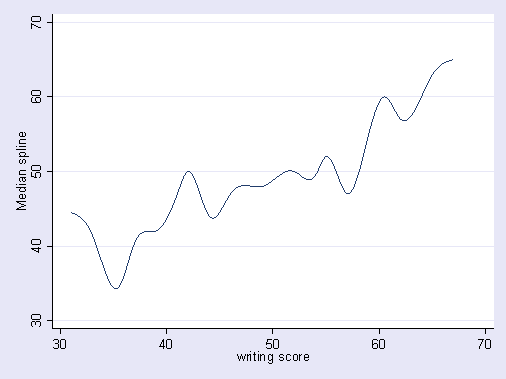
Spline line plotgraph twoway mspline read write
|
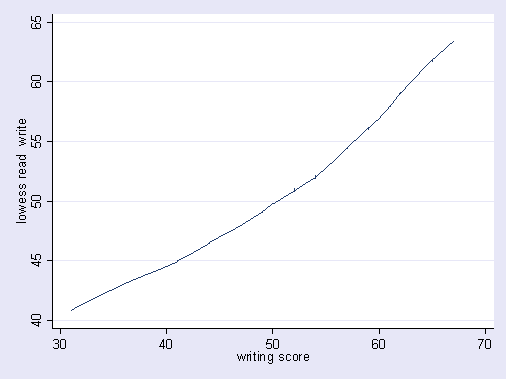
LOWESS line plotgraph twoway lowess read write
|
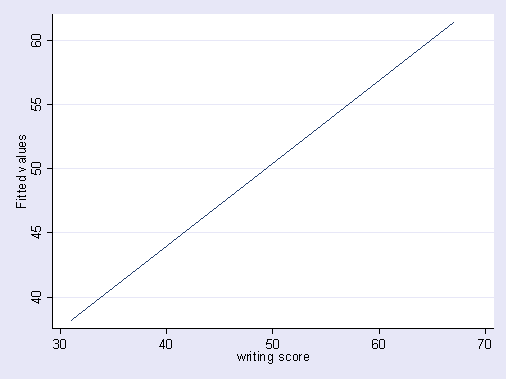
Linear prediction plotgraph twoway lfit read write
|
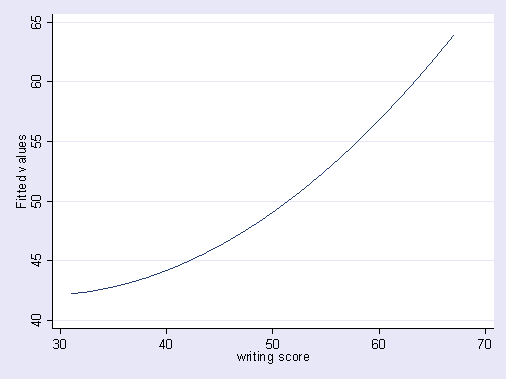
Quadratic prediction plotgraph twoway qfit read write
|
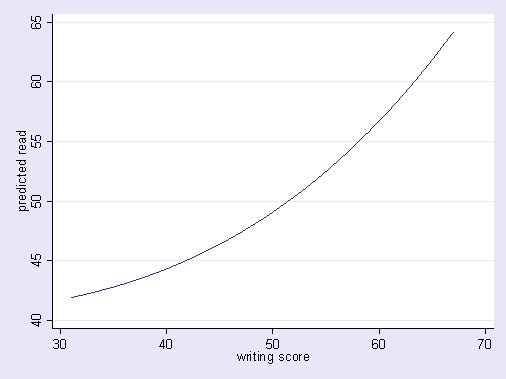
Fractional polynomial plotgraph twoway fpfit read write
|
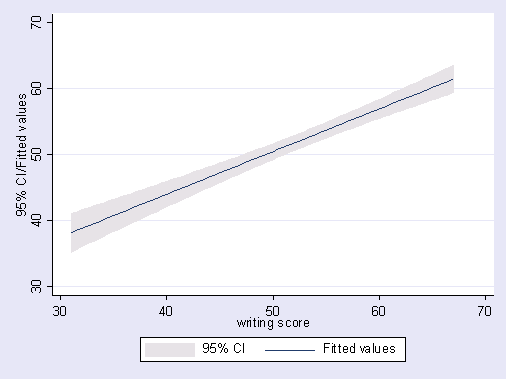
Linear prediction plot with confidence intervalsgraph twoway lfitci read write
|
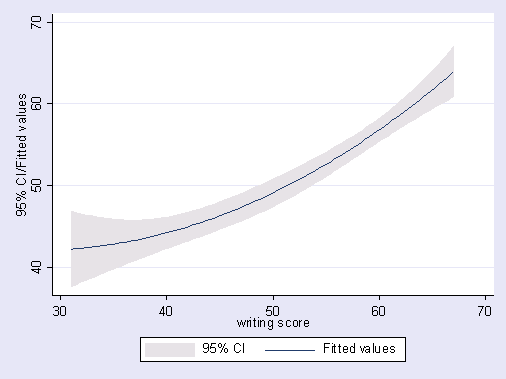
Quadratic plot with confidence intervalsgraph twoway qfitci read write
|
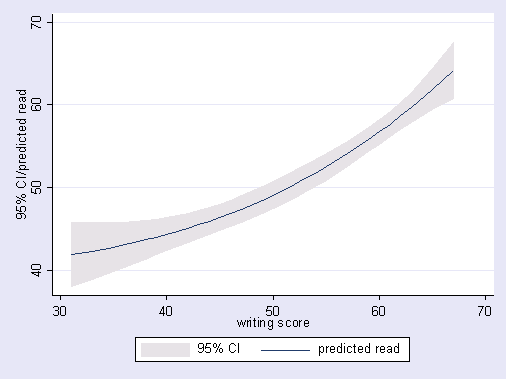
Fractional polynomial plot with CIsgraph twoway fpfitci read write
|
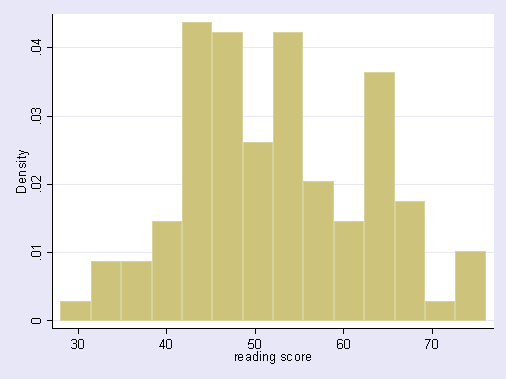
Histogramgraph twoway histogram read
|
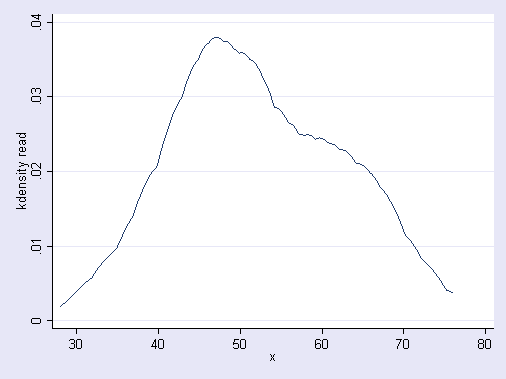
Kernel density plotgraph twoway kdensity read
|
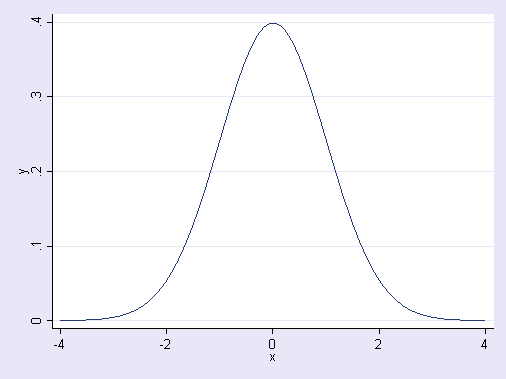
Function plotgraph twoway function y=normalden(x), range(-4 4)
|

