This module shows some of the options when using the twoway command to produce scatterplots. This is illustrated by showing the command and the resulting graph. This includes hotlinks to the Stata Graphics Manual available over the web and from within Stata by typing help graph.
Two Way Scatterplots |
||
|
|
||
| …. |
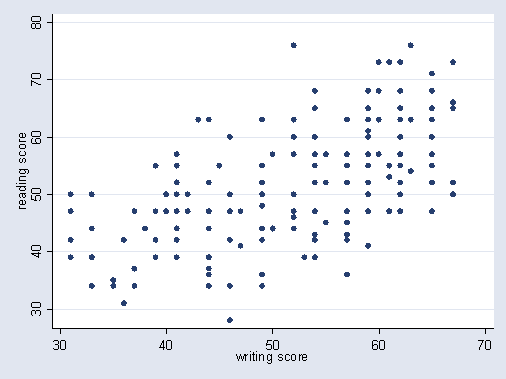
Basic twoway scatterplottwoway (scatter read write)
|
|
Schemes |
||
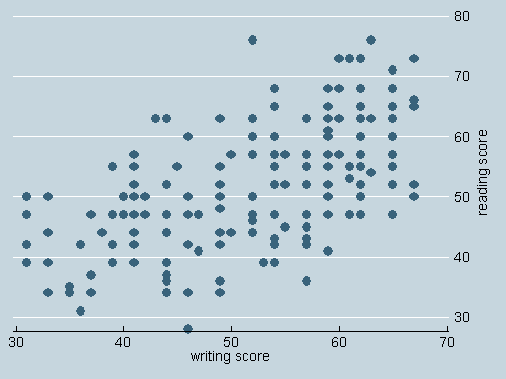
Using Economist Schemetwoway (scatter read write) , scheme(economist) |
||
|
|
||
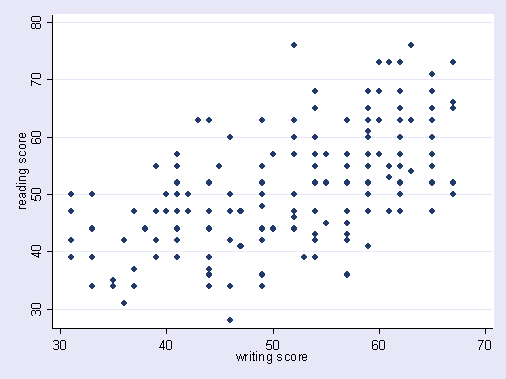
Using s1mono Schemetwoway (scatter read write) , scheme(s1mono)
|
||
Marker Placement Options (i.e. Jitter) |
||
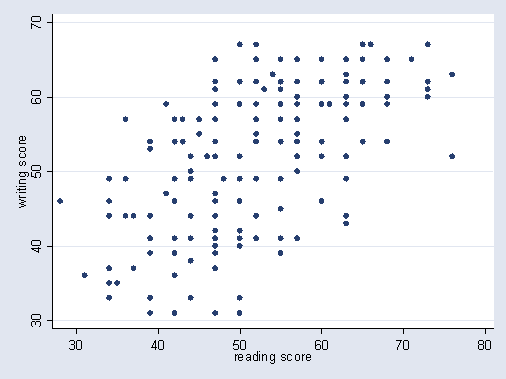
Scatterplot with jittertwoway (scatter write read, jitter(3))
|
Without jittertwoway (scatter write read)
|
|
Marker Label Options |
||
|
|
||
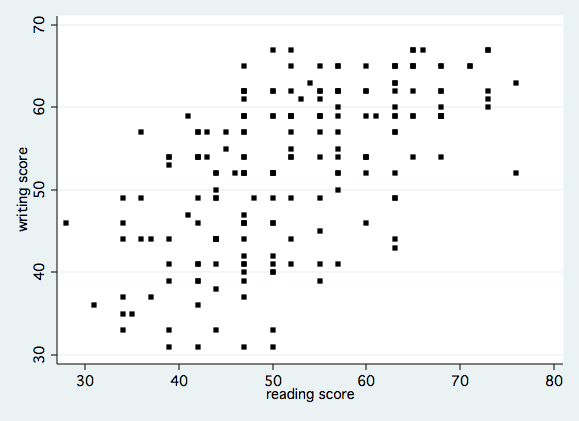
Using small black square symbols.twoway (scatter write read, msymbol(square) msize(small) mcolor(black))
|
||
|
|
||
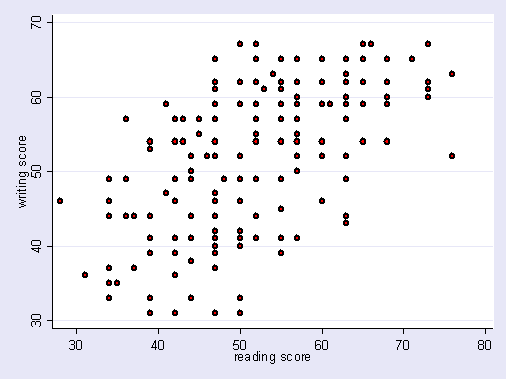
With markers red on the inside, black medium thick outlinetwoway (scatter write read, mfcolor(red) mlcolor(black) mlwidth(medthick) )
|
||
|
|
||
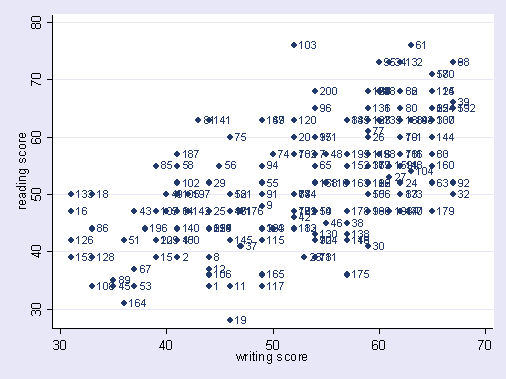
Identifying Observations with Marker Labelstwoway (scatter read write, mlabel(id))
|
||
|
|
||
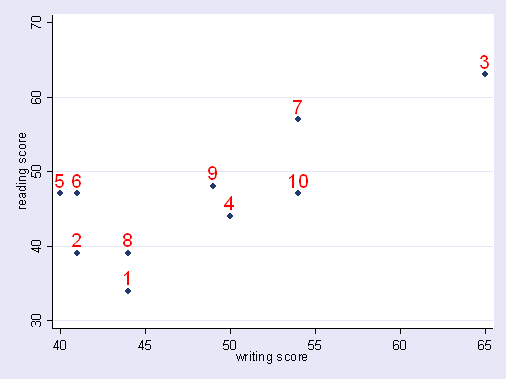
Using large red marker labels at 12 O’clocktwoway (scatter read write if id <=10, mlabel(id) mlabposition(12) mlabsize(large) mlabcolor(red))
|
||
|
|
||
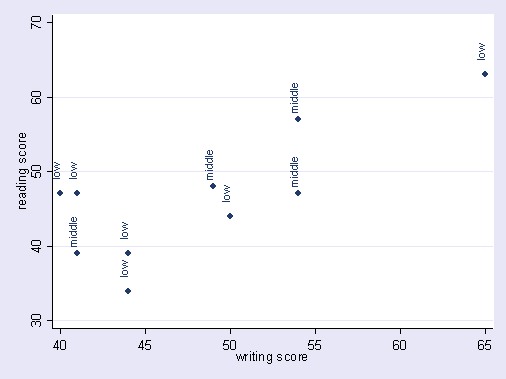
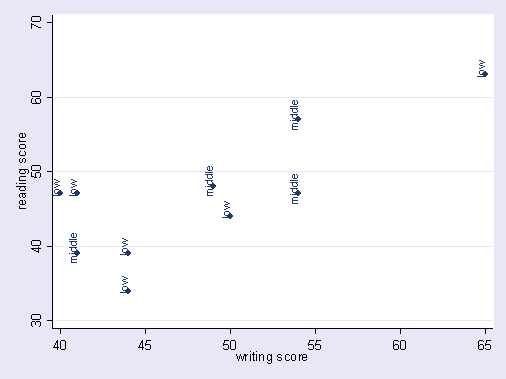
Markers at 90 degree angle at 12 O’clock with a gap of 5
|
If mlabgap option is omitted
|
|
|
|
||
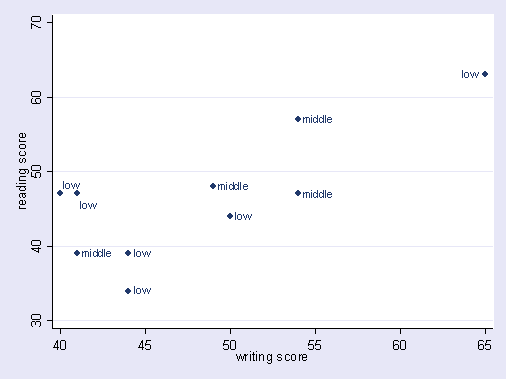
Modifying marker position separately for variables (1)generate pos = 3 replace pos = 1 if (id == 5) replace pos = 5 if (id == 6) replace pos = 9 if (id == 3) twoway (scatter read write if id <= 10,mlabel(ses) mlabv(pos)) |
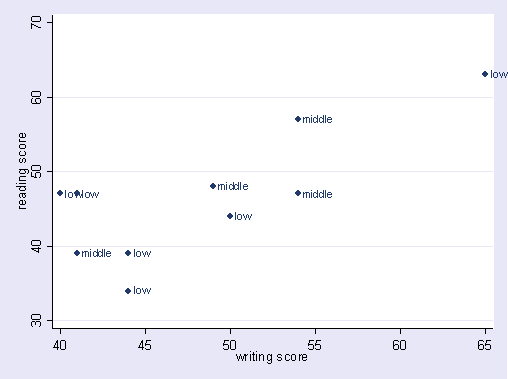
If option mlabv is not usedtwoway (scatter read write if id <= 10, mlabel(ses)) |
|
Connect Options |
||
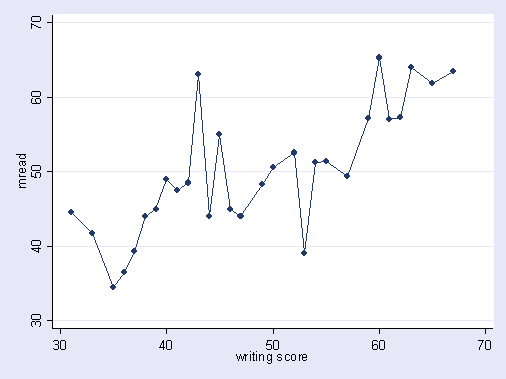
Connecting with straight lineegen mread = mean(read), by(write) twoway (scatter mread write, connect(l) sort)
|
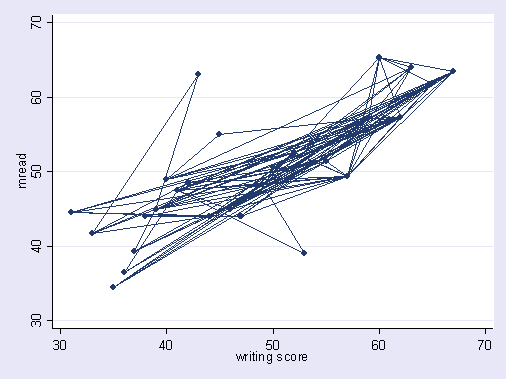
If the sort option is omittedtwoway (scatter mread write, connect(l))
|
|
|
|
||
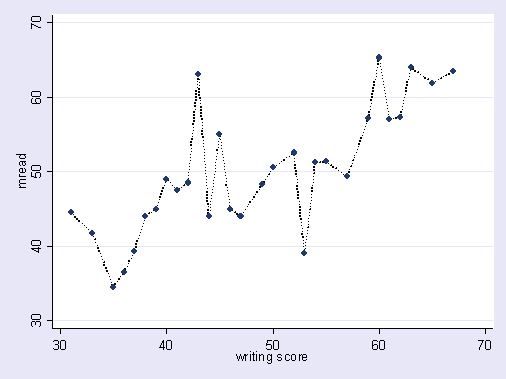
Medium thick black dotted connecting linetwoway (scatter mread write, connect(l) clwidth(medthick) clcolor(black) clpattern(dot) sort)
|
||
|
|
||
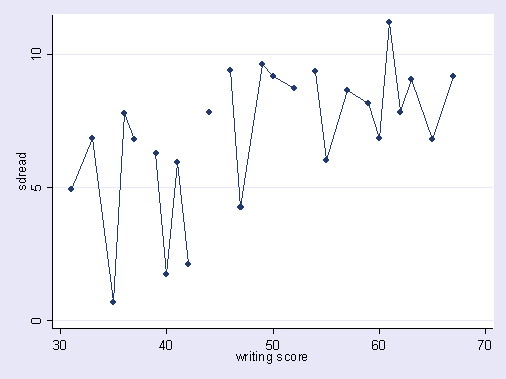
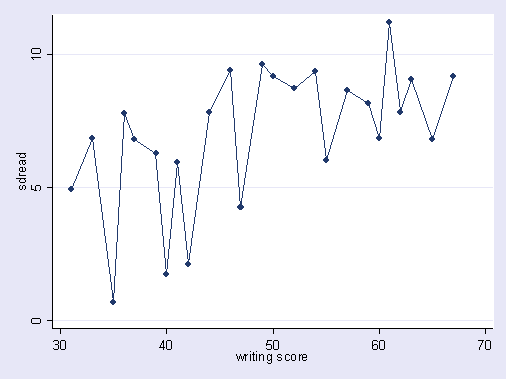
Show gaps in line when there are missing valuesegen sdread = sd(read), by(write) twoway (scatter sdread write, connect(l) sort cmissing(n))
|
Omitting cmissing optiontwoway (scatter sdread write, connect(l) sort)
|
|
Footnotes
#1. Notice that the variable pos is used to control the position of the marker label. As shown in the code (repeated below), pos is assigned a value of 3 representing 3 O’Clock, and then when id is 5 the position of the marker label is 1 O’Clock, and when id is 5 the position is 5 O’Clock, and then when id is 3 the position is 9 O’Clock, allowing us to avoid labels that run off the edge of the graph or overwrite each other.
generate pos = 3 replace pos = 1 if (id == 5) replace pos = 5 if (id == 6) replace pos = 9 if (id == 3)

