
The purpose of this workshop is to explore some issues in the analysis of
survey data using Stata 15. Before we begin, you will want to be sure that
your copy of Stata is up-to-date. To do this, please type
update all
in the Stata command window and follow any instructions given. These
updates include not only fixes to known bugs, but also add some new features
that may be useful. I am using Stata 15.1. All of the commands will work in Stata 16.
Before we begin looking at examples in Stata,
we will quickly review some basic issues and concepts in survey data analysis.
NOTE: Most of the commands in this seminar will work with Stata versions 12-14.
Why do we need survey data analysis software?
Regular procedures in statistical software (that is not designed for survey
data) analyzes data as if the data were collected using simple random sampling.
For experimental and quasi-experimental designs, this is exactly what we want.
However, very few surveys use a simple random sample to collect data.
Not only is it nearly impossible to do so, but it is not as efficient (either
financially and statistically) as other sampling methods. When any
sampling method other than simple random sampling is used, we usually need to use survey
data analysis software to take into account the differences between the design
that was used to collect the data and simple random sampling. This is because the sampling design affects
both the calculation of the
point estimates and the standard errors of those estimates. If you ignore the sampling design, e.g.,
if you assume simple random sampling when another type of sampling design was
used, both the point estimates and their standard errors will likely be
calculated incorrectly. The sampling weight will affect the calculation of
the point estimate, and the stratification and/or clustering will affect the
calculation of the standard errors. Ignoring the clustering will likely
lead to standard errors that are underestimated, possibly leading to
results that seem to be statistically significant, when in fact, they are not.
The difference in point estimates and standard errors obtained using non-survey
software and survey software with the design properly specified will vary from
data set to data set, and even between analyses using the same data set.
While it may be possible to get reasonably accurate results using non-survey
software, there is no practical way to know beforehand how far off the results
from non-survey software will be.
Sampling designs
Most people do not conduct their own surveys. Rather, they
use survey data that some agency or company collected and made available to the
public. The documentation must be read carefully to find out what kind of
sampling design was used to collect the data. This is very important
because many of the estimates and standard errors are calculated differently for
the different sampling designs. Hence, if you mis-specify the sampling
design, the point estimates and standard errors will likely be wrong.
Below are some common features of many sampling designs.
Sampling weights: There are several types of weights that
can be associated with a survey. Perhaps the most common is the sampling weight.
A sampling weight is a probability weight that has had one or more adjustments
made to it. Both a sampling weight and a probability weight are used to weight the sample back to the population from which the sample
was drawn. By definition, a probability weight is the inverse of the probability of being included in the
sample due to the sampling design (except for a certainty PSU, see below).
The probability weight, called a pweight in Stata, is calculated as N/n, where N = the number of elements in the
population and n = the number of elements in the sample. For example, if a population has 10
elements and 3 are sampled at random with replacement, then the probability weight would be
10/3 = 3.33. In a two-stage design, the probability weight is calculated as f1f2,
which means that the inverse of the sampling fraction for the first stage is
multiplied by the inverse of the sampling fraction for the second stage.
Under many sampling plans, the sum of the probability weights will equal the population total.
While many textbooks will end their discussion of probability weights here, this
definition does not fully describe the sampling weights that are included with actual
survey data sets. Rather, the sampling weight, which is sometimes called a “final weight,” starts with the
inverse of the sampling fraction, but then incorporates several other values,
such as corrections for unit non-response, errors in the sampling frame
(sometimes called non-coverage), calibration and trimming. Because these
other values are included in the probability weight that is included with the data
set, it is often inadvisable to modify the sampling weights, such as trying to
standardize them for a particular variable, e.g., age.
Strata: Stratification is a method of breaking up the
population into different groups, often by demographic variables such as gender,
race or SES. Each element in the population must belong to one, and only
one, strata. Once the strata have been defined, samples are taken from each
stratum as if it were independent of all of the other strata. For example,
if a sample is to be stratified on gender, men and women would be sampled
independently of one another. This means that the probability weights for men will
likely be different from the probability weights for the women. In most cases, you
need to have two or more PSUs in each stratum. The purpose of
stratification is to reduce the standard error of the estimates, and stratification works most
effectively when the variance of the dependent variable is smaller within the
strata than in the sample as a whole.
PSU: This is the primary sampling unit.
This is the first unit that is sampled in the design. For example, school
districts from California may be sampled and then schools within districts may
be sampled. The school district would be the PSU. If states from the US were sampled, and then school districts from within each
state, and then schools from within each district, then states would be the PSU.
One does not need to use the same sampling method at all levels of sampling.
For example, probability-proportional-to-size sampling may be used at
level 1 (to select states), while cluster sampling is used at level 2
(to select school districts). In the case of a simple random sample, the
PSUs and the elementary units are the same. In general, accounting for the
clustering in the data (i.e., using the PSUs), will increase the standard errors
of the point estimates. Conversely, ignoring the PSUs will tend to yield
standard errors that are too small, leading to false positives when doing
significance tests.
FPC: This is the finite population correction.
This is used when the sampling fraction (the number of elements or respondents
sampled relative to the population) becomes large. The FPC is used in the
calculation of the standard error of the estimate. If the value of the FPC
is close to 1, it will have little impact and can be safely ignored. In
some survey data analysis programs, such as SUDAAN, this information will be
needed if you specify that the data were collected without replacement
(see below for a definition of “without replacement”). The
formula for calculating the FPC is ((N-n)/(N-1))1/2, where N is the
number of elements in the population and n is the number of elements in the
sample. To see the impact of the FPC for
samples of various proportions, suppose that you had
a population of 10,000 elements.
Sample size (n)    FPC
1                1.0000
10                .9995
100               .9950
500               .9747
1000              .9487
5000              .7071
9000              .3162
Replicate weights: Replicate weights are a series of weight
variables that are used to correct the standard errors for the sampling plan.
They serve the same function as the PSU and strata variables (which are used a Taylor series
linearization) to correct the standard errors of the estimates for the sampling
design. Many public use data sets are now being released with
replicate weights instead of PSUs and strata in an effort to more securely
protect the identity of the respondents. In theory, the same standard
errors will be obtained using either the PSU and strata or the replicate
weights. There are different ways of creating replicate weights; the
method used is determined by the sampling plan. The most common are
balanced repeated and jackknife replicate weights. You will need to read
the documentation for the survey data set carefully to learn what type of
replicate weight is included in the data set; specifying the wrong type of
replicate weight will likely lead to incorrect standard errors. For more
information on replicate weights, please see
Stata
Library: Replicate Weights and Appendix D of the
WesVar Manual
by Westat, Inc. Several statistical packages, including Stata, SAS, R, Mplus, SUDAAN and WesVar, allow the use of replicate weights.
Consequences of not using the design elements
Sampling design elements include the sampling weights, post-stratification
weights (if provided), PSUs, strata, and replicate weights. Rarely are all
of these elements included in a single public-use data set. However,
ignoring the design elements that are included can often lead to inaccurate
point estimates and/or inaccurate standard errors.
Sampling with and without replacement
Most samples collected in the real world are collected “without
replacement”. This means that once a respondent has been selected to be in
the sample and has participated in the survey, that particular respondent cannot
be selected again to be in the sample. Many of the calculations change
depending on if
a sample is collected with or without replacement. Hence, programs like
SUDAAN request that you specify if a survey sampling design was implemented with
our without replacement, and an FPC is used if sampling without replacement is
used, even if the value of the FPC is very close to one.
Examples
For the examples in this workshop, we will use the data set from NHANES
2011-2012. The data set and documentation can be downloaded from
the NHANES
web site. The data files can be downloaded as SAS.xpt files. Files in this
format can be read directly into Stata using the fdause command.
Reading the documentation
The first step in analyzing any survey data set is to read the documentation.
With many of the public use data sets, the documentation can be quite extensive
and sometimes even intimidating. Instead of trying to read the
documentation “cover to cover”, there are some parts you will want to focus on.
First, read the Introduction. This is usually an “easy read” and will
orient you to the survey. There is usually a section or chapter called
something like
“Sample Design and Analysis Guidelines”, “Variance Estimation”, etc. This
is the part that tells you about the design elements included with the survey
and how to use them. Some even give example code. If multiple
sampling weights have been included in the data set, there will be some
instruction about when to use which one. If there is a section or chapter
on missing data or imputation, please read that. This will tell you how
missing data were handled. You should also read any documentation
regarding the specific variables that you intend to use. As we will see
little later on, we will need to look at the documentation to get the value
labels for the variables. This is especially important because some of the
values are actually missing data codes, and you need to do something so that
Stata doesn’t treat those as valid values (or you will get some very
“interesting” means, totals, etc.).
Getting the data into Stata
The following commands can be used to open the NHANES data in Stata and save
them in Stata format. I have also sorted the data before saving them
(because I will merge the files), but
this is not technically necessary.
* demographics
clear
fdause "D:\Data\Seminars\Applied Survey Stata 15\demo_g.xpt"
sort seqn
save "D:\Data\Seminars\Applied Survey Stata 15\demo_g", replace
The do-file that imports the data, merges the files and recodes the variables
can be found here. More variables are
recoded in the do-file than are used in this presentation.
The variables
We will use about a dozen different variables in the examples in this
workshop. Below is a brief summary of them. Some of the variables
have been recoded to be binary variables (values of 2 recoded to a value of 0).
The count of missing observations includes values truly missing as well as
refused and don’t know.
ridageyr – Age in years at exam – recoded; range of values: 0 –
79 are actual values, 80 = 80+ years of age
pad630 – How much time do you spend doing moderate-intensity
activities on a type work day?; range of values: 10-960, 7053 missing
observations
hsq496 – During the past 30 days, for about how many days have you
felt worried, tense or anxious?; range of values: 0-30; 3073 missing
observations
female – Recode of the variable riagendr; 0 = male, 1 = female; no
missing observations
dmdborn4 – Country of birth; 1 = born in the United States, 0 =
otherwise; 5 missing observations
dmdmartl – Marital status; 1 = married, 2 = widowed, 3 = divorced, 4 =
separated, 5 = never married, 6 = living with partner; 4203 missing observations
dmdeduc2 – Education level of adults aged 20+ years; 1 = less than 9th
grade, 2 = 9-11th grade, 3 = high school graduate, GED or equivalent, 4 = some
college or AA degree, 5 = college graduate or above; 4201 missing observations
pad675 – How much time do you spend doing moderate-intensity sports,
fitness, or recreation activities on a typical day?; range of values: 10-600;
6220 missing observations
hsq571 – During the past 12 months, have you donated blood?; 0 = no, 1
= yes; 3673 missing observations
pad680 – How much time do you usually spend sitting on a typical day?;
range of values: 0-1380; 2365 missing observations
paq665 – Do you do any moderate-intensity sports, fitness or
recreational activities that cause a small increase in breathing or heart rate
at least 10 minutes continually?; 0 = no, 1 = yes; 2329 missing observations
hsd010 – Would you say that your general health is…; 1 = excellent,
2 = very good, 3 = good, 4 = fair, 5 = poor; 3064 missing observations
The svyset command
Before we can start our analyses, we need to issue the
svyset command. The svyset command tells Stata about the design
elements in the survey. Once this command has been issued, all you need to
do for your analyses is use the svy: prefix before each command.
Because the 2011-2012 NHANES data were released with a sampling weight (wtint2yr), a PSU
variable (sdmvpsu) and a strata variable (sdmvstra), we will use these our svyset command. The svyset command looks like this:
use "D:\Data\Seminars\Applied Survey Stata 15\nhanes2012_merged", clear
svyset sdmvpsu [pw = wtint2yr], strata(sdmvstra) singleunit(centered)
pweight: wtint2yr VCE: linearized Single unit: centered Strata 1: sdmvstra SU 1: sdmvpsu FPC 1: <zero>
The singleunit option was added in Stata 10. This option allows for
different ways of handling a single PSU in a stratum. There are usually two or more PSUs in each stratum. If there is only one PSU in stratum, due to missing data or a subpopulation specification, for example, the variance cannot be estimated in that stratum. If you use the
default option, missing, then you will get no standard errors when Stata
encounters a single PSU in a stratum. There are three other options.
One is certainty, meaning that the singleton PSUs be treated as certainty
PSUs; certainty PSUs are PSUs that were selected into the sample with a
probability of 1 (in other words, these PSUs were certain to be in the sample)
and do not contribute to the standard error. The scaled option
gives a scaled version of the certainty option. The scaling factor comes
from using the average of the variances from the strata with multiple sampling
units for each stratum with one PSU. The centered option centers
strata with one sampling unit at the grand mean instead of the stratum mean.
Now that we have issued the svyset command, we can use the svydescribe
command to get information on the strata and PSUs. It is a good idea to use this command to learn about the strata and PSUs in the dataset.
svydescribeSurvey: Describing stage 1 sampling units pweight: wtint2yr VCE: linearized Single unit: centered Strata 1: sdmvstra SU 1: sdmvpsu FPC 1: <zero> #Obs per Unit ---------------------------- Stratum #Units #Obs min mean max -------- -------- -------- -------- -------- -------- 90 3 862 233 287.3 351 91 3 998 309 332.7 356 92 3 875 244 291.7 328 93 2 602 276 301.0 326 94 2 688 322 344.0 366 95 2 722 348 361.0 374 96 2 676 336 338.0 340 97 2 608 292 304.0 316 98 2 708 320 354.0 388 99 2 682 320 341.0 362 100 2 700 343 350.0 357 101 2 715 357 357.5 358 102 2 624 270 312.0 354 103 2 296 140 148.0 156 -------- -------- -------- -------- -------- -------- 14 31 9756 140 314.7 388
The output above tells us that there are 14 strata with two or three PSUs in
each. There are 31 PSUs. There are a different number of
observations in each PSU and in each strata. There are a minimum of 140
observations, a maximum of 388 observations and an average of 315 observations
in the PSUs. The design degrees of freedom is calculated as the number of strata minus the number of PSUs. For this data set, that is 31-14 = 17.
Descriptive statistics
We will start by calculating some descriptive statistics of some of the
continuous variables. We can use the svy: mean command to get the
mean of continuous variables, and we can follow that command with the estat
sd command to get the standard deviation or variance of the variable.
svy: mean ridageyr
(running mean on estimation sample)

Survey: Mean estimation

Number of strata =      14       Number of obs    =       9756
Number of PSUs   =      31       Population size  =  306590681
                                 Design df        =         17

--------------------------------------------------------------
             |             Linearized
             |       Mean   Std. Err.     [95% Conf. Interval]
-------------+------------------------------------------------
    ridageyr |   37.18519   .6964767      35.71576    38.65463
--------------------------------------------------------------

estat sd

-------------------------------------
             |       Mean   Std. Dev.
-------------+-----------------------
    ridageyr |   37.18519    22.36971
-------------------------------------

estat sd, var

-------------------------------------
             |       Mean    Variance
-------------+-----------------------
    ridageyr |   37.18519    500.4039
-------------------------------------

* pad630 = How much time do you spend doing moderate-intensity activities on a type work day?
svy: mean pad630
(running mean on estimation sample)

Survey: Mean estimation

Number of strata =      14        Number of obs    =      2054
Number of PSUs   =      31        Population size  =  88768571
                                  Design df        =        17

--------------------------------------------------------------
             |             Linearized
             |       Mean   Std. Err.     [95% Conf. Interval]
-------------+------------------------------------------------
      pad630 |   139.8874    5.57906      128.1166    151.6582
--------------------------------------------------------------

* hsq496 = During the past 30 days, for about how many days have you felt worried, tense or anxious?
svy: mean hsq496
(running mean on estimation sample)

Survey: Mean estimation

Number of strata =      14       Number of obs    =       5883
Number of PSUs   =      31       Population size  =  225667462
                                 Design df        =         17

--------------------------------------------------------------
             |             Linearized
             |       Mean   Std. Err.     [95% Conf. Interval]
-------------+------------------------------------------------
      hsq496 |   5.383908   .1899507      4.983147    5.784669
--------------------------------------------------------------
Notice that a different number of observations were used in each analysis.
This is important, because if you use these three variables in the same call to
svy: mean, you will get different estimates of the means for each of the
variables. This is because both pad630 and hsq496 have
missing values. However, these variables are not missing on the same
observations: Both pad630 and hsq496 are missing on the same 3666
observations, but pad630 has missing values on an additional 4036
observations, and hsq496 has missing values on 207 observations.
There are only 1847 observations that have valid (AKA non-missing) values for all three variables,
and those are used in the calculations of the means when all of the variables
are used in the same call to svy: mean.
svy: mean ridageyr pad630 hsq496
(running mean on estimation sample)

Survey: Mean estimation

Number of strata =      14        Number of obs    =      1847
Number of PSUs   =      31        Population size  =  81681482
                                  Design df        =        17

--------------------------------------------------------------
             |             Linearized
             |       Mean   Std. Err.     [95% Conf. Interval]
-------------+------------------------------------------------
    ridageyr |   41.97793   .8211706      40.24541    43.71045
      pad630 |   139.7228   5.713696       127.668    151.7777
      hsq496 |    5.37395   .2781225      4.787162    5.960737
--------------------------------------------------------------
Let’s get some descriptive statistics on some
of the binary variables, such as female
and dmdborn4.
svy: mean female
(running mean on estimation sample)

Survey: Mean estimation

Number of strata =      14       Number of obs    =       9756
Number of PSUs   =      31       Population size  =  306590681
                                 Design df        =         17

--------------------------------------------------------------
             |             Linearized
             |       Mean   Std. Err.     [95% Conf. Interval]
-------------+------------------------------------------------
      female |   .5119524   .0064398      .4983657    .5255392
--------------------------------------------------------------

estat sd

-------------------------------------
             |       Mean   Std. Dev.
-------------+-----------------------
      female |   .5119524    .4998827
-------------------------------------

svy: mean dmdborn4
(running mean on estimation sample)

Survey: Mean estimation

Number of strata =      14       Number of obs    =       9751
Number of PSUs   =      31       Population size  =  306485936
                                 Design df        =         17

--------------------------------------------------------------
             |             Linearized
             |       Mean   Std. Err.     [95% Conf. Interval]
-------------+------------------------------------------------
    dmdborn4 |   .8499362   .0157561      .8166938    .8831787
--------------------------------------------------------------

estat sd

-------------------------------------
             |       Mean   Std. Dev.
-------------+-----------------------
    dmdborn4 |   .8499362    .3571522
-------------------------------------
Taking the mean of a variable that is coded 0/1 gives the proportion of 1s.
The output above indicates that approximately 51.2% of the observations in our
data set are from females; 84.99% of respondents were born in the United States.
Of course, the svy: tab command can also be used with binary
variables. The proportion of .512 matches the .5119524 that we found with
the svy: mean command.
svy: tab female
(running tabulate on estimation sample)

Number of strata   =        14                 Number of obs      =       9756
Number of PSUs     =        31                 Population size    =  306590681
                                               Design df          =         17

-----------------------
RECODE of |
riagendr  |
(Gender)  | proportions
----------+------------
     male |        .488
   female |        .512
          |
    Total |           1
-----------------------
  Key:  proportions  =  cell proportions
By default, svy: tab gives proportions. If you would prefer to
see the actual counts, you will need to use the count option.
Oftentimes, the counts are too large for the display space in the table, so
other options, such cellwidth and format, need to be used to
display the counts. The missing option is often useful if the
variable has any missing values (the variable female does not).
svy: tab female, missing count cellwidth(15) format(%15.2g)
(running tabulate on estimation sample)

Number of strata   =        14                 Number of obs      =       9756
Number of PSUs     =        31                 Population size    =  306590681
                                               Design df          =         17

---------------------------
RECODE of |
riagendr  |
(Gender)  |           count
----------+----------------
     male |       149630839
   female |       156959842
          |
    Total |       306590681
---------------------------
  Key:  count            =  weighted counts

svy: tab female dmdborn4, missing count cellwidth(15) format(%15.2g)
(running tabulate on estimation sample)

Number of strata   =        14                 Number of obs      =       9756
Number of PSUs     =        31                 Population size    =  306590681
                                               Design df          =         17

------------------------------------------------------------------------------
RECODE of |
riagendr  |                     Country of birth - recode
(Gender)  |  born elsewhere       born in US                .            Total
----------+-------------------------------------------------------------------
     male |        22449131        127102676            79032        149630839
   female |        23543299        133390830            25713        156959842
          |
    Total |        45992430        260493506           104745        306590681
------------------------------------------------------------------------------
  Key:  weighted counts

  Pearson:
    Uncorrected   chi2(2)         =    0.9477
    Design-based  F(1.78, 30.34)  =    0.5244     P = 0.5769
Using the col option with svy: tab will give the column
proportions. As you can see, the values in the column “Total” are the same
as those from svy: tab female.
svy: tab female dmdborn4, col
(running tabulate on estimation sample)

Number of strata   =        14                 Number of obs      =       9751
Number of PSUs     =        31                 Population size    =  306485936
                                               Design df          =         17

----------------------------------------
RECODE of |
riagendr  |  Country of birth - recode
(Gender)  | born els   born in     Total
----------+-----------------------------
     male |    .4881     .4879      .488
   female |    .5119     .5121      .512
          |
    Total |        1         1         1
----------------------------------------
  Key:  column proportions

  Pearson:
    Uncorrected   chi2(1)         =    0.0002
    Design-based  F(1, 17)        =    0.0002     P = 0.9891
Of course, the svy: proportion command can also be used to get
proportions.
svy: proportion female
(running proportion on estimation sample)

Survey: Proportion estimation

Number of strata =      14       Number of obs    =       9756
Number of PSUs   =      31       Population size  =  306590681
                                 Design df        =         17

--------------------------------------------------------------
             |             Linearized
             | Proportion   Std. Err.     [95% Conf. Interval]
-------------+------------------------------------------------
female       |
        male |   .4880476   .0064398       .474473    .5016398
      female |   .5119524   .0064398      .4983602     .525527
--------------------------------------------------------------
Using the estat command after the svy: mean command also allows
you to get the design effects, misspecification effects, unweighted and weighted
sample sizes, or the coefficient of variation. The Deff and the Deft are types of design
effects, which tell you about the efficiency of your sample. The Deff is a
ratio of two variances. In the numerator we have the variance estimate
from the current sample (including all of its design elements), and in the
denominator we have the variance from a hypothetical sample of the same size
drawn as an SRS. In other words, the Deff tells you how efficient your
sample is compared to an SRS of equal size. If the Deff is less than 1,
your sample is more efficient than SRS; usually the Deff is greater than 1.
The Deft is the ratio of two standard error estimates. Again, the
numerator is the standard error estimate from the current sample. The
denominator is a hypothetical SRS (with replacement) standard error from a
sample of the same size as the current sample. You can also use the meff and the
meft option to get the misspecification effects.
Misspecification effects are a ratio of the variance estimate from the current
analysis to a hypothetical variance estimated from a misspecified model.
Please see the Stata documentation for more details on how these are calculated.
The coefficient of variation is the ratio of the standard error to the mean,
multiplied by 100% (see page 36 of the Stata 15 svy manual). It is an
indication of the variability relative to the mean in the population and is not
affected by the unit of measurement of the variable.
svy: mean ridageyr
(running mean on estimation sample)

Survey: Mean estimation

Number of strata =      14       Number of obs    =       9756
Number of PSUs   =      31       Population size  =  306590681
                                 Design df        =         17

--------------------------------------------------------------
             |             Linearized
             |       Mean   Std. Err.     [95% Conf. Interval]
-------------+------------------------------------------------
    ridageyr |   37.18519   .6964767      35.71576    38.65463
--------------------------------------------------------------

estat effects

----------------------------------------------------------
             |             Linearized
             |       Mean   Std. Err.       DEFF      DEFT
-------------+--------------------------------------------
    ridageyr |   37.18519   .6964767     9.45724   3.07526
----------------------------------------------------------

estat effects, deff deft meff meft

------------------------------------------------------------------------------
             |             Linearized
             |       Mean   Std. Err.       DEFF      DEFT      MEFF      MEFT
-------------+----------------------------------------------------------------
    ridageyr |   37.18519   .6964767     9.45724   3.07526   7.83352   2.79884
------------------------------------------------------------------------------

estat size

----------------------------------------------------------------------
             |             Linearized
             |       Mean   Std. Err.              Obs            Size
-------------+--------------------------------------------------------
    ridageyr |   37.18519   .6964767              9756   306590680.995
----------------------------------------------------------------------

estat cv

------------------------------------------------
             |             Linearized
             |       Mean   Std. Err.     CV (%)
-------------+----------------------------------
    ridageyr |   37.18519   .6964767     1.87299
------------------------------------------------
display (.6964767/37.18519)*100 1.8729949
Analysis of subpopulations
Before we continue with our descriptive statistics, we should pause to
discuss the analysis of subpopulations. The analysis of subpopulations is one place where survey data and
experimental data are quite different. If you have data from an experiment
(or quasi-experiment), and you want to analyze the responses from, say, just the
women, or just people over age 50, you can just delete the unwanted cases from
the data set or use the by: prefix. Complex survey data are different.
With survey data, you (almost) never get to delete any cases from the data set,
even if you will never use them in any of your analyses. Because of the
way the -by- prefix works, you usually don’t use it with survey data
either. Instead, Stata has provided two options that allow you to
correctly analyze subpopulations of your survey data. These options are
subpop and over. The subpop option is sort of like
deleting unwanted cases (without really deleting them, of course), and the
over option is very similar to -by- processing. We will start
with some examples of the subpop option.
First, however, let’s take a second to see why deleting cases from a survey data
set can be so problematic. If the data set is subset (meaning that
observations not to be included in the subpopulation are deleted from the data
set), the standard errors of the estimates cannot be calculated correctly. When
the subpopulation option is used, only the cases defined by the subpopulation
are used in the calculation of the estimate, but all cases are used in the
calculation of the standard errors. For more information on this issue, please
see
Sampling Techniques, Third Edition by William G. Cochran (1977) and
Small Area Estimation by J. N. K. Rao (2003). Also, if you look in the
Stata 15 svy manual, you will find an entire section (pages 67-72) dedicated
to the analysis of subpopulations. The formulas for using both if
and subpop are given, along with an explanation of how they are
different. If you look at the help for any svy: command, you will
see the same warning:
Warning:  Use of if or in restrictions will not produce correct variance
      estimates for subpopulations in many cases.  To compute estimates for
      subpopulations, use the subpop() option.  The full specification for subpop()
      is
            subpop([varname] [if])
The subpop option on the svy: prefix withiout the if is used with binary
variables. (Technically, all cases coded as not 0 and not missing are part
of the subpopulation; this means that if your subpopulation variable has values
of 1 and 2, all of the observations will be included in the subpopulation unless
you use a different syntax.) You may need to create a binary variable
(using the generate command) in which all of the observations be to
included in the subpopulation are coded as 1 and all other observations are
coded as 0. For our example, we will use the variable female for
our subpopulation variable, so that only females will be included in calculation
of the point estimate.
svy: mean ridageyr
(running mean on estimation sample)

Survey: Mean estimation

Number of strata =      14       Number of obs    =       9756
Number of PSUs   =      31       Population size  =  306590681
                                 Design df        =         17

--------------------------------------------------------------
             |             Linearized
             |       Mean   Std. Err.     [95% Conf. Interval]
-------------+------------------------------------------------
    ridageyr |   37.18519   .6964767      35.71576    38.65463
--------------------------------------------------------------

svy, subpop(female): mean ridageyr
(running mean on estimation sample)

Survey: Mean estimation

Number of strata =      14       Number of obs    =       9756
Number of PSUs   =      31       Population size  =  306590681
                                 Subpop. no. obs  =       4900
                                 Subpop. size     =  156959842
                                 Design df        =         17

--------------------------------------------------------------
             |             Linearized
             |       Mean   Std. Err.     [95% Conf. Interval]
-------------+------------------------------------------------
    ridageyr |   38.09657   .6713502      36.68014    39.51299
--------------------------------------------------------------
To get the mean for the males, we can specify the subpopulation as the
variable female not equal to 1 (meaning the observations that are coded
0).
svy, subpop(if female != 1): mean ridageyr
(running mean on estimation sample)

Survey: Mean estimation

Number of strata =      14       Number of obs    =       9756
Number of PSUs   =      31       Population size  =  306590681
                                 Subpop. no. obs  =       4856
                                 Subpop. size     =  149630839
                                 Design df        =         17

--------------------------------------------------------------
             |             Linearized
             |       Mean   Std. Err.     [95% Conf. Interval]
-------------+------------------------------------------------
    ridageyr |   36.22918   .8431945       34.4502    38.00817
--------------------------------------------------------------
We can also use the over option, which will give the results for each
level of the categorical variable listed. The over option is available only for svy: mean, svy: proportion,
svy: ratio and svy: total.
svy, over(female): mean ridageyr
(running mean on estimation sample)

Survey: Mean estimation

Number of strata =      14       Number of obs    =       9756
Number of PSUs   =      31       Population size  =  306590681
                                 Design df        =         17

         male: female = male
       female: female = female

--------------------------------------------------------------
             |             Linearized
        Over |       Mean   Std. Err.     [95% Conf. Interval]
-------------+------------------------------------------------
ridageyr     |
        male |   36.22918   .8431945       34.4502    38.00817
      female |   38.09657   .6713502      36.68014    39.51299
--------------------------------------------------------------
We can include more than one variable with the over option; this will
give us results for every combination of the variables listed.
* pad630 = How much time do you spend doing moderate-intensity activities on a type work day?
svy, over(dmdmartl female): mean pad630
(running mean on estimation sample)

Survey: Mean estimation

Number of strata =      14        Number of obs    =      1705
Number of PSUs   =      31        Population size  =  77846933
                                  Design df        =        17

         Over: dmdmartl female
    _subpop_1: married male
    _subpop_2: married female
    _subpop_3: widowed male
    _subpop_4: widowed female
    _subpop_5: divorced male
    _subpop_6: divorced female
    _subpop_7: separated male
    _subpop_8: separated female
    _subpop_9: never married male
   _subpop_10: never married female
   _subpop_11: living with partner male
   _subpop_12: living with partner female

--------------------------------------------------------------
             |             Linearized
        Over |       Mean   Std. Err.     [95% Conf. Interval]
-------------+------------------------------------------------
pad630       |
   _subpop_1 |   156.6941   8.765612      138.2002    175.1879
   _subpop_2 |   118.6255   9.590405      98.39152    138.8595
   _subpop_3 |   132.6111   20.77576      88.77813    176.4442
   _subpop_4 |   120.9569   11.10439      97.52869    144.3851
   _subpop_5 |    209.423   27.28619      151.8541    266.9918
   _subpop_6 |   124.6343   15.50591      91.91973    157.3489
   _subpop_7 |   187.9685   38.86106      105.9789    269.9582
   _subpop_8 |   200.9333   52.49986      90.16828    311.6983
   _subpop_9 |   146.4231   12.35329      120.3599    172.4862
  _subpop_10 |   131.7091   13.30558      103.6368    159.7814
  _subpop_11 |    201.422   13.41895      173.1105    229.7335
  _subpop_12 |   122.5736   14.88511      91.16879    153.9785
--------------------------------------------------------------
We can also use the subpop option and the over option together.
In the example below, we get the mean of pad630 for females in each
combination of dmdmart1 and dmdecuc2 (30 levels).
svy, subpop(female): mean pad630, over(dmdmartl dmdeduc2)
(running mean on estimation sample)

Survey: Mean estimation

Number of strata =      14       Number of obs    =       5619
Number of PSUs   =      31       Population size  =  185989071
                                 Subpop. no. obs  =        763
                                 Subpop. size     = 36358232.8
                                 Design df        =         17

         Over: dmdmartl dmdeduc2
    _subpop_1: married less than 9th grade
    _subpop_2: married no hs diploma
    _subpop_3: married hs grad or GED
    _subpop_4: married some college or AA degre
    _subpop_5: married college grad or above
    _subpop_6: widowed less than 9th grade
    _subpop_7: widowed no hs diploma
    _subpop_8: widowed hs grad or GED
    _subpop_9: widowed some college or AA degre
   _subpop_10: widowed college grad or above
   _subpop_11: divorced less than 9th grade
   _subpop_12: divorced no hs diploma
   _subpop_13: divorced hs grad or GED
   _subpop_14: divorced some college or AA degr
   _subpop_15: divorced college grad or above
   _subpop_16: separated less than 9th grade
   _subpop_17: separated no hs diploma
   _subpop_18: separated hs grad or GED
   _subpop_19: separated some college or AA deg
   _subpop_20: separated college grad or above
   _subpop_21: never married less than 9th grad
   _subpop_22: never married no hs diploma
   _subpop_23: never married hs grad or GED
   _subpop_24: never married some college or AA
   _subpop_25: never married college grad or ab
   _subpop_26: living with partner less than 9t
   _subpop_27: living with partner no hs diplom
   _subpop_28: living with partner hs grad or G
   _subpop_29: living with partner some college
   _subpop_30: living with partner college grad

--------------------------------------------------------------
             |             Linearized
        Over |       Mean   Std. Err.     [95% Conf. Interval]
-------------+------------------------------------------------
pad630       |
   _subpop_1 |   123.1873   33.99413      51.46593    194.9086
   _subpop_2 |   143.3616   14.00536      113.8129    172.9103
   _subpop_3 |    111.808   12.92772      84.53291    139.0831
   _subpop_4 |   146.2888   22.89246      97.98991    194.5877
   _subpop_5 |   88.91933    8.30694      71.39322    106.4454
   _subpop_6 |   176.0959   72.50964      23.11395    329.0779
   _subpop_7 |   90.60535   17.21293      54.28923    126.9215
   _subpop_8 |   110.4805   37.21189      31.97029    188.9907
   _subpop_9 |   101.8385   11.74256      77.06389    126.6132
  _subpop_10 |   260.9962   63.18704      127.6832    394.3092
  _subpop_11 |   54.28887   15.49709      21.59287    86.98487
  _subpop_12 |   163.2022   47.28731      63.43472    262.9697
  _subpop_13 |   145.5074   25.43471      91.84482    199.1699
  _subpop_14 |   129.5883   28.49053      69.47856    189.6981
  _subpop_15 |   76.00663   11.32266       52.1179    99.89535
  _subpop_16 |   169.3599   80.57609     -.6408196    339.3606
  _subpop_17 |   165.8482   46.57393      67.58582    264.1106
  _subpop_18 |   302.0225   117.2982      54.54487    549.5001
  _subpop_19 |   142.5322   26.01105      87.65368    197.4107
  _subpop_20 |   117.9216   34.79595      44.50859    191.3347
  _subpop_21 |   309.9912    93.1523      113.4571    506.5254
  _subpop_22 |   166.3335   46.45898      68.31357    264.3533
  _subpop_23 |   190.2853   55.64751      72.87928    307.6913
  _subpop_24 |   109.5492   15.62974      76.57336    142.5251
  _subpop_25 |   126.5192   19.29269      85.81517    167.2232
  _subpop_26 |        120          .             .           .
  _subpop_27 |    144.995   24.39718       93.5215    196.4686
  _subpop_28 |   98.81543   21.16077      54.17012    143.4607
  _subpop_29 |   152.5923    23.7468      102.4909    202.6936
  _subpop_30 |    89.0113   23.17592      40.11439    137.9082
--------------------------------------------------------------
For subpopulation 26, no standard error or confidence intervals are given.
This may be because there are very few observations at that level. To see if
this is indeed the cause, we can use the estat size command. The
unweighted number of cases is given in the column titled “Obs”, and the weighted
(or estimated subpopulation size) is given in the column titled “Size”.
estat size

         Over: dmdmartl dmdeduc2
    _subpop_1: married less than 9th grade
    _subpop_2: married no hs diploma
    _subpop_3: married hs grad or ged
    _subpop_4: married some college or AA degre
    _subpop_5: married college grad or above
    _subpop_6: widowed less than 9th grade
    _subpop_7: widowed no hs diploma
    _subpop_8: widowed hs grad or ged
    _subpop_9: widowed some college or AA degre
   _subpop_10: widowed college grad or above
   _subpop_11: divorced less than 9th grade
   _subpop_12: divorced no hs diplom
   _subpop_13: divorced hs grad or ged
   _subpop_14: divorced some college or AA degr
   _subpop_15: divorced college grad or above
   _subpop_16: separated less than 9th grade
   _subpop_17: separated no hs diploma
   _subpop_18: separated hs grad or ged
   _subpop_19: separated some college or AA deg
   _subpop_20: separated college grad or above
   _subpop_21: never married less than 9th grad
   _subpop_22: never married no hs diplom
   _subpop_23: never married hs grad or ged
   _subpop_24: never married some college or AA
   _subpop_25: never married college grad or ab
   _subpop_26: living with partner less than 9t
   _subpop_27: living with partner no hs diplom
   _subpop_28: living with partner hs grad or g
   _subpop_29: living with partner some college
   _subpop_30: living with partner college grad

----------------------------------------------------------------------
             |             Linearized
        Over |       Mean   Std. Err.              Obs            Size
-------------+--------------------------------------------------------
pad630       |
   _subpop_1 |   123.1873   33.99413                14   282303.798783
   _subpop_2 |   143.3616   14.00536                36    1493852.2679
   _subpop_3 |    111.808   12.92772                60   2807704.21163
   _subpop_4 |   146.2888   22.89246               121   7032757.93552
   _subpop_5 |   88.91933    8.30694               116   7192028.73485
   _subpop_6 |   176.0959   72.50964                 5   111127.083356
   _subpop_7 |   90.60535   17.21293                17   562709.323876
   _subpop_8 |   110.4805   37.21189                15    596030.21488
   _subpop_9 |   101.8385   11.74256                27    1272472.7973
  _subpop_10 |   260.9962   63.18704                 9   296513.579822
  _subpop_11 |   54.28887   15.49709                 3    78128.930803
  _subpop_12 |   163.2022   47.28731                10   414794.852531
  _subpop_13 |   145.5074   25.43471                23   1215808.11627
  _subpop_14 |   129.5883   28.49053                39   1738510.76294
  _subpop_15 |   76.00663   11.32266                14   914950.601057
  _subpop_16 |   169.3599   80.57609                 4    88739.706649
  _subpop_17 |   165.8482   46.57393                10   262282.787221
  _subpop_18 |   302.0225   117.2982                10   327045.836107
  _subpop_19 |   142.5322   26.01105                10   247858.703249
  _subpop_20 |   117.9216   34.79595                 4    79284.608695
  _subpop_21 |   309.9912    93.1523                 4   104748.202272
  _subpop_22 |   166.3335   46.45898                10   343955.585817
  _subpop_23 |   190.2853   55.64751                19    748235.70547
  _subpop_24 |   109.5492   15.62974                79   2939581.96271
  _subpop_25 |   126.5192   19.29269                37   1786563.47803
  _subpop_26 |        120          0                 2    83816.117097
  _subpop_27 |    144.995   24.39718                 9    312110.74153
  _subpop_28 |   98.81543   21.16077                17   872758.146424
  _subpop_29 |   152.5923    23.7468                26   1355189.31349
  _subpop_30 |    89.0113   23.17592                13   796368.717456
----------------------------------------------------------------------
list pad630 if female == 1 & dmdmartl == 6 & dmdeduc2 == 1 +--------+ | pad630 | |--------| 344. | 120 | 479. | . | 1339. | . | 1962. | . | 1987. | 120 | |--------| 2075. | . | 2148. | . | 2178. | . | 2631. | . | 2972. | . | |--------| 3148. | . | 4118. | . | 4595. | . | 6610. | . | 7064. | . | |--------| 7112. | . | 7214. | . | 7709. | . | 7829. | . | 8095. | . | |--------| 8479. | . | +--------+
By using the list command, we can see that there are only two cases
that have a valid value for pad630 in subpopulation 26, and both of those
values are 120. This is why no standard error can be estimated.
The lincom command can be used to make comparisons between
subpopulations. In the first example below, we will compare the means for
males and females for hsq496 (number of days feeling worried, tense or anxious). We
can use the display command to see how the point estimate in the output
of the lincom command is calculated. The value of using the
lincom command is that the standard error of point estimate is also
calculated, as well as the test statistic, p-value and 95% confidence interval. In
the following examples, we will compare the mean number of days feeling anxious
between those who are married to those who are living with a partner, and those
who are married to those who are widowed. Please see page 120 of the Stata
15 svy manual (first example in the section on survey postestimation) for more
information on using lincom after the svy, subpop(): mean command.
* hsq496 = During the past 30 days, for about how many days have you felt worried, tense or anxious?svy, over(female): mean hsq496 (running mean on estimation sample) Survey: Mean estimation Number of strata = 14 Number of obs = 5883 Number of PSUs = 31 Population size = 225667462 Design df = 17 male: female = male female: female = female -------------------------------------------------------------- | Linearized Over | Mean Std. Err. [95% Conf. Interval] -------------+------------------------------------------------ hsq496 | male | 4.589723 .1956524 4.176933 5.002514 female | 6.153479 .2675166 5.589069 6.71789 -------------------------------------------------------------- lincom [hsq496]male - [hsq496]female ( 1) [hsq496]male - [hsq496]female = 0 ------------------------------------------------------------------------------ Mean | Coef. Std. Err. t P>|t| [95% Conf. Interval] -------------+---------------------------------------------------------------- (1) | -1.563756 .2702582 -5.79 0.000 -2.133951 -.9935614 ------------------------------------------------------------------------------display 4.589723 - 6.153479 -1.563756 svy, over(dmdmartl): mean hsq496 (running mean on estimation sample) Survey: Mean estimation Number of strata = 14 Number of obs = 4692 Number of PSUs = 31 Population size = 193938169 Design df = 17 married: dmdmartl = married widowed: dmdmartl = widowed divorced: dmdmartl = divorced separated: dmdmartl = separated _subpop_5: dmdmartl = never married _subpop_6: dmdmartl = living with partner -------------------------------------------------------------- | Linearized Over | Mean Std. Err. [95% Conf. Interval] -------------+------------------------------------------------ hsq496 | married | 4.915051 .2864456 4.310704 5.519399 widowed | 5.450213 .3868792 4.633969 6.266457 divorced | 7.514127 .473958 6.514163 8.514091 separated | 7.231938 1.136924 4.833238 9.630637 _subpop_5 | 6.223865 .408766 5.361444 7.086286 _subpop_6 | 7.266146 .6322425 5.93223 8.600061 -------------------------------------------------------------- lincom [hsq496]married - [hsq496]_subpop_6 ( 1) [hsq496]married - [hsq496]_subpop_6 = 0 ------------------------------------------------------------------------------ Mean | Coef. Std. Err. t P>|t| [95% Conf. Interval] -------------+---------------------------------------------------------------- (1) | -2.351094 .6468052 -3.63 0.002 -3.715734 -.9864544 ------------------------------------------------------------------------------ lincom [hsq496]married - [hsq496]widowed ( 1) [hsq496]married - [hsq496]widowed = 0 ------------------------------------------------------------------------------ Mean | Coef. Std. Err. t P>|t| [95% Conf. Interval] -------------+---------------------------------------------------------------- (1) | -.5351614 .5175658 -1.03 0.316 -1.62713 .5568069 ------------------------------------------------------------------------------
Graphing with continuous variables
We can also get some descriptive graphs of our variables. For a
continuous variable, you may want a histogram. However, the histogram
command will only accept a frequency weight, which, by definition, can have only
integer values. A suggestion by Heeringa, West and Berglund (2010, pages
121-122) is to simply use the integer part of the sampling weight. We can
create a frequency weight from our sampling weight using the generate
command with the int function.
gen int_wtint2yr = int(wtint2yr)
histogram pad630 [fw = int_wtint2yr], bin(20)
histogram ridageyr [fw = int_wtint2yr], bin(20) normal
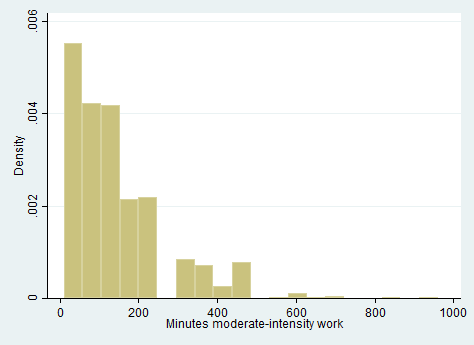
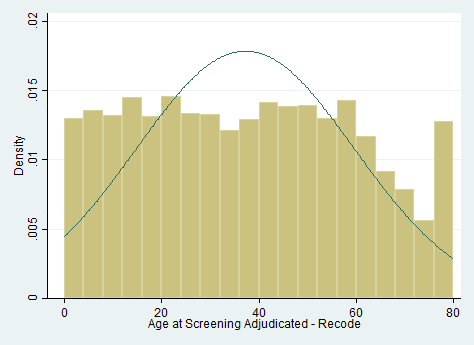
We can make box plots and use the sampling weight that is provided in the
data set.
* hsq496 = During the past 30 days, for about how many days have you felt worried, tense or anxious?
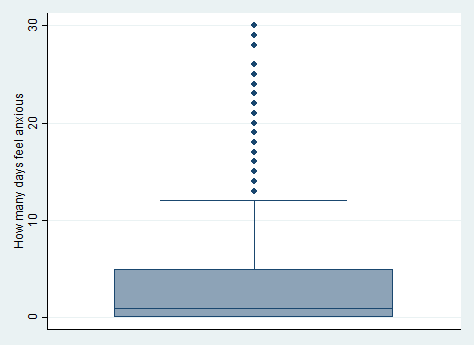
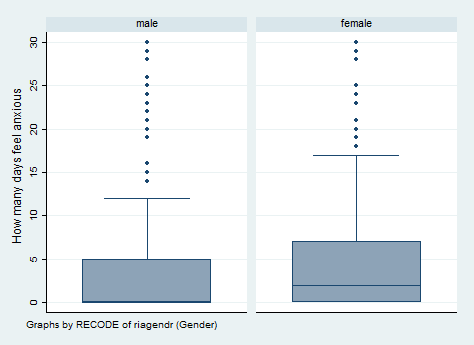
graph box hsq496 [pw = wtint2yr]
graph box hsq496 [pw = wtint2yr], by(female) ylabel(0(5)30)The line in the box plot represents the median, not the mean.
svy, over(female): mean hsq496
(running mean on estimation sample)

Survey: Mean estimation

Number of strata =      14       Number of obs    =       5883
Number of PSUs   =      31       Population size  =  225667462
                                 Design df        =         17

         male: female = male
       female: female = female

--------------------------------------------------------------
             |             Linearized
        Over |       Mean   Std. Err.     [95% Conf. Interval]
-------------+------------------------------------------------
hsq496       |
        male |   4.589723   .1956524      4.176933    5.002514
      female |   6.153479   .2675166      5.589069     6.71789
--------------------------------------------------------------

estat sd

         male: female = male
       female: female = female

-------------------------------------
        Over |       Mean   Std. Dev.
-------------+-----------------------
hsq496       |
        male |   4.589723    8.408553
      female |   6.153479    9.096215
-------------------------------------
There is no survey command in Stata that will give us the median, but we can use a “hack” and specify the sampling weight as an analytic weight. (Please see https://www.stata.com/support/faqs/statistics/percentiles-for-survey-data/ for more information.)
bysort female: summarize hsq496 [aw = wtint2yr], detail

---------------------------------------------------------------------------------------------------------------------------------------------------------------
-> female = male

                 How many days feel anxious
-------------------------------------------------------------
      Percentiles      Smallest
 1%            0              0
 5%            0              0
10%            0              0       Obs               2,969
25%            0              0       Sum of Wgt.   111057733

50%            0                      Mean           4.589723
                        Largest       Std. Dev.      8.304084
75%            5             30
90%           15             30       Variance       68.95782
95%           30             30       Skewness       2.144247
99%           30             30       Kurtosis       6.484301

---------------------------------------------------------------------------------------------------------------------------------------------------------------
-> female = female

                 How many days feel anxious
-------------------------------------------------------------
      Percentiles      Smallest
 1%            0              0
 5%            0              0
10%            0              0       Obs               2,914
25%            0              0       Sum of Wgt.   114609729

50%            2                      Mean           6.153479
                        Largest       Std. Dev.      9.211476
75%            7             30
90%           25             30       Variance       84.85129
95%           30             30       Skewness       1.686694
99%           30             30       Kurtosis        4.59545
We can use the svy: total command to get totals. The values in
the output can get to be very large, so we can use the estimates table
command to see them. We can also use the matrix list command.
svy: total pad630
(running total on estimation sample)

Survey: Total estimation

Number of strata =      14        Number of obs    =      2054
Number of PSUs   =      31        Population size  =  88768571
                                  Design df        =        17

--------------------------------------------------------------
             |             Linearized
             |      Total   Std. Err.     [95% Conf. Interval]
-------------+------------------------------------------------
      pad630 |   1.24e+10   1.07e+09      1.02e+10    1.47e+10
--------------------------------------------------------------

estimates table, b(%15.2f) se(%13.2f)

--------------------------------
    Variable |     active
-------------+------------------
      pad630 |  12417602483.56
             |   1065724292.32
--------------------------------
                    legend: b/se

svy: total pad630
(running total on estimation sample)

Survey: Total estimation

Number of strata =      14        Number of obs    =      2054
Number of PSUs   =      31        Population size  =  88768571
                                  Design df        =        17

--------------------------------------------------------------
             |             Linearized
             |      Total   Std. Err.     [95% Conf. Interval]
-------------+------------------------------------------------
      pad630 |   1.24e+10   1.07e+09      1.02e+10    1.47e+10
--------------------------------------------------------------

matlist e(b), format(%15.2f)

             |          pad630
-------------+-----------------
          y1 |  12417602483.56

svy, over(female): total pad630
(running total on estimation sample)

Survey: Total estimation

Number of strata =      14        Number of obs    =      2054
Number of PSUs   =      31        Population size  =  88768571
                                  Design df        =        17

         male: female = male
       female: female = female

--------------------------------------------------------------
             |             Linearized
        Over |      Total   Std. Err.     [95% Conf. Interval]
-------------+------------------------------------------------
pad630       |
        male |   7.41e+09   6.37e+08      6.06e+09    8.75e+09
      female |   5.01e+09   4.72e+08      4.01e+09    6.00e+09
--------------------------------------------------------------

estimates table, b(%15.2f) se(%13.2f)

--------------------------------
    Variable |     active
-------------+------------------
        male |   7408679626.25
             |    637463721.35
      female |   5008922857.30
             |    472105366.03
--------------------------------
                    legend: b/se
Relationships between two continuous variables
Let’s look at some bivariate relationships. As of Stata 16, we cannot
get correlations with survey data (but you can with SUDAAN 11). The
graphical version of a correlation is a scatterplot, which we show below.
We will include the fit line.
svy: mean pad630 pad675
(running mean on estimation sample)

Survey: Mean estimation

Number of strata =      14        Number of obs    =      1030
Number of PSUs   =      31        Population size  =  48053490
                                  Design df        =        17

--------------------------------------------------------------
             |             Linearized
             |       Mean   Std. Err.     [95% Conf. Interval]
-------------+------------------------------------------------
      pad630 |   129.7198   5.723011      117.6453    141.7943
      pad675 |   72.48499   2.365431      67.49436    77.47561
--------------------------------------------------------------

* pad630 - How much time do you spend doing moderate-intensity
activities on a type work day?
* pad675 - How much time do you spend doing moderate-intensity sports, fitness, or recreation activities on a typical day?twoway (scatter pad630 pad675) (lfit pad630 pad675 [pw = wtint2yr]), /// title("minutes of moderate intensity work" /// "v. minutes of moderate recreational activities")

Descriptive statistics with categorical variables
Let’s get some descriptive statistics with categorical variables. We
can use the svy: tab and svy: proportion commands. We will
use the marital status variable, dmdmart1, which has six levels.
When used with no options, the output from the svy: tab command will give
us the same information as the svy: proportion command.
svy: tab dmdmartl
(running tabulate on estimation sample)
Number of strata = 14 Number of obs = 5553
Number of PSUs = 31 Population size = 223858353
Design df = 17
-----------------------
Marital |
Status | proportions
----------+------------
married | .5308
widowed | .0562
divorced | .1069
separate | .024
never ma | .1987
living w | .0834
|
Total | 1
-----------------------
Key: proportions = cell proportions
svy: proportion dmdmartl
(running proportion on estimation sample)
Survey: Proportion estimation
Number of strata = 14 Number of obs = 5553
Number of PSUs = 31 Population size = 223858353
Design df = 17
_prop_5: dmdmartl = never married
_prop_6: dmdmartl = living with partner
--------------------------------------------------------------
| Linearized
| Proportion Std. Err. [95% Conf. Interval]
-------------+------------------------------------------------
dmdmartl |
married | .5307919 .0204953 .4874276 .5736962
widowed | .0562251 .0031996 .0498433 .0633695
divorced | .1068817 .007248 .0925245 .1231643
separated | .0239747 .0031613 .0181365 .0316316
_prop_5 | .1986955 .0236294 .1534768 .2532512
_prop_6 | .0834312 .0064732 .070751 .0981439
--------------------------------------------------------------
Let’s use some options with the svy: tab command so that we can see
the estimated number of people in each category.
svy: tab dmdmartl, count cellwidth(12) format(%12.2g)
(running tabulate on estimation sample)
Number of strata = 14 Number of obs = 5553
Number of PSUs = 31 Population size = 223858353
Design df = 17
------------------------
Marital |
Status | count
----------+-------------
married | 118822198
widowed | 12586462
divorced | 23926362
separate | 5366932
never ma | 44479637
living w | 18676762
|
Total | 223858353
------------------------
Key: count = weighted counts
There are many options that can by used with svy: tab. Please
see the Stata help file for the svy: tabulate command for a complete
listing and description of each option. Only five items can be displayed
at once, and the ci option counts as two items.
svy: tab dmdmartl, cell count obs cellwidth(12) format(%12.2g)
(running tabulate on estimation sample)
Number of strata = 14 Number of obs = 5553
Number of PSUs = 31 Population size = 223858353
Design df = 17
----------------------------------------------------
Marital |
Status | count proportions obs
----------+-----------------------------------------
married | 118822198 .53 2683
widowed | 12586462 .056 467
divorced | 23926362 .11 571
separate | 5366932 .024 204
never ma | 44479637 .2 1188
living w | 18676762 .083 440
|
Total | 223858353 1 5553
----------------------------------------------------
Key: count = weighted counts
proportions = cell proportions
obs = number of observations
svy: tab dmdmartl, count se cellwidth(15) format(%15.2g)
(running tabulate on estimation sample)
Number of strata = 14 Number of obs = 5553
Number of PSUs = 31 Population size = 223858353
Design df = 17
--------------------------------------------
Marital |
Status | count se
----------+---------------------------------
married | 118822198 10556102
widowed | 12586462 1087437
divorced | 23926362 2606988
separate | 5366932 614868
never ma | 44479637 4687152
living w | 18676762 1874572
|
Total | 223858353
--------------------------------------------
Key: count = weighted counts
se = linearized standard errors of weighted counts
svy: tab dmdmartl, count deff deft cv cellwidth(12) format(%12.2g)
(running tabulate on estimation sample)
Number of strata = 14 Number of obs = 5553
Number of PSUs = 31 Population size = 223858353
Design df = 17
------------------------------------------------------------------
Marital |
Status | count cv deff deft
----------+-------------------------------------------------------
married | 118822198 8.9 50 7
widowed | 12586462 8.6 2.5 1.6
divorced | 23926362 11 7.9 2.8
separate | 5366932 11 1.8 1.3
never ma | 44479637 11 15 3.9
living w | 18676762 10 5.1 2.3
|
Total | 223858353
------------------------------------------------------------------
Key: count = weighted counts
cv = coefficients of variation of weighted counts
deff = deff for variances of weighted counts
deft = deft for variances of weighted counts
Chi-square tests are provided by default when svy: tab is issued with
two variables. You will usually want to use the design-based test.
The proportion of observations in each cell can be obtained using either the
svy: tab or the svy: proportion command. If you want to compare
the proportions within two cells, you can use the lincom command.
svy: tab dmdmartl female, cell obs count cellwidth(12) format(%12.2g)
(running tabulate on estimation sample)
Number of strata = 14 Number of obs = 5553
Number of PSUs = 31 Population size = 223858353
Design df = 17
----------------------------------------------------
Marital | RECODE of riagendr (Gender)
Status | male female Total
----------+-----------------------------------------
married | 58666065 60156133 118822198
| .26 .27 .53
| 1429 1254 2683
|
widowed | 2732447 9854015 12586462
| .012 .044 .056
| 122 345 467
|
divorced | 9287612 14638749 23926362
| .041 .065 .11
| 237 334 571
|
separate | 2019361 3347571 5366932
| .009 .015 .024
| 79 125 204
|
never ma | 25152255 19327382 44479637
| .11 .086 .2
| 634 554 1188
|
living w | 9529522 9147240 18676762
| .043 .041 .083
| 237 203 440
|
Total | 107387263 116471090 223858353
| .48 .52 1
| 2738 2815 5553
----------------------------------------------------
Key: weighted counts
cell proportions
number of observations
Pearson:
Uncorrected chi2(5) = 148.4759
Design-based F(3.19, 54.18) = 22.0446 P = 0.0000
svy: proportion dmdmartl, over(female)
(running proportion on estimation sample)
Survey: Proportion estimation
Number of strata = 14 Number of obs = 5553
Number of PSUs = 31 Population size = 223858353
Design df = 17
married: dmdmartl = married
widowed: dmdmartl = widowed
divorced: dmdmartl = divorced
separated: dmdmartl = separated
_prop_5: dmdmartl = never married
_prop_6: dmdmartl = living with partner
male: female = male
female: female = female
--------------------------------------------------------------
| Linearized
Over | Proportion Std. Err. [95% Conf. Interval]
-------------+------------------------------------------------
married |
male | .5463038 .0244819 .494338 .5972798
female | .5164898 .0186122 .4772006 .5555763
-------------+------------------------------------------------
widowed |
male | .0254448 .0029445 .0199183 .0324539
female | .0846048 .005444 .0738042 .0968207
-------------+------------------------------------------------
divorced |
male | .0864871 .0103046 .0670772 .1108462
female | .1256857 .0097098 .1065877 .1476401
-------------+------------------------------------------------
separated |
male | .0188045 .0035212 .0126507 .0278672
female | .0287416 .0042363 .0210327 .0391631
-------------+------------------------------------------------
_prop_5 |
male | .2342201 .0271275 .1818695 .2961843
female | .1659415 .021306 .1257079 .2158725
-------------+------------------------------------------------
_prop_6 |
male | .0887398 .0077162 .0737516 .106424
female | .0785366 .0066277 .0656434 .0937081
--------------------------------------------------------------
lincom [married]male - [married]female
( 1) [married]male - [married]female = 0
------------------------------------------------------------------------------
Proportion | Coef. Std. Err. t P>|t| [95% Conf. Interval]
-------------+----------------------------------------------------------------
(1) | .0298139 .0132293 2.25 0.038 .0019026 .0577253
------------------------------------------------------------------------------
display .5463038 - .5164898
.029814
Graphs with categorical variables
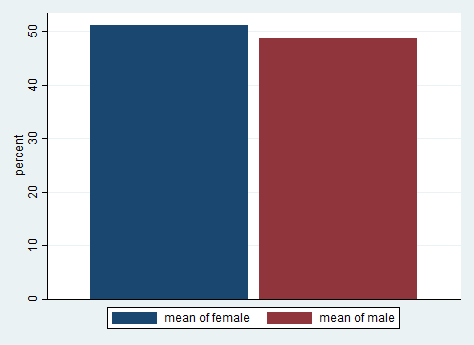
Let’s create a bar graph of the variable female. This graph will
show the percent of observations that are female and male. To do this, we
will need to create a new variable, which we will call male; it will
be the opposite of female.
gen male = !female graph bar (mean) female male [pw = wtint2yr], percentages bargap(7)
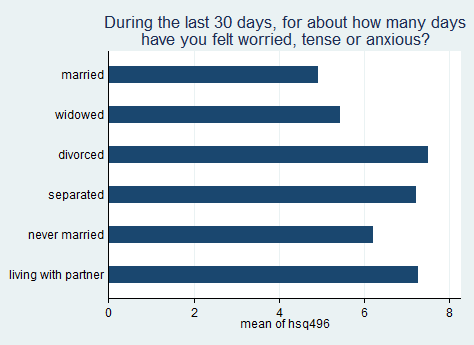
We can also graph the mean of the variable hsq496 by each level of
dmdmart1.
* hsq496 - During the past 30 days, for about how many days have you felt worried, tense or anxious?svy: mean hsq496, over(dmdmartl) (running mean on estimation sample) Survey: Mean estimation Number of strata = 14 Number of obs = 4692 Number of PSUs = 31 Population size = 193938169 Design df = 17 married: dmdmartl = married widowed: dmdmartl = widowed divorced: dmdmartl = divorced separated: dmdmartl = separated _subpop_5: dmdmartl = never married _subpop_6: dmdmartl = living with partner -------------------------------------------------------------- | Linearized Over | Mean Std. Err. [95% Conf. Interval] -------------+------------------------------------------------ hsq496 | married | 4.915051 .2864456 4.310704 5.519399 widowed | 5.450213 .3868792 4.633969 6.266457 divorced | 7.514127 .473958 6.514163 8.514091 separated | 7.231938 1.136924 4.833238 9.630637 _subpop_5 | 6.223865 .408766 5.361444 7.086286 _subpop_6 | 7.266146 .6322425 5.93223 8.600061 -------------------------------------------------------------- graph hbar hsq496 [pw = wtint2yr], over(dmdmartl, gap(*2)) /// title("During the last 30 days, for about how many days" /// "have you felt worried, tense or anxious?")
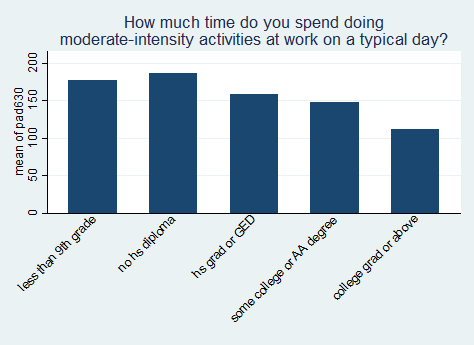
Finally, we will graph the mean of pad630 for each level of
dmdeduc2.
* pad630 - How much time do you spend doing moderate-intensity activities on a type work day?svy: mean pad630, over(dmdeduc2) (running mean on estimation sample) Survey: Mean estimation Number of strata = 14 Number of obs = 1706 Number of PSUs = 31 Population size = 77856183 Design df = 17 _subpop_1: dmdeduc2 = less than 9th grade _subpop_2: dmdeduc2 = no hs diploma _subpop_3: dmdeduc2 = hs grad or GED _subpop_4: dmdeduc2 = some college or AA degree _subpop_5: dmdeduc2 = college grad or above -------------------------------------------------------------- | Linearized Over | Mean Std. Err. [95% Conf. Interval] -------------+------------------------------------------------ pad630 | _subpop_1 | 176.8361 19.65517 135.3673 218.3048 _subpop_2 | 186.4248 6.52083 172.6671 200.1826 _subpop_3 | 157.9824 7.430086 142.3063 173.6585 _subpop_4 | 147.1004 10.20694 125.5657 168.6352 _subpop_5 | 111.1123 7.475883 95.3396 126.8851 --------------------------------------------------------------graph bar pad630 [pw = wtint2yr], over(dmdeduc2, label(angle(45))) /// title("How much time do you spend doing" /// "moderate-intensity activities at work on a typical day?")
OLS regression
Now that we have descriptive statistics on our variables, we may want to run
some inferential statistics, such as OLS regression or logistic regression.
As before, we simply need to use the -svy- prefix before our regression commands.
Please note that the following analyses are shown only as examples of how to
do these analyses in Stata. There was no attempt to create substantively
meaningful models. Rather, the variables were chosen for illustrative
purposes only. We do not recommend that researchers create their models
this way.
We will start with an OLS regression with one categorical predictor (female). This is equivalent to a t-test. We will use the margins command get the means for each group. The vce(unconditional) option is used on all of the margins commands. This is the entry for this option from the Stata documentation:
vce(unconditional) specifies that the covariates that are not fixed be treated in a way that accounts for their having been sampled. The VCE is estimated using the linearization method. This method allows for heteroskedasticity or other violations of distributional assumptions and allows for correlation among the observations in the same manner as vce(robust) and vce(cluster…), which may have been specified with the estimation command. This method also accounts for complex survey designs if the data are svyset. See Obtaining margins with survey data and representative samples. When you use complex survey data, this method requires that the linearized variance estimation method be used for the model. See [SVY]svypostestimation for an example of margins with replication-based methods.
The coeflegend option is also used; this is a handy option that can be used with many Stata estimation commands and gives the labels that Stata assigns to these values. You use these labels to refer to the values when using commands such as lincom.
* pad630 - How much time do you spend doing moderate-intensity activities on a type work day?
* t-test
svy: regress pad630 i.female
(running regress on estimation sample)
Survey: Linear regression
Number of strata = 14 Number of obs = 2,054
Number of PSUs = 31 Population size = 88,768,571
Design df = 17
F( 1, 17) = 31.67
Prob > F = 0.0000
R-squared = 0.0176
------------------------------------------------------------------------------
| Linearized
pad630 | Coef. Std. Err. t P>|t| [95% Conf. Interval]
-------------+----------------------------------------------------------------
female |
female | -33.94291 6.031448 -5.63 0.000 -46.66815 -21.21767
_cons | 155.6272 7.00838 22.21 0.000 140.8408 170.4136
------------------------------------------------------------------------------
margins female, vce(unconditional)
Adjusted predictions Number of obs = 2,054
Expression : Linear prediction, predict()
------------------------------------------------------------------------------
| Linearized
| Margin Std. Err. t P>|t| [95% Conf. Interval]
-------------+----------------------------------------------------------------
female |
male | 155.6272 7.00838 22.21 0.000 140.8408 170.4136
female | 121.6843 5.352345 22.73 0.000 110.3918 132.9767
------------------------------------------------------------------------------
display 121.6843 - 155.6272
-33.9429
margins female, vce(unconditional) post coeflegend
Adjusted predictions Number of obs = 2,054
Expression : Linear prediction, predict()
------------------------------------------------------------------------------
| Margin Legend
-------------+----------------------------------------------------------------
female |
male | 155.6272 _b[0bn.female]
female | 121.6843 _b[1.female]
------------------------------------------------------------------------------
lincom _b[1.female] - _b[0bn.female]
( 1) - 0bn.female + 1.female = 0
------------------------------------------------------------------------------
| Coef. Std. Err. t P>|t| [95% Conf. Interval]
-------------+----------------------------------------------------------------
(1) | -33.94291 6.031448 -5.63 0.000 -46.66815 -21.21767
------------------------------------------------------------------------------
We can runthe same anlaysis using the svy: mean and lincom commands.
svy, over(female): mean pad630
(running mean on estimation sample)
Survey: Mean estimation
Number of strata = 14 Number of obs = 2,054
Number of PSUs = 31 Population size = 88,768,571
Design df = 17
-----------------------------------------------------------------
| Linearized
| Mean Std. Err. [95% Conf. Interval]
----------------+------------------------------------------------
c.pad630@female |
male | 155.6272 7.00838 140.8408 170.4136
female | 121.6843 5.352345 110.3918 132.9767
-----------------------------------------------------------------
svy, over(female): mean pad630, coeflegend
(running mean on estimation sample)
Survey: Mean estimation
Number of strata = 14 Number of obs = 2,054
Number of PSUs = 31 Population size = 88,768,571
Design df = 17
---------------------------------------------------------------------------------
| Mean Legend
----------------+----------------------------------------------------------------
c.pad630@female |
male | 155.6272 _b[c.pad630@0bn.female]
female | 121.6843 _b[c.pad630@1.female]
---------------------------------------------------------------------------------
lincom _b[c.pad630@1.female] - _b[c.pad630@0bn.female]
( 1) - c.pad630@0bn.female + c.pad630@1.female = 0
------------------------------------------------------------------------------
Mean | Coef. Std. Err. t P>|t| [95% Conf. Interval]
-------------+----------------------------------------------------------------
(1) | -33.94291 6.031448 -5.63 0.000 -46.66815 -21.21767
------------------------------------------------------------------------------
We will add a continuous predictor to our OLS regression, so now the model has one categorical predictor (female) and one continuous predictor (ridageyr). In the output we see both the number of observations used in and the estimate of the size of the population. We see the overall test of the model and the R-squared for the model. The R-squared is the population R-squared and can be thought of as the adjusted R-squared. We will follow the svy: regress command with the margins command, which gives us the predicted values for each level of female.
svy: regress pad630 i.female ridageyr (running regress on estimation sample) Survey: Linear regression Number of strata = 14 Number of obs = 2054 Number of PSUs = 31 Population size = 88768571 Design df = 17 F( 2, 16) = 17.18 Prob > F = 0.0001 R-squared = 0.0193 ------------------------------------------------------------------------------ | Linearized pad630 | Coef. Std. Err. t P>|t| [95% Conf. Interval] -------------+---------------------------------------------------------------- female | female | -33.12513 6.018746 -5.50 0.000 -45.82358 -20.42669 ridageyr | -.287604 .1289996 -2.23 0.040 -.5597695 -.0154386 _cons | 167.2895 9.314455 17.96 0.000 147.6378 186.9413 ------------------------------------------------------------------------------ margins female, vce(unconditional) Predictive margins Number of obs = 2054 Expression : Linear prediction, predict() ------------------------------------------------------------------------------ | Linearized | Margin Std. Err. t P>|t| [95% Conf. Interval] -------------+---------------------------------------------------------------- female | male | 155.248 6.994755 22.19 0.000 140.4903 170.0056 female | 122.1228 5.366491 22.76 0.000 110.8005 133.4452 ------------------------------------------------------------------------------
Now let’s run a model with a categorical by categorical (specifically a binary by binary) interaction term.
We can use the contrast command to get the test of the interaction
displayed as an F-test rather than a t-statistic. Of course, the p-value
is exactly the same as the one shown in the table of coefficients because the test of a binary by binary interaction is a one degree-of-freedom test. We can use the margins command to get the predicted
values of pad630 for each combination of female and hsq571.
The marginsplot
command is used to obtain a graph of the interaction (marginsplot graphs the values shown
in the output from the margins command).
* pad630 = How much time do you spend doing moderate-intensity activities on a type work day?* hsq571 = During the past 12 months, have you donated blood?svy: regress pad630 i.female##i.hsq571 ridageyr (running regress on estimation sample) Survey: Linear regression Number of strata = 14 Number of obs = 1673 Number of PSUs = 31 Population size = 76183526 Design df = 17 F( 4, 14) = 22.40 Prob > F = 0.0000 R-squared = 0.0457 ------------------------------------------------------------------------------- | Linearized pad630 | Coef. Std. Err. t P>|t| [95% Conf. Interval] --------------+---------------------------------------------------------------- female | female | -40.42599 6.586285 -6.14 0.000 -54.32184 -26.53014 | hsq571 | yes | -42.38641 19.18468 -2.21 0.041 -82.86254 -1.910279 | female#hsq571 | female#yes | 59.28491 19.63991 3.02 0.008 17.84833 100.7215 | ridageyr | -.9869588 .2047143 -4.82 0.000 -1.418868 -.5550493 _cons | 209.1557 11.97401 17.47 0.000 183.8927 234.4186 ------------------------------------------------------------------------------- contrast female#hsq571 Contrasts of marginal linear predictions Design df = 17 Margins : asbalanced ------------------------------------------------- | df F P>F --------------+---------------------------------- female#hsq571 | 1 9.11 0.0077 Design | 17 ------------------------------------------------- Note: F statistics are adjusted for the survey design. margins female#hsq571, vce(unconditional) Predictive margins Number of obs = 1673 Expression : Linear prediction, predict() ------------------------------------------------------------------------------- | Linearized | Margin Std. Err. t P>|t| [95% Conf. Interval] --------------+---------------------------------------------------------------- female#hsq571 | male#no | 165.6268 6.65576 24.88 0.000 151.5844 179.6692 male#yes | 123.2404 22.22847 5.54 0.000 76.34241 170.1383 female#no | 125.2008 5.586263 22.41 0.000 113.4148 136.9868 female#yes | 142.0993 28.20328 5.04 0.000 82.59557 201.603 -------------------------------------------------------------------------------marginsplot Variables that uniquely identify margins: female hsq571
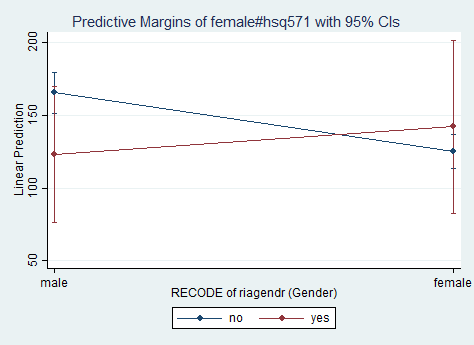
Some of you may recognize this analysis as a “difference-in-differences” analysis. In other words, the term of interest is the binary-by-binary interaction term. Let’s reproduce the coefficient of this interaction term, 59.28491, by taking the difference of the differences ((male_no – female_no) -(male_yes – female_yes)). First, we need to need to rerun the margins command with the post option, so that we can access the values remembered by margins with another command. Next, we will rerun the margins command, but with the coeflegend option only. This will show us the names of the values. We will use these names rather than the actual values themselves, so that if the data or model were changed, the code would not need to be modified. We will use the lincom command to do the math for us. The advantage of using the lincom command over the display command is that lincom will also produce the standard error.
margins female#hsq571, vce(unconditional) post Predictive margins Number of obs = 1,673 Expression : Linear prediction, predict() ------------------------------------------------------------------------------- | Linearized | Margin Std. Err. t P>|t| [95% Conf. Interval] --------------+---------------------------------------------------------------- female#hsq571 | male#no | 165.6268 6.65576 24.88 0.000 151.5844 179.6692 male#yes | 123.2404 22.22847 5.54 0.000 76.34241 170.1383 female#no | 125.2008 5.586263 22.41 0.000 113.4148 136.9868 female#yes | 142.0993 28.20328 5.04 0.000 82.59557 201.603 -------------------------------------------------------------------------------margins, coeflegend Predictive margins Number of obs = 1,673 Expression : Linear prediction, predict() ------------------------------------------------------------------------------- | Margin Legend --------------+---------------------------------------------------------------- female#hsq571 | male#no | 165.6268 _b[0bn.female#0bn.hsq571] male#yes | 123.2404 _b[0bn.female#1.hsq571] female#no | 125.2008 _b[1.female#0bn.hsq571] female#yes | 142.0993 _b[1.female#1.hsq571] -------------------------------------------------------------------------------lincom (_b[0bn.female#0bn.hsq571]-_b[0bn.female#1.hsq571]) - (_b[1.female#0bn.hsq571]-_b[1.female#1.hsq571]) ( 1) 0bn.female#0bn.hsq571 - 0bn.female#1.hsq571 - 1.female#0bn.hsq571 + 1.female#1.hsq571 = 0 ------------------------------------------------------------------------------ | Coef. Std. Err. t P>|t| [95% Conf. Interval] -------------+---------------------------------------------------------------- (1) | 59.28491 19.63991 3.02 0.008 17.84833 100.7215 ------------------------------------------------------------------------------
We can see that the output from the lincom command is the same as the output for the interaction term in the original regression command.
Looking back at the graph of the interaction, you may wonder if the two points for male are statistically significantly different from one another, and the same for the two points for females. The lincom command can be used for these comparisons.
* males
lincom _b[0bn.female#0bn.hsq571]-_b[0bn.female#1.hsq571]
( 1) 0bn.female#0bn.hsq571 - 0bn.female#1.hsq571 = 0
------------------------------------------------------------------------------
| Coef. Std. Err. t P>|t| [95% Conf. Interval]
-------------+----------------------------------------------------------------
(1) | 42.38641 19.18468 2.21 0.041 1.910279 82.86254
------------------------------------------------------------------------------
* females
lincom _b[1.female#0bn.hsq571]-_b[1.female#1.hsq571]
( 1) 1.female#0bn.hsq571 - 1.female#1.hsq571 = 0
------------------------------------------------------------------------------
| Coef. Std. Err. t P>|t| [95% Conf. Interval]
-------------+----------------------------------------------------------------
(1) | -16.8985 25.60101 -0.66 0.518 -70.91192 37.11491
------------------------------------------------------------------------------
Despite the overlapping error bars, the difference between yes and no on the variable hsq571 for males is statistically significant; it is not statistically significant for females.
In the next example, we will use a categorical by continuous interaction.
In the first call to the margins command, we get the simple slope
coefficients for males and females. The p-values in this table tell us
that both slopes are significantly different from 0. In the second call to the margins
command, we get the predicted values for each level of female at pad680 =
0, pad680 = 200, pad680 = 400, up to pad680 = 1400. The t-statistics and
corresponding p-values tell us if the predicted value is different from 0.
* pad680 = How much time do you usually spend sitting on a typical day?
svy: regress pad630 i.female##c.pad680
(running regress on estimation sample)
Survey: Linear regression
Number of strata = 14 Number of obs = 2050
Number of PSUs = 31 Population size = 88700876
Design df = 17
F( 3, 15) = 131.11
Prob > F = 0.0000
R-squared = 0.0894
---------------------------------------------------------------------------------
| Linearized
pad630 | Coef. Std. Err. t P>|t| [95% Conf. Interval]
----------------+----------------------------------------------------------------
female |
female | -73.89628 18.78819 -3.93 0.001 -113.5359 -34.25665
pad680 | -.2389814 .0194172 -12.31 0.000 -.2799481 -.1980148
|
female#c.pad680 |
female | .1273678 .0445652 2.86 0.011 .0333435 .2213922
|
_cons | 234.2159 9.710639 24.12 0.000 213.7282 254.7035
---------------------------------------------------------------------------------
margins female, dydx(pad680) vce(unconditional)
Average marginal effects Number of obs = 2050
Expression : Linear prediction, predict()
dy/dx w.r.t. : pad680
------------------------------------------------------------------------------
| Linearized
| dy/dx Std. Err. t P>|t| [95% Conf. Interval]
-------------+----------------------------------------------------------------
pad680 |
female |
male | -.2389814 .0194172 -12.31 0.000 -.2799481 -.1980148
female | -.1116136 .0293859 -3.80 0.001 -.1736123 -.0496149
------------------------------------------------------------------------------
margins female, at(pad680=(0(200)1400)) vsquish vce(unconditional)
Adjusted predictions Number of obs = 2050
Expression : Linear prediction, predict()
1._at : pad680 = 0
2._at : pad680 = 200
3._at : pad680 = 400
4._at : pad680 = 600
5._at : pad680 = 800
6._at : pad680 = 1000
7._at : pad680 = 1200
8._at : pad680 = 1400
------------------------------------------------------------------------------
| Linearized
| Margin Std. Err. t P>|t| [95% Conf. Interval]
-------------+----------------------------------------------------------------
_at#female |
1#male | 234.2159 9.710639 24.12 0.000 213.7282 254.7035
1#female | 160.3196 12.25815 13.08 0.000 134.4572 186.182
2#male | 186.4196 6.921151 26.93 0.000 171.8173 201.022
2#female | 137.9969 7.310548 18.88 0.000 122.573 153.4208
3#male | 138.6233 5.627637 24.63 0.000 126.75 150.4966
3#female | 115.6742 5.070343 22.81 0.000 104.9767 126.3717
4#male | 90.82704 6.752807 13.45 0.000 76.57986 105.0742
4#female | 93.35145 8.188708 11.40 0.000 76.07479 110.6281
5#male | 43.03076 9.470621 4.54 0.000 23.04949 63.01202
5#female | 71.02874 13.3223 5.33 0.000 42.92113 99.13634
6#male | -4.765528 12.80418 -0.37 0.714 -31.77999 22.24893
6#female | 48.70602 18.89431 2.58 0.020 8.842508 88.56953
7#male | -52.56181 16.38181 -3.21 0.005 -87.1244 -17.99922
7#female | 26.3833 24.60871 1.07 0.299 -25.53653 78.30313
8#male | -100.3581 20.07342 -5.00 0.000 -142.7093 -58.00688
8#female | 4.060579 30.38526 0.13 0.895 -60.04672 68.16788
------------------------------------------------------------------------------
marginsplot
Variables that uniquely identify margins: pad680 female
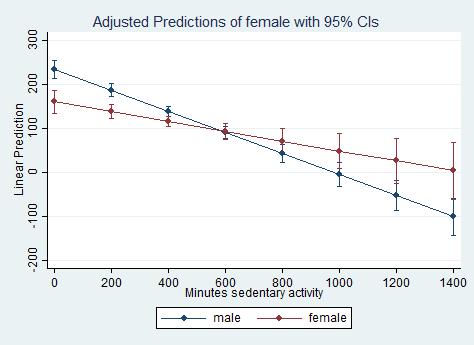
In the example below, we get the difference between the predicted values for
males and females at eight values of pad680. We then use the
marginsplot command to graph these differences. This graph shows that
the difference between males and females is larger at the extreme values of
pad680, as is the variability around those estimates.
Notice that is in the output from the margins command above, the
predicted value for 4#female is 93.35145 and the predicted value for 4#male
is 90.82704. 93.35145-90.82704 = 2.52441, which is the value of dy/dx
on line 4 of the output below. The corresponding p-value is .808,
which is not statistically significant. You can see this in the graph
above, where the point for males and females appear to be on top of each
other.
margins, dydx(female) at(pad680=(0(200)1400)) vsquish vce(unconditional) Conditional marginal effects Number of obs = 2050 Expression : Linear prediction, predict() dy/dx w.r.t. : 1.female 1._at : pad680 = 0 2._at : pad680 = 200 3._at : pad680 = 400 4._at : pad680 = 600 5._at : pad680 = 800 6._at : pad680 = 1000 7._at : pad680 = 1200 8._at : pad680 = 1400 ------------------------------------------------------------------------------ | Linearized | dy/dx Std. Err. t P>|t| [95% Conf. Interval] -------------+---------------------------------------------------------------- 1.female | _at | 1 | -73.89628 18.78819 -3.93 0.001 -113.5359 -34.25665 2 | -48.42271 10.55029 -4.59 0.000 -70.68189 -26.16354 3 | -22.94915 5.339066 -4.30 0.000 -34.21359 -11.6847 4 | 2.524416 10.22678 0.25 0.808 -19.05221 24.10104 5 | 27.99798 18.42697 1.52 0.147 -10.87952 66.87548 6 | 53.47154 27.08143 1.97 0.065 -3.665269 110.6084 7 | 78.94511 35.86278 2.20 0.042 3.281267 154.609 8 | 104.4187 44.69629 2.34 0.032 10.11775 198.7196 ------------------------------------------------------------------------------ Note: dy/dx for factor levels is the discrete change from the base level.marginsplot, yline(0) Variables that uniquely identify margins: pad680
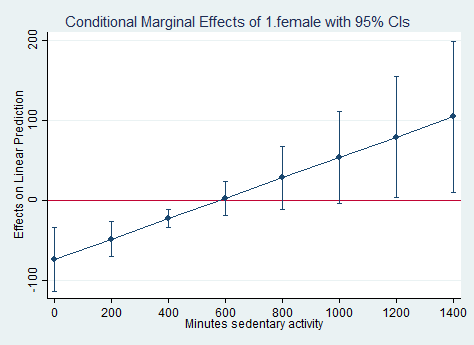
Let’s remake this graph with confidence interval as an area plot.
marginsplot, recast(line) recastci(rarea) yline(0) Variables that uniquely identify margins: pad680
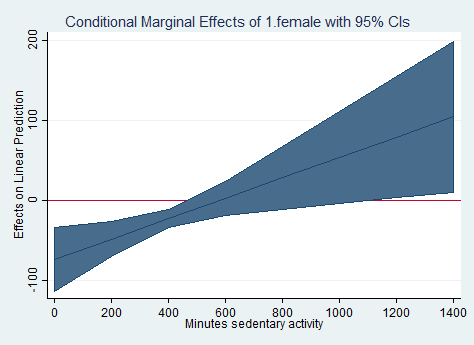
If we use a categorical predictor variable in our model that has more than
two levels, we may want to run comparisons between each of the levels. In
the example below, we use the educational attainment variable, dmdeduc2,
as a predictor. We use the contrast command to determine if, taken
together, dmdeduc2, is a statistically significant predictor of our
outcome variable, pad630. Next, we use the pwcompare command
to conduct all pairwise comparisons. We use the mcompare(sidak)
option to adjust the p-values for the multiple comparisons, and we use the
pveffects option to have the test statistics and p-values shown in the
output. Other options that we could have used with the mcompare
option are bonferroni and scheffe.
svy: regress pad630 i.dmdeduc2 ridageyr
(running regress on estimation sample)
Survey: Linear regression
Number of strata = 14 Number of obs = 1706
Number of PSUs = 31 Population size = 77856183
Design df = 17
F( 5, 13) = 14.67
Prob > F = 0.0001
R-squared = 0.0541
--------------------------------------------------------------------------------------------
| Linearized
pad630 | Coef. Std. Err. t P>|t| [95% Conf. Interval]
---------------------------+----------------------------------------------------------------
dmdeduc2 |
no hs diploma | 5.590284 17.44227 0.32 0.752 -31.20968 42.39025
hs grad or GED | -23.40642 18.92372 -1.24 0.233 -63.33198 16.51915
some college or AA degree | -36.62121 23.10453 -1.59 0.131 -85.36752 12.12509
college grad or above | -69.28669 22.12513 -3.13 0.006 -115.9666 -22.60674
|
ridageyr | -1.167769 .2339256 -4.99 0.000 -1.661309 -.6742287
_cons | 235.0531 18.73331 12.55 0.000 195.5293 274.5769
--------------------------------------------------------------------------------------------
contrast dmdeduc2
Contrasts of marginal linear predictions
Design df = 17
Margins : asbalanced
------------------------------------------------
| df F P>F
-------------+----------------------------------
dmdeduc2 | 4 14.46 0.0001
Design | 17
------------------------------------------------
Note: F statistics are adjusted for the survey
design.
pwcompare dmdeduc2, mcompare(sidak) cformat(%3.1f) pveffects
Pairwise comparisons of marginal linear predictions
Design df = 17
Margins : asbalanced
---------------------------
| Number of
| Comparisons
-------------+-------------
dmdeduc2 | 10
---------------------------
--------------------------------------------------------------------------------------------
| Sidak
| Contrast Std. Err. t P>|t|
----------------------------------------------------+---------------------------------------
dmdeduc2 |
no hs diploma vs less than 9th grade | 5.6 17.4 0.32 1.000
hs grad or GED vs less than 9th grade | -23.4 18.9 -1.24 0.929
some college or AA degree vs less than 9th grade | -36.6 23.1 -1.59 0.756
college grad or above vs less than 9th grade | -69.3 22.1 -3.13 0.059
hs grad or GED vs no hs diploma | -29.0 9.8 -2.95 0.087
some college or AA degree vs no hs diploma | -42.2 10.0 -4.23 0.006
college grad or above vs no hs diploma | -74.9 10.2 -7.31 0.000
some college or AA degree vs hs grad or GED | -13.2 13.9 -0.95 0.988
college grad or above vs hs grad or GED | -45.9 13.2 -3.47 0.029
college grad or above vs some college or AA degree | -32.7 12.2 -2.68 0.147
--------------------------------------------------------------------------------------------
Logistic regression
Let’s run a logistic regression. We will use the variable paq665
(do you do any moderate-intensity sports, fitness or recreational activities
that cause a small increase in breathing or heart rate at least 10 minutes
continually?)
as the outcome variable. We will also limit the analysis to those who are
greater than age 20. Before we run our logistic regression, let’s look at
the distribution of the outcome variable, and let’s look at the crosstabulation
of the outcome variable with our categorical predictor variable. The
purpose of the first descriptive analysis is to assess the proportion and number
of cases in each level of the outcome variable. If we found that there was
a very small proportion of cases in one of the levels, we may encounter
estimation problems with the logistic regression. Likewise, if the
crosstabulation between the outcome variable and the categorical predictor
variable showed that one or more cells had very few unweighted observations or
no observations at all, we might want to recode the predictor variable into
fewer categories so that there were a sufficient number of observations in each
cell. The results below do not look problematic, although there are
relatively few observations that are coded as 1 on our outcome variable and 5 on
our predictor variable. This might increase the standard error around that
point estimate.
* paq665 = Do you do any moderate-intensity sports, fitness or recreational activities that cause a small increase in breathing or heart rate at least 10 minutes continually?svy, subpop(if ridageyr > 20): tab paq665, /// cell obs count cellwidth(12) format(%12.2g) (running tabulate on estimation sample) Number of strata = 14 Number of obs = 9755 Number of PSUs = 31 Population size = 306516207 Subpop. no. of obs = 5443 Subpop. size = 218554854 Design df = 17 ---------------------------------------------------- Moderate | recreatio | nal | activitie | s | count proportions obs ----------+----------------------------------------- no | 116709772 .53 3195 yes | 101845081 .47 2248 | Total | 218554854 1 5443 ---------------------------------------------------- Key: count = weighted counts proportions = cell proportions obs = number of observations * hsq010 - Would you say that your general health issvy, subpop(if ridageyr > 20): tab hsd010 paq665, /// cell obs count cellwidth(12) format(%12.2g) (running tabulate on estimation sample) Number of strata = 14 Number of obs = 8915 Number of PSUs = 31 Population size = 277379812 Subpop. no. of obs = 4603 Subpop. size = 189418459 Design df = 17 ---------------------------------------------------- General | health | Moderate recreational activities condition | no yes Total ----------+----------------------------------------- excellen | 9401577 13365343 22766920 | .05 .071 .12 | 223 234 457 | very goo | 27412706 34747263 62159969 | .14 .18 .33 | 591 650 1241 | good | 41493331 31885029 73378359 | .22 .17 .39 | 1092 753 1845 | fair | 18274770 8295293 26570064 | .096 .044 .14 | 634 256 890 | poor | 3896015 647132 4543147 | .021 .0034 .024 | 145 25 170 | Total | 100478399 88940060 189418459 | .53 .47 1 | 2685 1918 4603 ---------------------------------------------------- Key: weighted counts cell proportions number of observations Pearson: Uncorrected chi2(4) = 386.5375 Design-based F(2.76, 46.90) = 35.0850 P = 0.0000
Now let’s run the logistic regression. We can use the contrast command
to get the multi-degree-of-freedom test of hsd010 (which is statistically significant). Note that the logistic regression coefficients are interpreted the same way that they are in an unweighted model.
svy, subpop(if ridageyr > 20): logit paq665 ib3.hsd010 c.ridageyr
(running logit on estimation sample)
Survey: Logistic regression
Number of strata = 14 Number of obs = 8915
Number of PSUs = 31 Population size = 277379812
Subpop. no. of obs = 4603
Subpop. size = 189418459
Design df = 17
F( 5, 13) = 37.01
Prob > F = 0.0000
------------------------------------------------------------------------------
| Linearized
paq665 | Coef. Std. Err. t P>|t| [95% Conf. Interval]
-------------+----------------------------------------------------------------
hsd010 |
excellent | .5986804 .1120919 5.34 0.000 .3621872 .8351736
very good | .4914449 .1141339 4.31 0.000 .2506434 .7322465
fair | -.4945664 .1127125 -4.39 0.000 -.7323691 -.2567638
poor | -1.450551 .2048429 -7.08 0.000 -1.882732 -1.01837
|
ridageyr | -.0109676 .00292 -3.76 0.002 -.0171282 -.004807
_cons | .2653286 .1382701 1.92 0.072 -.0263958 .557053
------------------------------------------------------------------------------
contrast hsd010
Contrasts of marginal linear predictions
Design df = 17
Margins : asbalanced
------------------------------------------------
| df F P>F
-------------+----------------------------------
hsd010 | 4 44.44 0.0000
Design | 17
------------------------------------------------
Note: F statistics are adjusted for the survey
design.
Let’s include a categorical by continuous interaction in the model. We
will use the contrast command to determine if the interaction term (as a
whole) is statistically significant. We will use the contrast
command to get the multi-degree-of-freedom test of the interaction, the margins
command to get the predicted probabilities and the marginsplot command
to graph the interaction.
* paq665 = Do you do any moderate-intensity sports, fitness or recreational activities that cause a small increase in breathing or heart rate at least 10 minutes continually? * hsd010 = Would you say that your general health is...; 1 = excellent, 2 = very good, 3 = good, 4 = fair, 5 = poorsvy, subpop(if ridageyr > 20): logit paq665 ib3.hsd010##c.ridageyr (running logit on estimation sample) Survey: Logistic regression Number of strata = 14 Number of obs = 8915 Number of PSUs = 31 Population size = 277379812 Subpop. no. of obs = 4603 Subpop. size = 189418459 Design df = 17 F( 9, 9) = 50.07 Prob > F = 0.0000 ----------------------------------------------------------------------------------- | Linearized paq665 | Coef. Std. Err. t P>|t| [95% Conf. Interval] ------------------+---------------------------------------------------------------- hsd010 | excellent | .3858144 .5191089 0.74 0.467 -.7094096 1.481038 very good | .652864 .2254827 2.90 0.010 .1771372 1.128591 fair | .3499552 .3042182 1.15 0.266 -.2918891 .9917995 poor | -.9774887 1.318543 -0.74 0.469 -3.759372 1.804395 | ridageyr | -.0083106 .004617 -1.80 0.090 -.0180516 .0014303 | hsd010#c.ridageyr | excellent | .0046206 .0101254 0.46 0.654 -.0167421 .0259833 very good | -.0033669 .0042601 -0.79 0.440 -.0123549 .0056211 fair | -.0170309 .0064368 -2.65 0.017 -.0306114 -.0034504 poor | -.0090097 .0265987 -0.34 0.739 -.0651279 .0471086 | _cons | .1376637 .2029975 0.68 0.507 -.2906237 .5659511 ----------------------------------------------------------------------------------- contrast hsd010#c.ridageyr Contrasts of marginal linear predictions Design df = 17 Margins : asbalanced ----------------------------------------------------- | df F P>F ------------------+---------------------------------- hsd010#c.ridageyr | 4 4.73 0.0126 Design | 17 ----------------------------------------------------- Note: F statistics are adjusted for the survey design.margins hsd010, subpop(if ridageyr > 20) at(ridageyr=(20(10)80)) /// vsquish vce(unconditional) Adjusted predictions Number of obs = 8915 Subpop. no. of obs = 4603 Expression : Pr(paq665), predict() 1._at : ridageyr = 20 2._at : ridageyr = 30 3._at : ridageyr = 40 4._at : ridageyr = 50 5._at : ridageyr = 60 6._at : ridageyr = 70 7._at : ridageyr = 80 ------------------------------------------------------------------------------ | Linearized | Margin Std. Err. t P>|t| [95% Conf. Interval] -------------+---------------------------------------------------------------- _at#hsd010 | 1#excellent | .6105625 .0627257 9.73 0.000 .4782229 .7429022 1#very good | .6357529 .030173 21.07 0.000 .5720935 .6994123 1#good | .4928633 .0299032 16.48 0.000 .4297731 .5559535 1#fair | .4951972 .0374002 13.24 0.000 .4162897 .5741046 1#poor | .2339337 .1366427 1.71 0.105 -.0543571 .5222245 2#excellent | .6017536 .0467599 12.87 0.000 .5030987 .7004084 2#very good | .6083073 .0251426 24.19 0.000 .555261 .6613536 2#good | .4721152 .0212358 22.23 0.000 .4273116 .5169188 2#fair | .4322622 .0318406 13.58 0.000 .3650845 .4994399 2#poor | .2043323 .0853799 2.39 0.029 .0241965 .3844681 3#excellent | .5928782 .0329296 18.00 0.000 .5234028 .6623537 3#very good | .5801593 .0224851 25.80 0.000 .5327198 .6275988 3#good | .451463 .0165591 27.26 0.000 .4165264 .4863996 3#fair | .3714403 .0279114 13.31 0.000 .3125525 .4303282 3#poor | .1776082 .043438 4.09 0.001 .0859621 .2692544 4#excellent | .5839418 .0257247 22.70 0.000 .5296674 .6382163 4#very good | .55148 .0236447 23.32 0.000 .501594 .6013659 4#good | .4309767 .0189088 22.79 0.000 .3910827 .4708706 4#fair | .3144367 .0261895 12.01 0.000 .2591816 .3696917 4#poor | .1537041 .0180881 8.50 0.000 .1155416 .1918666 5#excellent | .5749499 .0307861 18.68 0.000 .5099969 .6399029 5#very good | .5224542 .0284286 18.38 0.000 .4624752 .5824332 5#good | .4107239 .0261597 15.70 0.000 .3555316 .4659161 5#fair | .2625274 .0261464 10.04 0.000 .2073633 .3176914 5#poor | .1324989 .030077 4.41 0.000 .0690418 .1959559 6#excellent | .5659081 .0443458 12.76 0.000 .4723467 .6594696 6#very good | .4932759 .0354001 13.93 0.000 .4185883 .5679635 6#good | .3907692 .0350558 11.15 0.000 .3168079 .4647305 6#fair | .2164816 .0266714 8.12 0.000 .1602098 .2727533 6#poor | .1138257 .0489862 2.32 0.033 .0104739 .2171774 7#excellent | .5568223 .0611297 9.11 0.000 .4278498 .6857948 7#very good | .4641434 .0433376 10.71 0.000 .3727091 .5555776 7#good | .3711734 .0442524 8.39 0.000 .277809 .4645377 7#fair | .1765782 .026898 6.56 0.000 .1198284 .2333281 7#poor | .0974883 .0635355 1.53 0.143 -.0365598 .2315365 ------------------------------------------------------------------------------ marginsplot Variables that uniquely identify margins: ridageyr hsd010
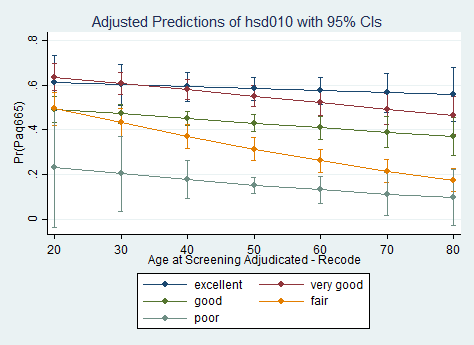
Next, we will run a logistic regression model and use the
estat gof command to get the Archer-Lemeshow test (which is a modification
of the Hosmer-Lemeshow test that can be used with survey data). The
numerator degrees of freedom are calculated as g – 1, and the denominator
degrees of freedom are calculated as f – g + 2, where f = the number of sampled
clusters – the number of strata and g = the number of groups (10 is the
default). For the following example, we have 10 – 1 = 9 numerator degrees
of freedom and 17 – 10 + 2 = 9 denominator degrees of freedom.
As of Stata 16, estat gof cannot follow a model specified with a
subpopulation.
* paq665 = Do you do any moderate-intensity sports, fitness or recreational
activities that cause a small increase in breathing or heart rate at least 10 minutes continually?
* pad680 = How much time do you usually spend sitting on a typical day?
svy: logit paq665 i.female##c.pad680
(running logit on estimation sample)
Survey: Logistic regression
Number of strata = 14 Number of obs = 6742
Number of PSUs = 31 Population size = 255503942
Design df = 17
F( 3, 15) = 1.16
Prob > F = 0.3593
---------------------------------------------------------------------------------
| Linearized
paq665 | Coef. Std. Err. t P>|t| [95% Conf. Interval]
----------------+----------------------------------------------------------------
female |
female | .1277199 .1276729 1.00 0.331 -.1416463 .3970861
pad680 | .0000791 .0002271 0.35 0.732 -.0004 .0005582
|
female#c.pad680 |
female | -.0003267 .0002309 -1.41 0.175 -.0008139 .0001605
|
_cons | -.1236965 .1246061 -0.99 0.335 -.3865923 .1391994
---------------------------------------------------------------------------------
estat gof
Logistic model for paq665, goodness-of-fit test
F(9,9) = 0.89
Prob > F = 0.5656
Ordinal Logistic Regression
Here is an example of an ordinal logistic regression. The outcome variable, dmdeduc2, has ordered categories, but it is not a continuous variable. In the first call, we get the coefficients in the log-odds metric. In the second call, we request odds ratios. The discussion of ordinal logistic regression will be minimal; for more information regarding ordinal logistic regression, please see our Stata Data Analysis Examples: Ordinal Logistic Regression and Stata Annotated Output: Ordinal Logistic Regression. Although these pages show examples that use non-weighted data, they are still helpful because the interpretation of the coefficients is the same with weighted and non-weighted data.
svy: ologit dmdeduc2 i.female i.dmdborn4 pad680
(running ologit on estimation sample)
Survey: Ordered logistic regression
Number of strata = 14 Number of obs = 5,522
Number of PSUs = 31 Population size = 222,978,408
Design df = 17
F( 3, 15) = 95.22
Prob > F = 0.0000
------------------------------------------------------------------------------
| Linearized
dmdeduc2 | Coef. Std. Err. t P>|t| [95% Conf. Interval]
-------------+----------------------------------------------------------------
female |
female | .0975701 .048719 2.00 0.061 -.0052179 .2003581
|
dmdborn4 |
born in US | .7093888 .1216176 5.83 0.000 .4527981 .9659794
pad680 | .001924 .0001423 13.52 0.000 .0016238 .0022242
-------------+----------------------------------------------------------------
/cut1 | -1.528006 .1535442 -1.851956 -1.204056
/cut2 | -.3100434 .156401 -.6400207 .0199339
/cut3 | .8094935 .1349988 .524671 1.094316
/cut4 | 2.215668 .1222484 1.957747 2.47359
------------------------------------------------------------------------------
ologit, or
Survey: Ordered logistic regression
Number of strata = 14 Number of obs = 5,522
Number of PSUs = 31 Population size = 222,978,408
Design df = 17
F( 3, 15) = 95.22
Prob > F = 0.0000
------------------------------------------------------------------------------
| Linearized
dmdeduc2 | Odds Ratio Std. Err. t P>|t| [95% Conf. Interval]
-------------+----------------------------------------------------------------
female |
female | 1.102489 .0537121 2.00 0.061 .9947957 1.22184
|
dmdborn4 |
born in US | 2.032748 .2472179 5.83 0.000 1.572707 2.62736
pad680 | 1.001926 .0001426 13.52 0.000 1.001625 1.002227
-------------+----------------------------------------------------------------
/cut1 | -1.528006 .1535442 -1.851956 -1.204056
/cut2 | -.3100434 .156401 -.6400207 .0199339
/cut3 | .8094935 .1349988 .524671 1.094316
/cut4 | 2.215668 .1222484 1.957747 2.47359
------------------------------------------------------------------------------
Note: Estimates are transformed only in the first equation.
Multinomial Logistic Regression
The outcome variable in a multinomial logistic regression has unordered categories. One of these categories must be selected as the base, or reference, category. A series of simultaneously estimated logistic regression are run, in which each category is the alternative to the base category. In the first call, we get regression coefficients in the metric of log-odds. In the second call, we request relative risk ratios with the rrr option. For more information about multinomial logistic regression, please see Stata Data Analysis Examples: Multinomial Logistic Regression and Stata Annotated Output: Multinomial Logistic Regression Although these pages show examples that use non-weighted data, they are still helpful because the interpretation of the coefficients is the same with weighted and non-weighted data.
Before we run the multinomial logit model, it is a good idea check on the raw (AKA unweighted) number of observations in each of the cells created by the outcome variable and the two categorical predictors. There are several different commands that can be used to get this information. Because there are three variables, the tables command is convenient. This command allows for the use of a pweight, but because we are only interested in the raw count, that specification is not used here.
table dmdmartl female dmdborn4
------------------------------------------------------
| Country of birth - recode and
| RECODE of riagendr (Gender)
| - born elsew - - born in US -
Marital Status | male female male female
--------------------+---------------------------------
married | 554 476 874 777
widowed | 23 82 99 263
divorced | 32 70 205 264
separated | 36 54 43 71
never married | 150 133 482 421
living with partner | 69 64 168 139
------------------------------------------------------
svy: mlogit dmdmartl i.female i.dmdborn4 ridageyr
(running mlogit on estimation sample)
Survey: Multinomial logistic regression
Number of strata = 14 Number of obs = 5,549
Number of PSUs = 31 Population size = 223,762,858
Design df = 17
F( 15, 3) = 154.71
Prob > F = 0.0007
-------------------------------------------------------------------------------------
| Linearized
dmdmartl | Coef. Std. Err. t P>|t| [95% Conf. Interval]
--------------------+----------------------------------------------------------------
married | (base outcome)
--------------------+----------------------------------------------------------------
widowed |
female |
female | 1.357308 .168816 8.04 0.000 1.001137 1.713478
|
dmdborn4 |
born in US | .0019271 .2086605 0.01 0.993 -.438308 .4421623
ridageyr | .1116445 .0084283 13.25 0.000 .0938623 .1294267
_cons | -10.02434 .6622772 -15.14 0.000 -11.42162 -8.627059
--------------------+----------------------------------------------------------------
divorced |
female |
female | .4469732 .1491499 3.00 0.008 .1322944 .7616521
|
dmdborn4 |
born in US | .7584749 .162126 4.68 0.000 .416419 1.100531
ridageyr | .0096327 .0040714 2.37 0.030 .0010429 .0182225
_cons | -3.00159 .2543555 -11.80 0.000 -3.538233 -2.464947
--------------------+----------------------------------------------------------------
separated |
female |
female | .4641578 .2019445 2.30 0.034 .0380921 .8902235
|
dmdborn4 |
born in US | -1.010353 .1878828 -5.38 0.000 -1.406751 -.6139551
ridageyr | -.0088637 .0046056 -1.92 0.071 -.0185807 .0008532
_cons | -2.212797 .2966892 -7.46 0.000 -2.838757 -1.586838
--------------------+----------------------------------------------------------------
never_married |
female |
female | -.398476 .0843935 -4.72 0.000 -.5765307 -.2204213
|
dmdborn4 |
born in US | .4267775 .1129206 3.78 0.001 .1885358 .6650193
ridageyr | -.0850085 .0084184 -10.10 0.000 -.1027698 -.0672473
_cons | 2.363903 .3308254 7.15 0.000 1.665922 3.061884
--------------------+----------------------------------------------------------------
living_with_partner |
female |
female | -.1411605 .0675459 -2.09 0.052 -.2836699 .001349
|
dmdborn4 |
born in US | -.0217679 .1111904 -0.20 0.847 -.2563591 .2128233
ridageyr | -.0553271 .0077755 -7.12 0.000 -.071732 -.0389222
_cons | .6739354 .3027322 2.23 0.040 .0352263 1.312645
-------------------------------------------------------------------------------------
mlogit, rrr
Survey: Multinomial logistic regression
Number of strata = 14 Number of obs = 5,549
Number of PSUs = 31 Population size = 223,762,858
Design df = 17
F( 15, 3) = 154.71
Prob > F = 0.0007
-------------------------------------------------------------------------------------
| Linearized
dmdmartl | RRR Std. Err. t P>|t| [95% Conf. Interval]
--------------------+----------------------------------------------------------------
married | (base outcome)
--------------------+----------------------------------------------------------------
widowed |
female |
female | 3.885718 .6559715 8.04 0.000 2.721375 5.548227
|
dmdborn4 |
born in US | 1.001929 .209063 0.01 0.993 .645127 1.556068
ridageyr | 1.118115 .0094238 13.25 0.000 1.098408 1.138176
_cons | .0000443 .0000293 -15.14 0.000 .000011 .0001792
--------------------+----------------------------------------------------------------
divorced |
female |
female | 1.563572 .2332067 3.00 0.008 1.141444 2.141812
|
dmdborn4 |
born in US | 2.135018 .3461418 4.68 0.000 1.516521 3.005761
ridageyr | 1.009679 .0041108 2.37 0.030 1.001043 1.01839
_cons | .049708 .0126435 -11.80 0.000 .0290646 .0850134
--------------------+----------------------------------------------------------------
separated |
female |
female | 1.590674 .3212279 2.30 0.034 1.038827 2.435674
|
dmdborn4 |
born in US | .3640904 .0684063 -5.38 0.000 .2449378 .5412061
ridageyr | .9911755 .004565 -1.92 0.071 .9815909 1.000854
_cons | .1093942 .0324561 -7.46 0.000 .0584983 .2045715
--------------------+----------------------------------------------------------------
never_married |
female |
female | .6713424 .0566569 -4.72 0.000 .5618442 .8021808
|
dmdborn4 |
born in US | 1.532312 .1730296 3.78 0.001 1.20748 1.944528
ridageyr | .9185044 .0077323 -10.10 0.000 .9023346 .934964
_cons | 10.63237 3.517458 7.15 0.000 5.290551 21.36777
--------------------+----------------------------------------------------------------
living_with_partner |
female |
female | .86835 .0586535 -2.09 0.052 .7530151 1.00135
|
dmdborn4 |
born in US | .9784673 .1087961 -0.20 0.847 .773864 1.237166
ridageyr | .9461756 .007357 -7.12 0.000 .9307803 .9618255
_cons | 1.961943 .5939434 2.23 0.040 1.035854 3.715988
-------------------------------------------------------------------------------------
Note: _cons estimates baseline relative risk for each outcome.
In the next example, we will change the base category to “never married”, which has a numerical value of 5.
svy: mlogit dmdmartl i.female i.dmdborn4 ridageyr, base(5)
(running mlogit on estimation sample)
Survey: Multinomial logistic regression
Number of strata = 14 Number of obs = 5,549
Number of PSUs = 31 Population size = 223,762,858
Design df = 17
F( 15, 3) = 154.71
Prob > F = 0.0007
-------------------------------------------------------------------------------------
| Linearized
dmdmartl | Coef. Std. Err. t P>|t| [95% Conf. Interval]
--------------------+----------------------------------------------------------------
married |
female |
female | .398476 .0843935 4.72 0.000 .2204213 .5765307
|
dmdborn4 |
born in US | -.4267775 .1129206 -3.78 0.001 -.6650193 -.1885358
ridageyr | .0850085 .0084184 10.10 0.000 .0672473 .1027698
_cons | -2.363903 .3308254 -7.15 0.000 -3.061884 -1.665922
--------------------+----------------------------------------------------------------
widowed |
female |
female | 1.755784 .1971662 8.91 0.000 1.339799 2.171768
|
dmdborn4 |
born in US | -.4248504 .2109377 -2.01 0.060 -.86989 .0201891
ridageyr | .196653 .0089714 21.92 0.000 .1777251 .215581
_cons | -12.38824 .5558984 -22.29 0.000 -13.56109 -11.2154
--------------------+----------------------------------------------------------------
divorced |
female |
female | .8454492 .1626544 5.20 0.000 .5022784 1.18862
|
dmdborn4 |
born in US | .3316974 .1990398 1.67 0.114 -.0882398 .7516346
ridageyr | .0946413 .0090581 10.45 0.000 .0755304 .1137521
_cons | -5.365493 .4196895 -12.78 0.000 -6.25096 -4.480025
--------------------+----------------------------------------------------------------
separated |
female |
female | .8626338 .2060073 4.19 0.001 .4279964 1.297271
|
dmdborn4 |
born in US | -1.437131 .1833229 -7.84 0.000 -1.823908 -1.050353
ridageyr | .0761448 .0089039 8.55 0.000 .0573593 .0949304
_cons | -4.5767 .5176634 -8.84 0.000 -5.668875 -3.484526
--------------------+----------------------------------------------------------------
never_married | (base outcome)
--------------------+----------------------------------------------------------------
living_with_partner |
female |
female | .2573155 .113537 2.27 0.037 .0177734 .4968576
|
dmdborn4 |
born in US | -.4485455 .1331958 -3.37 0.004 -.729564 -.1675269
ridageyr | .0296815 .0096949 3.06 0.007 .0092269 .050136
_cons | -1.689968 .385004 -4.39 0.000 -2.502255 -.8776802
-------------------------------------------------------------------------------------
Let’s add an interaction term to the model.
svy: mlogit dmdmartl i.female##i.dmdborn4 ridageyr, base(5)
(running mlogit on estimation sample)
Survey: Multinomial logistic regression
Number of strata = 14 Number of obs = 5,549
Number of PSUs = 31 Population size = 223,762,858
Design df = 17
F( 17, 1) = .
Prob > F = .
-------------------------------------------------------------------------------------
| Linearized
dmdmartl | Coef. Std. Err. t P>|t| [95% Conf. Interval]
--------------------+----------------------------------------------------------------
married |
female |
female | .1003884 .1438395 0.70 0.495 -.2030863 .4038632
|
dmdborn4 |
born in US | -.5968325 .1346948 -4.43 0.000 -.8810136 -.3126514
|
female#dmdborn4 |
female#born in US | .3652957 .213228 1.71 0.105 -.0845761 .8151674
|
ridageyr | .0851873 .0083587 10.19 0.000 .0675519 .1028227
_cons | -2.232335 .3430988 -6.51 0.000 -2.95621 -1.50846
--------------------+----------------------------------------------------------------
widowed |
female |
female | 1.779204 .2723828 6.53 0.000 1.204526 2.353881
|
dmdborn4 |
born in US | -.3339547 .3218789 -1.04 0.314 -1.01306 .3451505
|
female#dmdborn4 |
female#born in US | -.0091055 .3663452 -0.02 0.980 -.7820264 .7638154
|
ridageyr | .1968776 .0089084 22.10 0.000 .1780826 .2156727
_cons | -12.48612 .5000783 -24.97 0.000 -13.5412 -11.43105
--------------------+----------------------------------------------------------------
divorced |
female |
female | 1.113447 .3127748 3.56 0.002 .4535501 1.773344
|
dmdborn4 |
born in US | .5648089 .3206244 1.76 0.096 -.1116494 1.241267
|
female#dmdborn4 |
female#born in US | -.2706462 .3672125 -0.74 0.471 -1.045397 .5041044
|
ridageyr | .0947758 .0090431 10.48 0.000 .0756966 .1138551
_cons | -5.5948 .4459803 -12.54 0.000 -6.535736 -4.653864
--------------------+----------------------------------------------------------------
separated |
female |
female | .7043941 .4025168 1.75 0.098 -.1448421 1.55363
|
dmdborn4 |
born in US | -1.504133 .3361909 -4.47 0.000 -2.213434 -.7948321
|
female#dmdborn4 |
female#born in US | .1754885 .5953786 0.29 0.772 -1.08065 1.431628
|
ridageyr | .0762562 .0089172 8.55 0.000 .0574425 .09507
_cons | -4.516683 .5152722 -8.77 0.000 -5.603812 -3.429553
--------------------+----------------------------------------------------------------
never_married | (base outcome)
--------------------+----------------------------------------------------------------
living_with_partner |
female |
female | .036999 .2187397 0.17 0.868 -.4245014 .4984994
|
dmdborn4 |
born in US | -.568658 .1960396 -2.90 0.010 -.9822654 -.1550506
|
female#dmdborn4 |
female#born in US | .2687737 .292348 0.92 0.371 -.3480266 .885574
|
ridageyr | .0298384 .0096943 3.08 0.007 .0093853 .0502915
_cons | -1.597323 .3927349 -4.07 0.001 -2.425921 -.7687246
-------------------------------------------------------------------------------------
Notice that when we include the interaction term, we do not get an F-statistic or a p-value for the overall model. What happened, and how worried should we be?
The issue is caused by the degrees of freedom. You might think that because we have so many observations in this dataset that we could run a model with many predictors and not run out of degrees of freedom, but that is not the case. A great explanation of the problem can be found in the Stata j_robustsingular help file that you can access by clicking on the blue in the Stata output (if you run this example) or by typing help j_robustsingular in the Stata command window.
The numerator degrees of freedom is determined by the number of constraints (called k); the denominator degrees of freedom is calculated as d-k+1, where d is the number of PSUs minus the number of strata. The value of d is given in top portion of the Stata output and is labeled Design df. We can see from the output that k = 17, but why is it 17 when we have 20 parameters (four 1 df parameters in five equations)? Stata set this value to 17 because it is the maximum number of constraints that could be simultaneously tested. The denominator degrees of freedom is calculated as 17 – 17 + 1 = 1.
Despite not getting an F-statistic for the overall model, the parameters are still estimated correctly. However, we should consider the standard errors. The theory justifying the calculation of the standard errors assumes a large number of clusters minus strata, and we just saw that we are trying to estimate more than we have. If the standard errors are suspect, then so are the test statistics and their p-values.
The upshot of this is that we can have at most 16 constraints across all of the equations, which means three 1 df predictors, because we have five equations (3 X 5 = 15 < 16). Because of this, for purposes of illustration, we will drop the variable ridageyr from our list of predictors, even though it is statistically significant.
svy: mlogit dmdmartl i.female##i.dmdborn4, base(5)(running mlogit on estimation sample) Survey: Multinomial logistic regression Number of strata = 14 Number of obs = 5,549 Number of PSUs = 31 Population size = 223,762,858 Design df = 17 F( 15, 3) = 34.75 Prob > F = 0.0069 ------------------------------------------------------------------------------------- | Linearized dmdmartl | Coef. Std. Err. t P>|t| [95% Conf. Interval] --------------------+---------------------------------------------------------------- married | female | female | .1183387 .1517903 0.78 0.446 -.2019108 .4385883 | dmdborn4 | born in US | -.3006455 .1371932 -2.19 0.043 -.5900978 -.0111932 | female#dmdborn4 | female#born in US | .2041983 .201896 1.01 0.326 -.2217649 .6301615 | _cons | 1.095878 .1270625 8.62 0.000 .8277996 1.363956 --------------------+---------------------------------------------------------------- widowed | female | female | 1.680626 .2781693 6.04 0.000 1.09374 2.267512 | dmdborn4 | born in US | .4168569 .2545828 1.64 0.120 -.1202658 .9539796 | female#dmdborn4 | female#born in US | -.1509306 .3705515 -0.41 0.689 -.9327259 .6308647 | _cons | -2.579307 .2107986 -12.24 0.000 -3.024053 -2.134561 --------------------+---------------------------------------------------------------- divorced | female | female | 1.126068 .3105071 3.63 0.002 .4709557 1.781181 | dmdborn4 | born in US | .9131768 .2837044 3.22 0.005 .3146128 1.511741 | female#dmdborn4 | female#born in US | -.4421007 .3309126 -1.34 0.199 -1.140265 .2560638 | _cons | -1.808367 .2627419 -6.88 0.000 -2.362704 -1.25403 --------------------+---------------------------------------------------------------- separated | female | female | .7256508 .4071373 1.78 0.093 -.1333338 1.584635 | dmdborn4 | born in US | -1.255096 .3453054 -3.63 0.002 -1.983627 -.5265654 | female#dmdborn4 | female#born in US | .026551 .6028027 0.04 0.965 -1.245252 1.298353 | _cons | -1.597227 .2962692 -5.39 0.000 -2.2223 -.9721533 --------------------+---------------------------------------------------------------- never_married | (base outcome) --------------------+---------------------------------------------------------------- living_with_partner | female | female | .0529201 .2216185 0.24 0.814 -.4146541 .5204943 | dmdborn4 | born in US | -.5093796 .1891849 -2.69 0.015 -.9085248 -.1102344 | female#dmdborn4 | female#born in US | .2080791 .2854279 0.73 0.476 -.3941212 .8102795 | _cons | -.5582705 .1787538 -3.12 0.006 -.9354081 -.1811328 -------------------------------------------------------------------------------------
We will use the contrast command to see if the interaction term is statistically significant across all of the equations.
contrast female#dmdborn4
Contrasts of marginal linear predictions
Design df = 17
Margins : asbalanced
---------------------------------------------------
| df F P>F
----------------+----------------------------------
married |
female#dmdborn4 | 1 1.02 0.3260
Design | 17
---------------------------------------------------
Note: F statistics are adjusted for the survey
design.
The p-value is 0.3260, so the interaction term is not statistically significant (at alpha = .05) across all equations. Although the interaction is not statistically significant, we can still use the margins command to have a look at the predicted probabilities. As you can see, the predicted probabilities are very similar within each equation, which is what we expect given that the interaction is not statistically significant.
margins female#dmdborn4, vce(unconditional)
Adjusted predictions Number of obs = 5,549
1._predict : Pr(dmdmartl==married), predict(pr outcome(1))
2._predict : Pr(dmdmartl==widowed), predict(pr outcome(2))
3._predict : Pr(dmdmartl==divorced), predict(pr outcome(3))
4._predict : Pr(dmdmartl==separated), predict(pr outcome(4))
5._predict : Pr(dmdmartl==never_married), predict(pr outcome(5))
6._predict : Pr(dmdmartl==living_with_partner), predict(pr outcome(6))
------------------------------------------------------------------------------------------
| Linearized
| Margin Std. Err. t P>|t| [95% Conf. Interval]
-------------------------+----------------------------------------------------------------
_predict#female#dmdborn4 |
1#male#born elsewhere | .5976192 .022827 26.18 0.000 .5494584 .6457801
1#male#born in US | .5350065 .0271931 19.67 0.000 .477634 .5923789
1#female#born elsewhere | .5343956 .026285 20.33 0.000 .4789391 .5898522
1#female#born in US | .5124434 .0204501 25.06 0.000 .4692973 .5555894
2#male#born elsewhere | .0151465 .0030299 5.00 0.000 .0087539 .0215391
2#male#born in US | .0277878 .0035675 7.79 0.000 .020261 .0353146
2#female#born elsewhere | .0646016 .0089016 7.26 0.000 .0458208 .0833823
2#female#born in US | .0890027 .006891 12.92 0.000 .0744639 .1035414
3#male#born elsewhere | .0327436 .007994 4.10 0.001 .0158778 .0496095
3#male#born in US | .0986774 .0122991 8.02 0.000 .0727287 .1246262
3#female#born elsewhere | .0802078 .0108933 7.36 0.000 .0572251 .1031906
3#female#born in US | .1356663 .0106923 12.69 0.000 .1131075 .1582252
4#male#born elsewhere | .0404412 .0097088 4.17 0.001 .0199574 .060925
4#male#born in US | .0139395 .0032575 4.28 0.001 .0070667 .0208122
4#female#born elsewhere | .0663766 .0121832 5.45 0.000 .0406724 .0920808
4#female#born in US | .0205179 .0045573 4.50 0.000 .0109028 .0301331
5#male#born elsewhere | .1997518 .0200541 9.96 0.000 .1574414 .2420623
5#male#born in US | .2415427 .0305424 7.91 0.000 .1771039 .3059815
5#female#born elsewhere | .1586848 .02753 5.76 0.000 .1006016 .216768
5#female#born in US | .1675733 .0216525 7.74 0.000 .1218906 .213256
6#male#born elsewhere | .1142976 .0148556 7.69 0.000 .0829549 .1456402
6#male#born in US | .0830461 .0073496 11.30 0.000 .0675398 .0985525
6#female#born elsewhere | .0957336 .014004 6.84 0.000 .0661877 .1252795
6#female#born in US | .0747964 .0068146 10.98 0.000 .0604189 .0891739
------------------------------------------------------------------------------------------
marginsplot
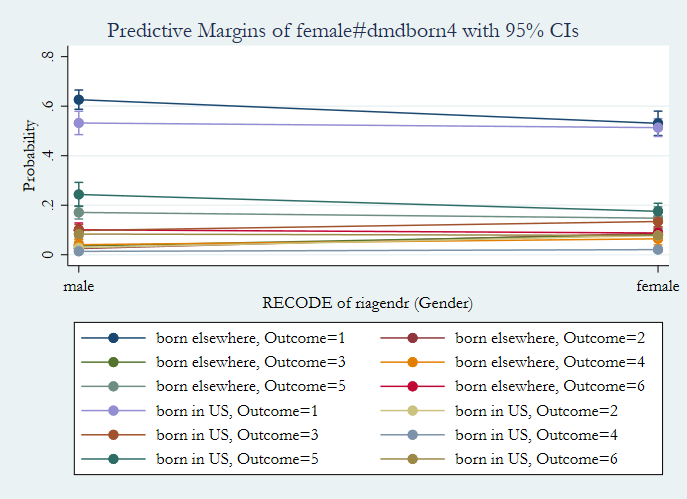
Count Models
Both Poisson and negative binomial models can be used with complex survey data. We will start with a simple Poisson model with a single binary predictor. We will then investigate the plausibility that the conditional variance is approximately equal to the condition mean. For more information regarding Poisson models, please see Stata Data Analysis Examples: Poisson Regression and Stata Annotated Output: Poisson Regression. For more information regarding negative binomial models, please see Stata Data Analysis Examples: Negative Binomial Regression and Stata Annotated Output: Negative Binomial Regression.
* pad675 - How much time do you spend doing moderate-intensity sports, fitness, or recreation activities on a typical day?svy: poisson pad675 i.female (running poisson on estimation sample) Survey: Poisson regression Number of strata = 14 Number of obs = 2,887 Number of PSUs = 31 Population size = 121,973,544 Design df = 17 F( 1, 17) = 53.89 Prob > F = 0.0000 ------------------------------------------------------------------------------ | Linearized pad675 | Coef. Std. Err. t P>|t| [95% Conf. Interval] -------------+---------------------------------------------------------------- female | female | -.2714819 .0369815 -7.34 0.000 -.349506 -.1934579 _cons | 4.34112 .0348709 124.49 0.000 4.267549 4.414692 ------------------------------------------------------------------------------ svy: mean pad675 (running mean on estimation sample) Survey: Mean estimation Number of strata = 14 Number of obs = 2,887 Number of PSUs = 31 Population size = 121,973,544 Design df = 17 -------------------------------------------------------------- | Linearized | Mean Std. Err. [95% Conf. Interval] -------------+------------------------------------------------ pad675 | 67.3715 1.665661 63.85726 70.88574 -------------------------------------------------------------- estat sd ------------------------------------- | Mean Std. Dev. -------------+----------------------- pad675 | 67.3715 59.20373 ------------------------------------- di (59.20373)^2 3505.0816 svy: mean pad675, over(female) (running mean on estimation sample) Survey: Mean estimation Number of strata = 14 Number of obs = 2,887 Number of PSUs = 31 Population size = 121,973,544 Design df = 17 male: female = male female: female = female -------------------------------------------------------------- | Linearized Over | Mean Std. Err. [95% Conf. Interval] -------------+------------------------------------------------ pad675 | male | 76.79352 2.677863 71.14373 82.44332 female | 58.53579 1.326453 55.73722 61.33436 -------------------------------------------------------------- estat sd male: female = male female: female = female ------------------------------------- Over | Mean Std. Dev. -------------+----------------------- pad675 | male | 76.79352 70.07179 female | 58.53579 46.17294 -------------------------------------
It seems that we have overdispersion, which is quite common in count models. Let’s try a negative binomial model. Notice that no test of the alpha parameter being equal to 0 is given, as it is when this analysis is run with unweighted data.
svy: nbreg pad675 i.female
(running nbreg on estimation sample)

Survey: Negative binomial regression

Number of strata   =        14                Number of obs     =        2,887
Number of PSUs     =        31                Population size   =  121,973,544
                                              Design df         =           17
                                              F(   1,     17)   =        53.89
Dispersion         = mean                     Prob > F          =       0.0000

------------------------------------------------------------------------------
             |             Linearized
      pad675 |      Coef.   Std. Err.      t    P>|t|     [95% Conf. Interval]
-------------+----------------------------------------------------------------
      female |
     female  |  -.2714819   .0369815    -7.34   0.000     -.349506   -.1934579
       _cons |    4.34112   .0348709   124.49   0.000     4.267549    4.414692
-------------+----------------------------------------------------------------
    /lnalpha |  -.7208759   .0356206                     -.7960289   -.6457229
-------------+----------------------------------------------------------------
       alpha |   .4863261   .0173232                      .4511169    .5242834
------------------------------------------------------------------------------

margins female, vce(unconditional)

Adjusted predictions                            Number of obs     =      2,887

Expression   : Predicted number of events, predict()

------------------------------------------------------------------------------
             |             Linearized
             |     Margin   Std. Err.      t    P>|t|     [95% Conf. Interval]
-------------+----------------------------------------------------------------
      female |
       male  |   76.79353   2.677863    28.68   0.000     71.14373    82.44333
     female  |    58.5358   1.326453    44.13   0.000     55.73722    61.33437
------------------------------------------------------------------------------
Let’s try including an interaction between female and age (ridageyr).
svy: nbreg pad675 i.female##c.ridageyr
(running nbreg on estimation sample)

Survey: Negative binomial regression

Number of strata   =        14                Number of obs     =        2,887
Number of PSUs     =        31                Population size   =  121,973,544
                                              Design df         =           17
                                              F(   3,     15)   =        17.61
Dispersion         = mean                     Prob > F          =       0.0000

-----------------------------------------------------------------------------------
                  |             Linearized
           pad675 |      Coef.   Std. Err.      t    P>|t|     [95% Conf. Interval]
------------------+----------------------------------------------------------------
           female |
          female  |  -.2455241   .1069486    -2.30   0.035    -.4711659   -.0198824
         ridageyr |  -.0001887   .0023006    -0.08   0.936    -.0050424    .0046651
                  |
female#c.ridageyr |
          female  |  -.0006187   .0026713    -0.23   0.820    -.0062547    .0050173
                  |
            _cons |    4.34873   .0895025    48.59   0.000     4.159896    4.537563
------------------+----------------------------------------------------------------
         /lnalpha |  -.7210909    .035793                     -.7966074   -.6455743
------------------+----------------------------------------------------------------
            alpha |   .4862216   .0174033                      .4508559    .5243613
-----------------------------------------------------------------------------------
Although the interaction term is not statistically significant, we can still use the margins command to get the predicted counts.
margins female, at(ridageyr=(20(10)60)) vce(unconditional)

Adjusted predictions                            Number of obs     =      2,887

Expression   : Predicted number of events, predict()

1._at        : ridageyr        =          20

2._at        : ridageyr        =          30

3._at        : ridageyr        =          40

4._at        : ridageyr        =          50

5._at        : ridageyr        =          60

------------------------------------------------------------------------------
             |             Linearized
             |     Margin   Std. Err.      t    P>|t|     [95% Conf. Interval]
-------------+----------------------------------------------------------------
  _at#female |
     1#male  |   77.08864   3.846604    20.04   0.000     68.97301    85.20426
   1#female  |   59.56436    2.47305    24.09   0.000     54.34668    64.78204
     2#male  |   76.94332   2.792532    27.55   0.000     71.05159    82.83504
   2#female  |   59.08537   1.781162    33.17   0.000     55.32745    62.84329
     3#male  |   76.79827   2.663778    28.83   0.000     71.17819    82.41835
   3#female  |   58.61023   1.362563    43.01   0.000     55.73548    61.48499
     4#male  |    76.6535   3.552176    21.58   0.000     69.15906    84.14793
   4#female  |   58.13892   1.446417    40.20   0.000     55.08724    61.19059
     5#male  |     76.509   4.928961    15.52   0.000      66.1098     86.9082
   5#female  |   57.67139   1.950799    29.56   0.000     53.55557    61.78722
------------------------------------------------------------------------------

marginsplot // two parallel lines
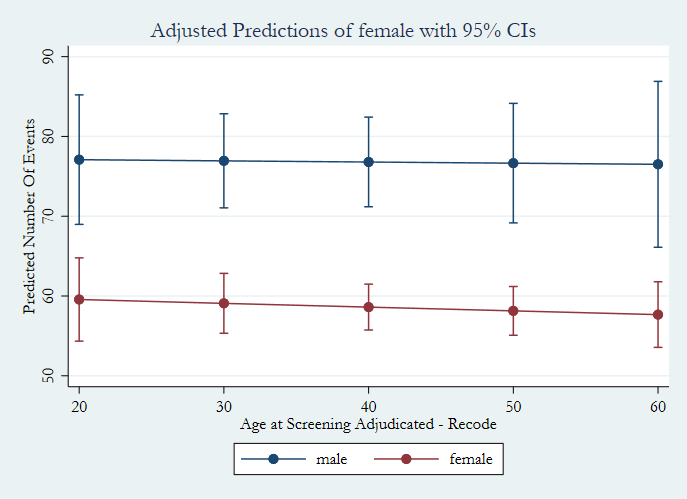
For more information on using the NHANES data sets
There are helpful resources for learning how to analyze the NHANES data sets correctly. One is a listserv at
http://www.cdc.gov/nchs/nhanes/nhanes_listserv.htm . There are
also online tutorials at
http://www.cdc.gov/nchs/tutorials/index.htm .
References
Applied Survey Data Analysis, Second Edition by Steven G. Heeringa, Brady T. West, and Patricia A. Berglund
A survey
of survey statistics: What is done and can be done in Stata by Frauke
Kreuter and Richard Valliant, The Stata Journal (2007), Volume 7,
Number 1, pages 1-21.
Goodness-of-fit test for a logistic regression model fitted using survey sample
data by Kellie J. Archer and Stanley Lemeshow, The Stata Journal (2006),
Volume 6, Number 1, pages 97-105.
Analysis of Health Surveys by
Edward L. Korn and Barry I. Graubard
Sampling of Populations: Methods
and Applications, Fourth Edition by Paul Levy and Stanley Lemeshow
Analysis of Survey Data Edited by R. L. Chambers and C. J. Skinner
Sampling Techniques, Third Edition by William G. Cochran
Stata 15 Manual: Survey Data
StatNews #73: Overlapping Confidence Intervals and Statistical Significance, October 2008 by the Cornell Statistical Consulting Unit
Why Overlapping Confidence Intervals Mean Nothing about Statistical Significance