
In previous sections we have shown how to estimate two types of measurement
models, confirmatory factor models, and mixture models (e.g., latent class
analysis). We have also shown how to estimate a path model, where relationships
among observed variables are modeled. Structural equation models combine the
two, using regression paths to estimate a model with a specific set of
relationships among latent variables. Structural equation models typically imposes
restrictions on the relationships between the latent variables, that is, only a subset of
the possible paths between the latent variables are included.
Mplus version 5.2 was used for these examples.
1.0 A Structural Equation Model
The following model continues from the example introduced in the
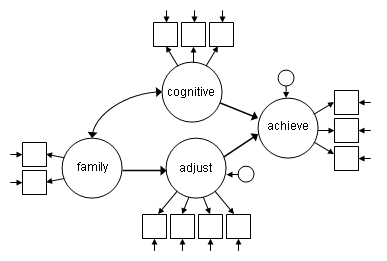
confirmatory factor analysis page. The diagram
below shows the model to be tested. Unlike a confirmatory factor
analysis (CFA) model where all of the latent variables are allowed to covary,
this model specifies a set of relationships among the latent variables some
of these relationships are directional (i.e., regression paths) and some are
not (i.e., covariances). The model also specifies that any covariance between
cognitive and
adjust is entirely through their relationships with other variables in
the model.
In the model: command we use the keyword by to define the four latent
variables as we did in the CFA. Below that the keyword on is used to specify that we want to predict
achieve using cognitive and adjust (i.e., achieve on cog adjust;). The model also
predicts adjust using family (adjust on family;). Notice
that the model:
command does not include a covariance between family and cognitive (i.e.,
family with cog;),
although we could include this command, it is not necessary, as Mplus will
include this covariance by default.
Title: A structural equation model
Data:
  File is worland_data.dat ;
Variable:
  Names are ppsych ses verbal vissp mem read arith spell motiv extra harm stabi;
Model:
  family by ppsych ses;
  cog by verbal vissp mem;
  achieve by read arith spell;
  adjust by motiv extra harm stabi;

  achieve on cog adjust;
  adjust on family;
The abridged output for the above model is shown below.
<output omitted>

TESTS OF MODEL FIT

Chi-Square Test of Model Fit

          Value                            635.015
          Degrees of Freedom                    50
          P-Value                           0.0000

Chi-Square Test of Model Fit for the Baseline Model

          Value                           4124.707
          Degrees of Freedom                    66
          P-Value                           0.0000

CFI/TLI

          CFI                                0.856
          TLI                                0.810

Loglikelihood

          H0 Value                       -6762.779
          H1 Value                       -6445.272

Information Criteria

          Number of Free Parameters             40
          Akaike (AIC)                   13605.559
          Bayesian (BIC)                 13774.143
          Sample-Size Adjusted BIC       13647.180
            (n* = (n + 2) / 24)

RMSEA (Root Mean Square Error Of Approximation)

          Estimate                           0.153
          90 Percent C.I.                    0.142  0.164
          Probability RMSEA <= .05           0.000

SRMR (Standardized Root Mean Square Residual)

          Value                              0.067


MODEL RESULTS

                                                    Two-Tailed
                    Estimate       S.E.  Est./S.E.    P-Value

 FAMILY   BY
    PPSYCH             1.000      0.000    999.000    999.000
    SES               -1.093      0.121     -9.055      0.000

 COG      BY
    VERBAL             1.000      0.000    999.000    999.000
    VISSP              0.844      0.045     18.772      0.000
    MEM                0.969      0.044     21.798      0.000

 ACHIEVE  BY
    READ               1.000      0.000    999.000    999.000
    ARITH              0.836      0.034     24.715      0.000
    SPELL              0.951      0.027     35.681      0.000

 ADJUST   BY
    MOTIV              1.000      0.000    999.000    999.000
    EXTRA              0.232      0.049      4.750      0.000
    HARM               0.867      0.043     20.248      0.000
    STABI              0.669      0.045     14.697      0.000

 ACHIEVE  ON
    COG                0.892      0.050     17.692      0.000
    ADJUST             0.139      0.040      3.485      0.000

 ADJUST   ON
    FAMILY            -1.183      0.135     -8.783      0.000

 COG      WITH
    FAMILY            -0.412      0.046     -9.019      0.000

 Intercepts
    PPSYCH             0.000      0.045      0.000      1.000
    SES                0.000      0.045      0.000      1.000
    VERBAL             0.000      0.045      0.000      1.000
    VISSP              0.000      0.045      0.000      1.000
    MEM                0.000      0.045      0.000      1.000
    READ               0.000      0.045      0.000      1.000
    ARITH              0.000      0.045      0.000      1.000
    SPELL              0.000      0.045      0.000      1.000
    MOTIV              0.000      0.045      0.000      1.000
    EXTRA              0.000      0.045      0.000      1.000
    HARM               0.000      0.045      0.000      1.000
    STABI              0.000      0.045      0.000      1.000

 Variances
    FAMILY             0.252      0.049      5.119      0.000
    COG                0.745      0.064     11.668      0.000

 Residual Variances
    PPSYCH             0.746      0.054     13.883      0.000
    SES                0.697      0.052     13.467      0.000
    VERBAL             0.253      0.025     10.255      0.000
    VISSP              0.467      0.034     13.626      0.000
    MEM                0.299      0.027     11.143      0.000
    READ               0.096      0.014      6.855      0.000
    ARITH              0.367      0.027     13.676      0.000
    SPELL              0.183      0.016     11.458      0.000
    MOTIV              0.107      0.032      3.346      0.001
    EXTRA              0.950      0.061     15.700      0.000
    HARM               0.328      0.033     10.039      0.000
    STABI              0.600      0.042     14.252      0.000
    ACHIEVE            0.170      0.022      7.845      0.000
    ADJUST             0.539      0.053     10.170      0.000


QUALITY OF NUMERICAL RESULTS

     Condition Number for the Information Matrix              0.316E-02
       (ratio of smallest to largest eigenvalue)
In the output above in the MODEL RESULTS section, we first see
the measurement portion of the model where the four latent variables are
defined. The next section shows the structural portion of the model
predicting achieve (ACHIEVE ON) and adjust (ADJUST ON). The
coefficients shown under ACHIEVE ON are the coefficients from the latent
variable achieve regressed on the latent variables cog and
adjust, and can be interpreted as regression coefficients. The standard
errors, the ratio of the coefficient to its standard error (i.e., a t- or
z-value), and a p-value are also given for each structural coefficient. Below the
regression results is the estimate of the covariance between the exogenous
latent variables cog and family. The rest of the output is
similar to the output for the measurement model except that rather than
having a variance (listed under Variances) achieve and adjust
now have residual variances (listed under Residual Variances) because they
are being predicted by other variables in the model.
2.0 Including an Observed Variable in the Structural Model
It is possible to include observed variables in the structural
portion of the model. In the earlier models, the observed
variables ses and ppsych, were used to estimate the latent
variable family. In the current model the variable ses is removed
from the model entirely, and the variable ppsych remains as a single
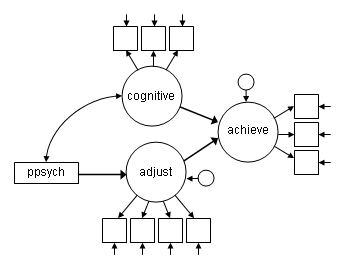
observed variable predicting the latent variable adjust. The diagram below
shows this model.
Removing ses from the model, and including ppsych as an observed variable
requires three relatively small changes to the model. The first is that we have added
the usevariables option in the variables: command, by default Mplus includes all variables in
the dataset in the model.
(Note that the names option tells Mplus the number, names, and order of the
variables in the dataset, so we do not want to make any changes to it.) The usevariables option allows us to tell Mplus that we want to use a subset of the variables
in our file. Since we only want to exclude ses, the usevariables
option is followed by the names of all the variables in our dataset except ses. The second change is that we have removed
the line in the model: command that was used to define the
latent variable family because we no longer want to estimate that latent
variable. The final change is that we now use ppsych to predict adjust (i.e.,
adjust on ppsych;)
Title: Adding an observed variable in the structural model;
Data:
  File is worland_data.dat ;
Variable:
  Names are ppsych ses verbal vissp mem read arith spell motiv extra harm stabi;
  Usevariables are ppsych verbal vissp mem read arith spell motiv extra harm stabi;
Model:
  cog by verbal vissp mem;
  achieve by read arith spell;
  adjust by motiv extra harm stabi;

  achieve on cog adjust;
  adjust on ppsych;
The output for this model is shown below.
<output omitted>

TESTS OF MODEL FIT

Chi-Square Test of Model Fit

          Value                            729.459
          Degrees of Freedom                    41
          P-Value                           0.0000

Chi-Square Test of Model Fit for the Baseline Model

          Value                           3929.228
          Degrees of Freedom                    55
          P-Value                           0.0000

CFI/TLI

          CFI                                0.822
          TLI                                0.762

Loglikelihood

          H0 Value                       -6198.772
          H1 Value                       -5834.042

Information Criteria

          Number of Free Parameters             34
          Akaike (AIC)                   12465.544
          Bayesian (BIC)                 12608.841
          Sample-Size Adjusted BIC       12500.923
            (n* = (n + 2) / 24)

RMSEA (Root Mean Square Error Of Approximation)

          Estimate                           0.183
          90 Percent C.I.                    0.172  0.195
          Probability RMSEA <= .05           0.000

SRMR (Standardized Root Mean Square Residual)

          Value                              0.153


MODEL RESULTS

                                                    Two-Tailed
                    Estimate       S.E.  Est./S.E.    P-Value

 COG      BY
    VERBAL             1.000      0.000    999.000    999.000
    VISSP              0.865      0.046     18.821      0.000
    MEM                0.963      0.046     20.863      0.000

 ACHIEVE  BY
    READ               1.000      0.000    999.000    999.000
    ARITH              0.836      0.034     24.686      0.000
    SPELL              0.952      0.027     35.669      0.000

 ADJUST   BY
    MOTIV              1.000      0.000    999.000    999.000
    EXTRA              0.222      0.051      4.392      0.000
    HARM               0.898      0.052     17.390      0.000
    STABI              0.688      0.049     13.929      0.000

 ACHIEVE  ON
    COG                0.859      0.046     18.691      0.000
    ADJUST             0.216      0.035      6.116      0.000

 ADJUST   ON
    PPSYCH            -0.254      0.042     -6.008      0.000

 PPSYCH   WITH
    COG               -0.396      0.038    -10.362      0.000

 Intercepts
    VERBAL             0.000      0.041      0.000      1.000
    VISSP              0.000      0.042      0.000      1.000
    MEM                0.000      0.041      0.000      1.000
    READ               0.000      0.038      0.000      1.000
    ARITH              0.000      0.040      0.000      1.000
    SPELL              0.000      0.039      0.000      1.000
    MOTIV              0.000      0.043      0.000      1.000
    EXTRA              0.000      0.045      0.000      1.000
    HARM               0.000      0.043      0.000      1.000
    STABI              0.000      0.044      0.000      1.000

 Variances
    COG                0.738      0.063     11.628      0.000

 Residual Variances
    VERBAL             0.260      0.026      9.912      0.000
    VISSP              0.445      0.034     13.157      0.000
    MEM                0.313      0.029     10.965      0.000
    READ               0.097      0.014      6.852      0.000
    ARITH              0.368      0.027     13.703      0.000
    SPELL              0.181      0.016     11.385      0.000
    MOTIV              0.136      0.041      3.323      0.001
    EXTRA              0.955      0.061     15.671      0.000
    HARM               0.303      0.039      7.826      0.000
    STABI              0.589      0.043     13.851      0.000
    ACHIEVE            0.170      0.022      7.740      0.000
    ADJUST             0.798      0.070     11.388      0.000


QUALITY OF NUMERICAL RESULTS

     Condition Number for the Information Matrix              0.145E-01
       (ratio of smallest to largest eigenvalue)
The MODEL RESULTS section begins with the three (instead of four)
latent variables in the model. In the structural (ON) portion of the
output the coefficient for adjust regressed on ppsych is
presented in the output the same way the coefficients for the latent
predictor variables are reported. Below that,
the covariance between ppsych and cog is shown under the
heading PPSYCH WITH. The rest of the output is similar to the previous
models.You may have noticed that the mean and variance of ppsych are not
included in the output, either on their own or as an intercept (mean) and
residual variance. While Mplus estimates the covariance between the
observed variable ppsych and the latent variable cog by
default, it does not estimate the mean and variance of exogenous observed
variables by default (the variances of latent exogenous variables are
estimated by default). Explicitly including the covariance of ppsych
and cog (ppsych with cog;), the mean of ppsych ([ppsych];),
or the variance of ppsych (ppsych;) in the model:
command will cause the mean and variance of ppsych to be estimated
and included in the output. Note that the parameter estimates, as well as
many fit indices (including the chi-square) and degrees of freedom will be the same with regardless of
whether the mean and variance of ppsych are estimated, because the
models are essentially the same. The one difference is that the the number
of estimated parameters increases by two, this does not change the degrees
of freedom though, because two additional pieces of information are included
in the model which offsets the additional two parameters being estimated.
Because the number of parameters being estimated changes, measures of model
fit that are are calculated based on the number of estimated parameters, for
example, AIC and BIC, will be different.
3.0 Additional Output
Above we have shown only the default output for each model, but a range of additional
output can be requested using the Output: command. Below we show a few commonly used output
options.
Sample Statistics
The input below is the same as the input for our first model except for the addition
of the output: command. We use the sampstat; option to request that
sample statistics (observed variable means, covariances and correlations) be included
in the output.
Title:
Data:
  File is worland_data.dat ;
Variable:
  Names are
     ppsych ses verbal vissp mem read arith spell motiv extra harm stabi;
Model:
family by ppsych ses;
cog by verbal vissp  mem;
achieve by read arith spell;
adjust by motiv extra harm stabi;

achieve on cog adjust;
adjust on family;

Output:
  sampstat;
Below we show the additional output provided by the sampstat; option
(all other output has been omitted to save space). The "sample statistics" section shown below
appears towards the top of the output file, after the "summary of analysis" and
before the "tests of model fit".
     SAMPLE STATISTICS


           Means
              PPSYCH        SES           VERBAL        VISSP         MEM
              ________      ________      ________      ________      ________
      1         0.000         0.000         0.000         0.000         0.000


           Means
              READ          ARITH         SPELL         MOTIV         EXTRA
              ________      ________      ________      ________      ________
      1         0.000         0.000         0.000         0.000         0.000


           Means
              HARM          STABI
              ________      ________
      1         0.000         0.000


           Covariances
              PPSYCH        SES           VERBAL        VISSP         MEM
              ________      ________      ________      ________      ________
 PPSYCH         0.998
 SES           -0.419         0.998
 VERBAL        -0.429         0.499         0.998
 VISSP         -0.399         0.399         0.659         0.998
 MEM           -0.349         0.379         0.669         0.659         0.998
 READ          -0.389         0.429         0.778         0.559         0.729
 ARITH         -0.240         0.369         0.689         0.489         0.699
 SPELL         -0.309         0.329         0.629         0.479         0.719
 MOTIV         -0.250         0.249         0.489         0.319         0.579
 EXTRA         -0.140         0.170         0.180         0.090         0.170
 HARM          -0.249         0.259         0.419         0.249         0.459
 STABI         -0.160         0.180         0.329         0.269         0.349


           Covariances
              READ          ARITH         SPELL         MOTIV         EXTRA
              ________      ________      ________      ________      ________
 READ           0.998
 ARITH          0.729         0.998
 SPELL          0.868         0.719         0.998
 MOTIV          0.529         0.599         0.589         0.998
 EXTRA          0.140         0.150         0.150         0.249         0.998
 HARM           0.419         0.439         0.449         0.768         0.190
 STABI          0.359         0.379         0.379         0.589        -0.289


           Covariances
              HARM          STABI
              ________      ________
 HARM           0.998
 STABI          0.579         0.998


           Correlations
              PPSYCH        SES           VERBAL        VISSP         MEM
              ________      ________      ________      ________      ________
 PPSYCH         1.000
 SES           -0.420         1.000
 VERBAL        -0.430         0.500         1.000
 VISSP         -0.400         0.400         0.660         1.000
 MEM           -0.350         0.380         0.670         0.660         1.000
 READ          -0.390         0.430         0.780         0.560         0.730
 ARITH         -0.240         0.370         0.690         0.490         0.700
 SPELL         -0.310         0.330         0.630         0.480         0.720
 MOTIV         -0.250         0.250         0.490         0.320         0.580
 EXTRA         -0.140         0.170         0.180         0.090         0.170
 HARM          -0.250         0.260         0.420         0.250         0.460
 STABI         -0.160         0.180         0.330         0.270         0.350


           Correlations
              READ          ARITH         SPELL         MOTIV         EXTRA
              ________      ________      ________      ________      ________
 READ           1.000
 ARITH          0.730         1.000
 SPELL          0.870         0.720         1.000
 MOTIV          0.530         0.600         0.590         1.000
 EXTRA          0.140         0.150         0.150         0.250         1.000
 HARM           0.420         0.440         0.450         0.770         0.190
 STABI          0.360         0.380         0.380         0.590        -0.290


           Correlations
              HARM          STABI
              ________      ________
 HARM           1.000
 STABI          0.580         1.000
Standardized Coefficients
Standardized coefficients, and, with some models, R2, can be
obtained using the standardize option of the output: command.
Mplus actually produces three forms of standardized coefficients, labeled, stdyx, stdy,
and std. Using the standardize option requests all three, using these names
as options one allows the user to request that only one (or two) sets of
standardized estimates be printed.
Below the output: command, is shown, the input file is otherwise
unchanged.
Output:
  standardize;
or
Output:
  stdyx;
The abridged output (using standardize;) is shown below.
<output omitted>

MODEL RESULTS

                                                    Two-Tailed
                    Estimate       S.E.  Est./S.E.    P-Value

 FAMILY   BY
    PPSYCH             1.000      0.000    999.000    999.000
    SES               -1.093      0.121     -9.055      0.000

 COG      BY
    VERBAL             1.000      0.000    999.000    999.000
    VISSP              0.844      0.045     18.772      0.000
    MEM                0.969      0.044     21.798      0.000

<output omitted>

STANDARDIZED MODEL RESULTS


STDYX Standardization

                                                    Two-Tailed
                    Estimate       S.E.  Est./S.E.    P-Value

 FAMILY   BY
    PPSYCH             0.502      0.042     11.913      0.000
    SES               -0.549      0.040    -13.780      0.000

 COG      BY
    VERBAL             0.864      0.016     55.059      0.000
    VISSP              0.729      0.024     30.279      0.000
    MEM                0.837      0.018     47.624      0.000

 ACHIEVE  BY
    READ               0.950      0.008    119.262      0.000
    ARITH              0.795      0.019     42.875      0.000
    SPELL              0.904      0.010     88.541      0.000

 ADJUST   BY
    MOTIV              0.945      0.017     54.667      0.000
    EXTRA              0.219      0.046      4.798      0.000
    HARM               0.819      0.021     38.479      0.000
    STABI              0.632      0.031     20.700      0.000

 ACHIEVE  ON
    COG                0.811      0.032     25.571      0.000
    ADJUST             0.138      0.040      3.454      0.001

 ADJUST   ON
    FAMILY            -0.629      0.036    -17.328      0.000

 COG      WITH
    FAMILY            -0.950      0.035    -26.824      0.000

 Intercepts
    PPSYCH             0.000      0.045      0.000      1.000
    SES                0.000      0.045      0.000      1.000
    VERBAL             0.000      0.045      0.000      1.000
    VISSP              0.000      0.045      0.000      1.000
    MEM                0.000      0.045      0.000      1.000
    READ               0.000      0.045      0.000      1.000
    ARITH              0.000      0.045      0.000      1.000
    SPELL              0.000      0.045      0.000      1.000
    MOTIV              0.000      0.045      0.000      1.000
    EXTRA              0.000      0.045      0.000      1.000
    HARM               0.000      0.045      0.000      1.000
    STABI              0.000      0.045      0.000      1.000

 Variances
    FAMILY             1.000      0.000    999.000    999.000
    COG                1.000      0.000    999.000    999.000

 Residual Variances
    PPSYCH             0.748      0.042     17.663      0.000
    SES                0.698      0.044     15.959      0.000
    VERBAL             0.253      0.027      9.331      0.000
    VISSP              0.468      0.035     13.312      0.000
    MEM                0.299      0.029     10.175      0.000
    READ               0.097      0.015      6.385      0.000
    ARITH              0.368      0.029     12.509      0.000
    SPELL              0.183      0.018      9.929      0.000
    MOTIV              0.107      0.033      3.289      0.001
    EXTRA              0.952      0.020     47.669      0.000
    HARM               0.328      0.035      9.410      0.000
    STABI              0.601      0.039     15.588      0.000
    ACHIEVE            0.189      0.025      7.645      0.000
    ADJUST             0.605      0.046     13.249      0.000


STDY Standardization

                                                    Two-Tailed
                    Estimate       S.E.  Est./S.E.    P-Value

 FAMILY   BY
    PPSYCH             0.502      0.042     11.913      0.000
    SES               -0.549      0.040    -13.780      0.000

 COG      BY
    VERBAL             0.864      0.016     55.059      0.000
    VISSP              0.729      0.024     30.279      0.000
    MEM                0.837      0.018     47.624      0.000

<output omitted>

STD Standardization

                                                    Two-Tailed
                    Estimate       S.E.  Est./S.E.    P-Value

 FAMILY   BY
    PPSYCH             0.502      0.049     10.238      0.000
    SES               -0.549      0.048    -11.423      0.000

 COG      BY
    VERBAL             0.863      0.037     23.337      0.000
    VISSP              0.729      0.040     18.177      0.000
    MEM                0.836      0.038     22.142      0.000

<output omitted>

R-SQUARE

    Observed                                        Two-Tailed
    Variable        Estimate       S.E.  Est./S.E.    P-Value

    PPSYCH             0.252      0.042      5.957      0.000
    SES                0.302      0.044      6.890      0.000
    VERBAL             0.747      0.027     27.529      0.000
    VISSP              0.532      0.035     15.139      0.000
    MEM                0.701      0.029     23.812      0.000
    READ               0.903      0.015     59.631      0.000
    ARITH              0.632      0.029     21.438      0.000
    SPELL              0.817      0.018     44.271      0.000
    MOTIV              0.893      0.033     27.333      0.000
    EXTRA              0.048      0.020      2.399      0.016
    HARM               0.672      0.035     19.240      0.000
    STABI              0.399      0.039     10.350      0.000

     Latent                                         Two-Tailed
    Variable        Estimate       S.E.  Est./S.E.    P-Value

    ACHIEVE            0.811      0.025     32.837      0.000
    ADJUST             0.395      0.046      8.664      0.000
Modification Indices
It is necessary for every model makes certain assumptions, one common
assumption is that a parameter is equal to a given value, often zero (e.g.
saying there is no direct relationship between two variables). Modification
indices can be used to help evaluate how reasonable these assumptions are by
giving the researcher a sense of what happens when those assumptions are
relaxed. Modification indices can be obtained using the modinces; option of the Output: command.
Below we show only the Output: command, the input file remains
otherwise unchanged. By default Mplus prints only those parameters with an MI
greater than or equal to 10, other values can be requested by following the
option name with a number in parentheses, for example, to get all parameters
with an MI greater
than or equal to 3.6, the option should read modindices(3.6);.
Output:
  modindices;
The modification indices are printed at the bottom of the output.
The abridged output is shown below.
<output omitted>

QUALITY OF NUMERICAL RESULTS

     Condition Number for the Information Matrix              0.316E-02
       (ratio of smallest to largest eigenvalue)


MODEL MODIFICATION INDICES

NOTE:  Modification indices for direct effects of observed dependent variables
regressed on covariates may not be included.  To include these, request
MODINDICES (ALL).

Minimum M.I. value for printing the modification index    10.000

                            M.I.     E.P.C.  Std E.P.C.  StdYX E.P.C.

BY Statements

FAMILY   BY ARITH          25.687    -0.950     -0.476       -0.477
FAMILY   BY SPELL          55.846     1.362      0.683        0.684
COG      BY READ           12.217     0.389      0.336        0.337
COG      BY ARITH          25.970     0.557      0.481        0.482
COG      BY SPELL          60.405    -0.816     -0.704       -0.706
ACHIEVE  BY PPSYCH         10.715     0.426      0.404        0.405
ACHIEVE  BY VISSP          53.043    -0.863     -0.819       -0.820
ACHIEVE  BY MEM            41.806     0.800      0.759        0.759
ADJUST   BY VISSP          21.663    -0.230     -0.217       -0.217
ADJUST   BY MEM            35.433     0.270      0.255        0.255
ADJUST   BY READ           43.017    -0.225     -0.212       -0.213
ADJUST   BY ARITH          30.444     0.236      0.223        0.223

ON/BY Statements

FAMILY   ON ACHIEVE  /
ACHIEVE  BY FAMILY         15.997     0.389      0.735        0.735
FAMILY   ON ADJUST   /
ADJUST   BY FAMILY         28.828     0.419      0.787        0.787
COG      ON ACHIEVE  /
ACHIEVE  BY COG            16.642     0.715      0.786        0.786
COG      ON ADJUST   /
ADJUST   BY COG            28.829     0.684      0.748        0.748
ACHIEVE  ON FAMILY   /
FAMILY   BY ACHIEVE        10.038     2.206      1.166        1.166
ADJUST   ON COG      /
COG      BY ADJUST         28.828     5.082      4.649        4.649
ADJUST   ON ACHIEVE  /
ACHIEVE  BY ADJUST         36.036     5.334      5.362        5.362

WITH Statements

SES      WITH PPSYCH       28.832    -0.208     -0.208       -0.289
VERBAL   WITH SES          11.339     0.081      0.081        0.192
MEM      WITH SES          10.444    -0.080     -0.080       -0.175
MEM      WITH VERBAL       65.436    -0.185     -0.185       -0.675
MEM      WITH VISSP        15.179     0.086      0.086        0.230
READ     WITH VERBAL       48.870     0.088      0.088        0.564
READ     WITH MEM          17.207    -0.054     -0.054       -0.316
ARITH    WITH PPSYCH       16.778     0.103      0.103        0.197
ARITH    WITH MEM          13.463     0.065      0.065        0.196
ARITH    WITH READ         35.998    -0.100     -0.100       -0.531
SPELL    WITH SES          12.813    -0.068     -0.068       -0.190
SPELL    WITH VERBAL       60.337    -0.105     -0.105       -0.489
SPELL    WITH MEM          26.201     0.072      0.072        0.307
SPELL    WITH READ         44.080     0.143      0.143        1.080
MOTIV    WITH SES          10.621    -0.074     -0.074       -0.272
MOTIV    WITH MEM          19.099     0.069      0.069        0.385
MOTIV    WITH READ         18.151    -0.048     -0.048       -0.475
MOTIV    WITH ARITH        24.267     0.078      0.078        0.395
MOTIV    WITH SPELL        12.809     0.044      0.044        0.317
EXTRA    WITH MOTIV        33.374     0.158      0.158        0.494
HARM     WITH MOTIV        11.320    -0.188     -0.188       -1.004
STABI    WITH EXTRA       171.609    -0.458     -0.458       -0.606
STABI    WITH HARM         20.922     0.132      0.132        0.298
ACHIEVE  WITH FAMILY       10.039     0.054      0.261        0.261
ACHIEVE  WITH COG          10.039     0.098      0.275        0.275
ADJUST   WITH FAMILY       28.829     0.225      0.612        0.612
ADJUST   WITH COG          28.829     0.369      0.582        0.582
ADJUST   WITH ACHIEVE      10.028     1.004      3.317        3.317
Data Source
The data for these examples is based on a correlation matrix published
in Worland et al. (1984). Although the correlation matrix would have been
sufficient to specify these models, 500 cases were randomly drawn from the
distribution described by the published correlation matrix. The models below
do not necessarily match those specified in Worland et al. (1984), they are
intended as examples only.
Worland, Julien, David G. Weeks, Cynthia L. Janes, and Barbara D. Strock (1984)
Intelligence, classroom behavior, and academic achievement in children at high
and low risk for psychopathology: A structural equation analysis. Journal of Abnormal Child Psychology
Vol. 12, No. 3, pp. 437-454.