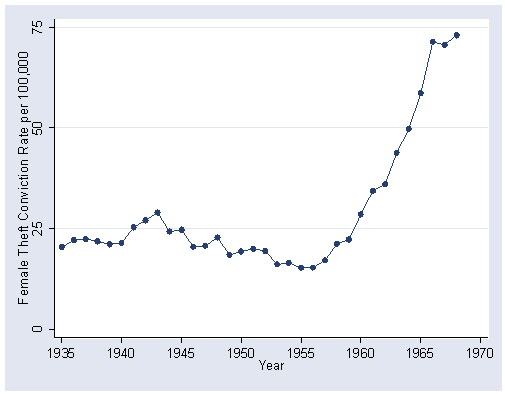
Figure 14.3 on page 380 using data file hartnagl. We use the in option with the use command to omit the first five observations with missing values.
use https://stats.idre.ucla.edu/stat/stata/examples/ara/hartnagl in 5/l, clear
(From Fox, Applied Regression Analysis.  Use 'notes' command for source of data)

graph twoway scatter ftheft year, connect(l) ylabel(0(25)75) xlabel(1935(5)1970)
OLS column of table 14.1 on page 380.
regress  ftheft fertil labor postsec  mtheft

  Source |       SS       df       MS                  Number of obs =      34
---------+------------------------------               F(  4,    29) =  146.98
   Model |  8545.52157     4  2136.38039               Prob > F      =  0.0000
Residual |  421.508959    29  14.5347917               R-squared     =  0.9530
---------+------------------------------               Adj R-squared =  0.9465
   Total |  8967.03053    33  271.728198               Root MSE      =  3.8125

------------------------------------------------------------------------------
  ftheft |      Coef.   Std. Err.       t     P>|t|       [95% Conf. Interval]
---------+--------------------------------------------------------------------
  fertil |  -.0060904   .0014495     -4.202   0.000      -.0090549   -.0031258
   labor |   .1199416   .0234097      5.124   0.000       .0720633    .1678198
 postsec |   .5515575   .0432509     12.753   0.000       .4630995    .6400156
  mtheft |   .0393248   .0185559      2.119   0.043       .0013738    .0772758
   _cons |  -7.334148   9.437921     -0.777   0.443      -26.63686    11.96857
------------------------------------------------------------------------------
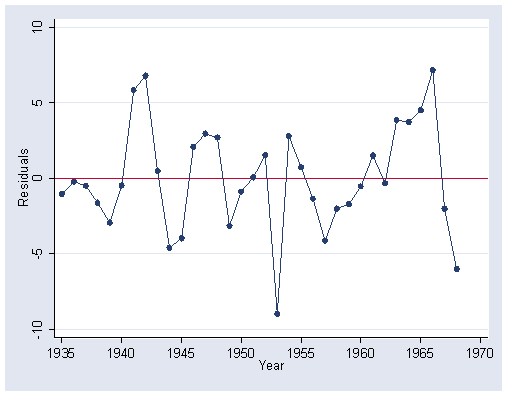
Figure 14.4 on page 381 on residuals from the above OLS regression.
predict r, res
graph twoway scatter r year, connect(l) yline(0) ylabel(-10(5)10) xlabel(1935(5)1970)
Continuing table 14.1, page 380: EGLS(1).
tsset year

        time variable:  year, 1935 to 1968

corrgram r, lags(1) /*get lag-one autocorrelation of the residuals*/

                                          -1       0       1 -1       0       1

 LAG       AC       PAC      Q     Prob>Q  [Autocorrelation]  [Partial Autocor]
-------------------------------------------------------------------------------
1        0.2442   0.2673   2.2118  0.1370          |-                 |--

gen fth1=ftheft-0.244*ftheft[_n-1] /*using transformation on page 378*/
gen fer1=fertil-0.244*fertil[_n-1]
gen lab1 =labor-0.244*labor[_n-1]
gen pos1 = postsec-0.244*postsec[_n-1]
gen mth1 =mtheft-0.244*mtheft[_n-1]
(1 missing value generated in each of the above command.)

gen cons = .756
replace fth1 = sqrt(1-.244*.244)*ftheft if(_n ==1)
replace fer1 = sqrt(1-.244*.244)*fertil if (_n==1)
replace lab1 = sqrt(1-.244*.244)*labor if(_n==1)
replace pos1 = sqrt(1-.244*.244)*postsec if(_n==1)
replace mth1 = sqrt(1-.244*.244)*mtheft if(_n==1)
replace cons = sqrt(1-.244*.244) if(_n==1)
(1 real change made in each of the above command.)

regress fth1  cons  fer1  lab1  pos1 mth1, noco

  Source |       SS       df       MS                  Number of obs =      34
---------+------------------------------               F(  5,    29) =  333.75
   Model |   22417.159     5  4483.43181               Prob > F      =  0.0000
Residual |  389.566176    29  13.4333164               R-squared     =  0.9829
---------+------------------------------               Adj R-squared =  0.9800
   Total |  22806.7252    34  670.786035               Root MSE      =  3.6651

------------------------------------------------------------------------------
    fth1 |      Coef.   Std. Err.       t     P>|t|       [95% Conf. Interval]
---------+--------------------------------------------------------------------
    cons |   -6.64294   11.12007     -0.597   0.555      -29.38604    16.10016
    fer1 |  -.0058795    .001779     -3.305   0.003      -.0095179    -.002241
    lab1 |   .1156293   .0270923      4.268   0.000       .0602194    .1710393
    pos1 |   .5358824   .0500467     10.708   0.000       .4335254    .6382394
    mth1 |   .0399334   .0219769      1.817   0.080      -.0050144    .0848812
------------------------------------------------------------------------------
Continuing on Table 14.1, page 380: EGLS(2).
regress fth1  cons  fer1  lab1  pos1 mth1 in 2/l, noco

  Source |       SS       df       MS                  Number of obs =      33
---------+------------------------------               F(  5,    28) =  318.04
   Model |  22027.4862     5  4405.49724               Prob > F      =  0.0000
Residual |  387.855476    28  13.8519813               R-squared     =  0.9827
---------+------------------------------               Adj R-squared =  0.9796
   Total |  22415.3417    33  679.252779               Root MSE      =  3.7218

------------------------------------------------------------------------------
    fth1 |      Coef.   Std. Err.       t     P>|t|       [95% Conf. Interval]
---------+--------------------------------------------------------------------
    cons |  -5.518543   11.73656     -0.470   0.642       -29.5598    18.52272
    fer1 |  -.0060796   .0018941     -3.210   0.003      -.0099596   -.0021996
    lab1 |   .1136506   .0280815      4.047   0.000       .0561283     .171173
    pos1 |   .5342096    .051043     10.466   0.000       .4296526    .6387665
    mth1 |   .0407056   .0224247      1.815   0.080      -.0052293    .0866404
------------------------------------------------------------------------------
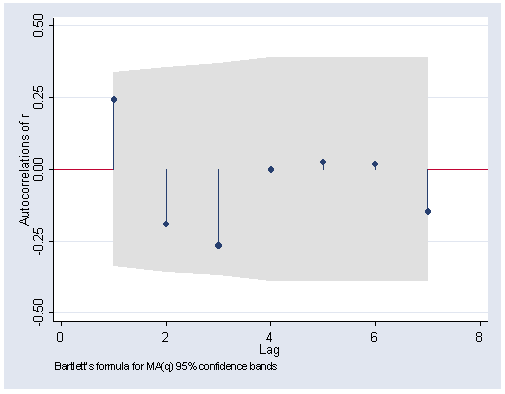
Figure 14.5 on page 382. The ac command produces a correlogram (the autocorrelations) with pointwise confidence intervals obtained from the Q statistic.
ac r, lags(7) yline(0) ylabel(-.5(.25).5)
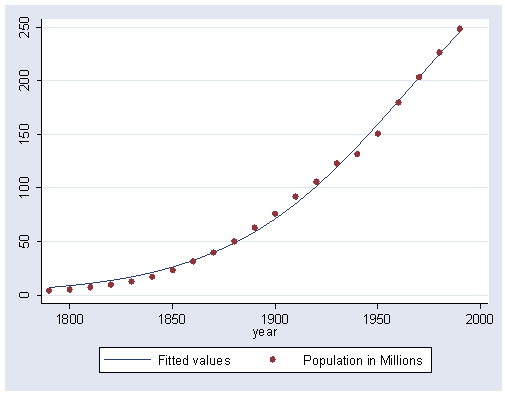
Figure 14.9 on page 400 using data file US-pop.
use https://stats.idre.ucla.edu/stat/stata/examples/ara/US-pop, clear
(From Fox, Applied Regression Analysis.  Use 'notes' command for source of data )

gen myear=year-1790
nl log3 pop myear, init(b1=350, b2=0.3, b3=15) /*nonlinear least squares using built-in model log3*/

(obs = 21)
Iteration 0:  residual SS =   1312135
Iteration 1:  residual SS =  100157.2
Iteration 2:  residual SS =   88085.9

...more iterations in between....

Iteration 26:  residual SS =     356.4
Iteration 27:  residual SS =     356.4

  Source |       SS       df       MS                Number of obs =        21
---------+------------------------------             F(  3,    18) =   4664.56
   Model |  277074.795     3  92358.2651             Prob > F      =    0.0000
Residual |  356.399974    18  19.7999986             R-squared     =    0.9987
---------+------------------------------             Adj R-squared =    0.9985
   Total |  277431.195    21  13211.0093             Root MSE      =  4.449719
                                                     Res. dev.     =  119.0576
3-parameter logistic function, pop=b1/(1+exp(-b2*(myear-b3)))
------------------------------------------------------------------------------
     pop |      Coef.   Std. Err.       t     P>|t|       [95% Conf. Interval]
---------+--------------------------------------------------------------------
      b1 |   389.1659    30.8114     12.631   0.000       324.4335    453.8982
      b2 |    .022662   .0010857     20.873   0.000        .020381    .0249429
      b3 |   176.0811   7.244577     24.305   0.000       160.8608    191.3014
------------------------------------------------------------------------------
 (SE's, P values, CI's, and correlations are asymptotic approximations)

predict mpop if e(sample)
(option yhat assumed; fitted values)

graph twoway scatter mpop pop year, connect(l i) msymbol(i O)
predict res, r
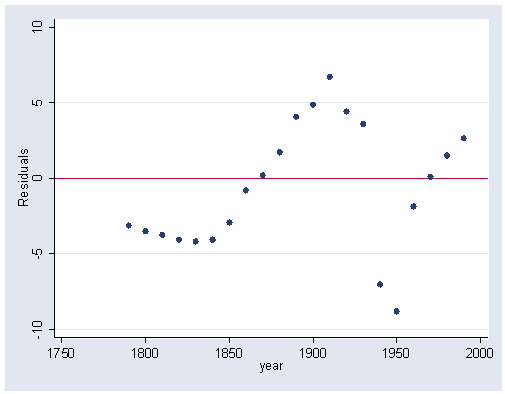
graph twoway scatter r year, yline(0) xlabel(1750(50)2000)
Table 14.8 on page 414 using the data file duncan.
use https://stats.idre.ucla.edu/stat/stata/examples/ara/duncan, clear
(From Fox, Applied Regression Analysis.  Use 'notes' command for source of data )
Estimator: least squares.
regress  prestige income educ

  Source |       SS       df       MS                  Number of obs =      45
---------+------------------------------               F(  2,    42) =  101.22
   Model |  36180.9458     2  18090.4729               Prob > F      =  0.0000
Residual |  7506.69865    42   178.73092               R-squared     =  0.8282
---------+------------------------------               Adj R-squared =  0.8200
   Total |  43687.6444    44   992.90101               Root MSE      =  13.369

------------------------------------------------------------------------------
prestige |      Coef.   Std. Err.       t     P>|t|       [95% Conf. Interval]
---------+--------------------------------------------------------------------
  income |   .5987328   .1196673      5.003   0.000       .3572343    .8402313
    educ |   .5458339   .0982526      5.555   0.000       .3475521    .7441158
   _cons |  -6.064663   4.271941     -1.420   0.163      -14.68579    2.556463
------------------------------------------------------------------------------
Estimator: least square*.
regress prestige income educ if(occtitle !="minister" & occtitle !="railroad_conductor")

  Source |       SS       df       MS                  Number of obs =      43
---------+------------------------------               F(  2,    40) =  141.26
   Model |  36815.4292     2  18407.7146               Prob > F      =  0.0000
Residual |  5212.57076    40  130.314269               R-squared     =  0.8760
---------+------------------------------               Adj R-squared =  0.8698
   Total |    42028.00    42  1000.66667               Root MSE      =  11.416

------------------------------------------------------------------------------
prestige |      Coef.   Std. Err.       t     P>|t|       [95% Conf. Interval]
---------+--------------------------------------------------------------------
  income |   .8673986   .1219756      7.111   0.000       .6208767     1.11392
    educ |   .3322408   .0987498      3.364   0.002       .1326599    .5318217
   _cons |  -6.408986   3.652627     -1.755   0.087      -13.79122    .9732494
------------------------------------------------------------------------------
Estimator: least absolute values.
qreg prestige income educ

Iteration  1:  WLS sum of weighted deviations =  435.45438

Iteration  1: sum of abs. weighted deviations =  448.85635
Iteration  2: sum of abs. weighted deviations =  420.65054
Iteration  3: sum of abs. weighted deviations =   420.1346
Iteration  4: sum of abs. weighted deviations =  416.71435
Iteration  5: sum of abs. weighted deviations =  415.99351
Iteration  6: sum of abs. weighted deviations =  415.97706

Median regression                                    Number of obs =        45
  Raw sum of deviations     1249 (about 41)
  Min sum of deviations 415.9771                     Pseudo R2     =    0.6670

------------------------------------------------------------------------------
prestige |      Coef.   Std. Err.       t     P>|t|       [95% Conf. Interval]
---------+--------------------------------------------------------------------
  income |   .7477064   .1016554      7.355   0.000       .5425576    .9528553
    educ |   .4587156   .0852699      5.380   0.000       .2866339    .6307972
   _cons |  -6.408257   4.068319     -1.575   0.123      -14.61846    1.801944
------------------------------------------------------------------------------
Estimator: Bisquare(biweight)
rreg prestige income educ, tolerance(0.0005)

   Huber iteration 1:  maximum difference in weights = .6047203
..more iterations...
   Huber iteration 6:  maximum difference in weights = .001508
   Biweight iteration 7:  maximum difference in weights = .28607984
..more iterations...
   Biweight iteration 16:  maximum difference in weights = .00046242

Robust regression estimates                            Number of obs =      45
                                                       F(  2,    42) =  141.84
                                                       Prob > F      =  0.0000

------------------------------------------------------------------------------
prestige |      Coef.   Std. Err.       t     P>|t|       [95% Conf. Interval]
---------+--------------------------------------------------------------------
  income |   .8183817   .1053366      7.769   0.000       .6058039     1.03096
    educ |   .4039986   .0864864      4.671   0.000        .229462    .5785352
   _cons |  -7.480399   3.760355     -1.989   0.053       -15.0691    .1083048
------------------------------------------------------------------------------
Estimator: Huber
We modified the rreg.ado file so it also displays the result from Huber estimation iterations. We call it https://stats.idre.ucla.edu/wp-content/uploads/2016/02/rregh.ado for Huber estimate.
rregh prestige income educ, tolerance(0.0005)
   Huber iteration 1:  maximum difference in weights = .6047203
   Huber iteration 2:  maximum difference in weights = .16902569
   Huber iteration 3:  maximum difference in weights = .04468015
   Huber iteration 4:  maximum difference in weights = .01946043
   Huber iteration 5:  maximum difference in weights = .00284761
   Huber iteration 6:  maximum difference in weights = .001508
   Huber iteration 7:  maximum difference in weights = .00041577
------------------------------------------------------------------------------
    prestige |      Coef.   Std. Err.      t    P>|t|     [95% Conf. Interval]
-------------+----------------------------------------------------------------
      income |   .7101061   .1021612     6.95   0.000     .5039364    .9162758
        educ |     .48201   .0836081     5.77   0.000      .313282     .650738
       _cons |  -7.283356    3.32942    -2.19   0.034     -14.0024   -.5643149
------------------------------------------------------------------------------
Biweight iteration 8:  maximum difference in weights = .28604323
Biweight iteration 9:  maximum difference in weights = .09851044
Biweight iteration 10:  maximum difference in weights = .15075821
Biweight iteration 11:  maximum difference in weights = .07122389
Biweight iteration 12:  maximum difference in weights = .02099558
Biweight iteration 13:  maximum difference in weights = .01118912
Biweight iteration 14:  maximum difference in weights = .00423083
Biweight iteration 15:  maximum difference in weights = .00229196
Biweight iteration 16:  maximum difference in weights = .00086014
Biweight iteration 17:  maximum difference in weights = .00046868
Robust regression                                      Number of obs =      45
                                                       F(  2,    42) =  141.84
                                                       Prob > F      =  0.0000
------------------------------------------------------------------------------
    prestige |      Coef.   Std. Err.      t    P>|t|     [95% Conf. Interval]
-------------+----------------------------------------------------------------
      income |   .8183817   .1053366     7.77   0.000     .6058038     1.03096
        educ |   .4039985   .0864864     4.67   0.000     .2294619    .5785352
       _cons |  -7.480396   3.760356    -1.99   0.053     -15.0691    .1083092
------------------------------------------------------------------------------
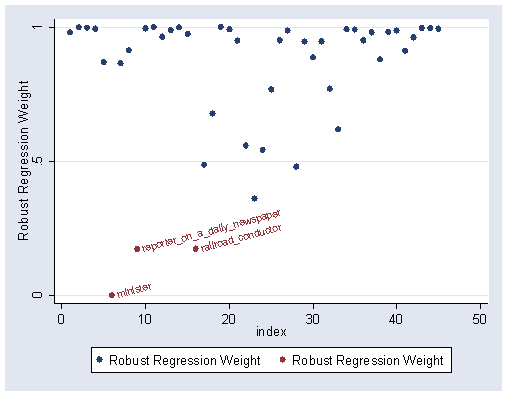
Figure 14.14 on page 415 on final weights for the bisquare estimator.
rreg prestige income educ, tolerance(.0005) genwt(mywt) /*generating weights
(intermediate output omitted here.)

gen index=_n
graph twoway (scatter mywt index) ///
	(scatter mywt index if mywt <= .25, mlabel(occtitle) mlabangle(15)), ylabel(0 .5 1)
Figure 14.15 on page 418 using the data file prestige.
use https://stats.idre.ucla.edu/stat/stata/examples/ara/prestige, clear
(From Fox, Applied Regression Analysis.  Use 'notes' command for source of data)

sort income
gen neb = abs(income-income[80]) /*get obs close to income[80]*/
sort neb
gen mpr =prestige in 1/40
(62 missing values generated)

gen minc= income in 1/40 /*get x-coordinate for reference line */
(62 missing values generated)

display minc[1]
8403

display minc[40]
5902
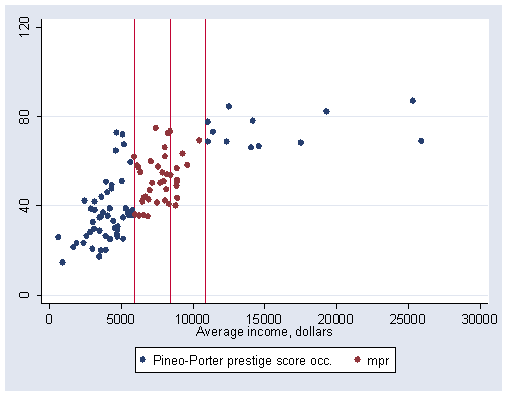
Figure 14.15 (a) on page 418 using symmetric neighborhood. For example, to get the upper bound we do (8403+(8403-5902))=10904.
graph twoway (scatter prestige income) (scatter mpr income), ///
	xline(5902 8403 10904) xlabel(0(5000)30000) ylabel(0(40)120)
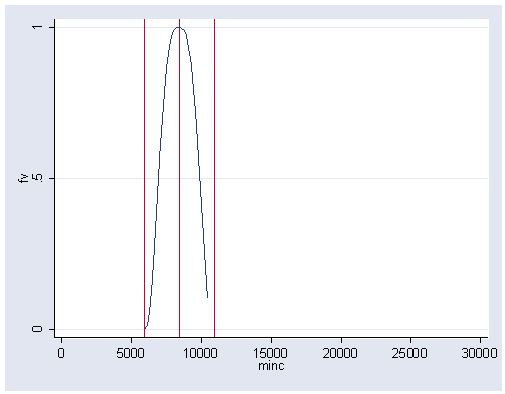
Figure 14.15 (b) on page 418 using tricube weight function.
gen stinc=abs(minc-8403)/2501
(62 missing values generated)

gen fv=(1-abs(stinc)^3)^3
(62 missing values generated)

replace fv=0 if (fv<0)
(0 real changes made)

sort minc
graph twoway scatter fv minc, connect(l) msymbol(i) ///
	xline(5902 8403 10904) xlabel(0(5000)30000) ylabel(0 .5 1)
Figure 14.15 (c) on page 418 showing local weighted regression.
regress prestige minc
(output omitted here.)

matrix list e(b)

e(b)[1,2]
         minc      _cons
y1  .00343774    25.4807

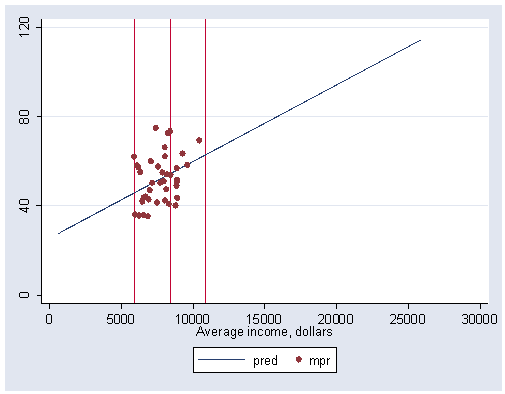
gen pred=25.4807+.00343774 *income
graph twoway scatter pred mpr income, connect(l) msymbol(i O) ///
	xline(5902 8403 10904) xlabel(0(5000)30000) ylabel(0(40)120)
Figure 14.15 (d) on page 418 on lowess smoothing.
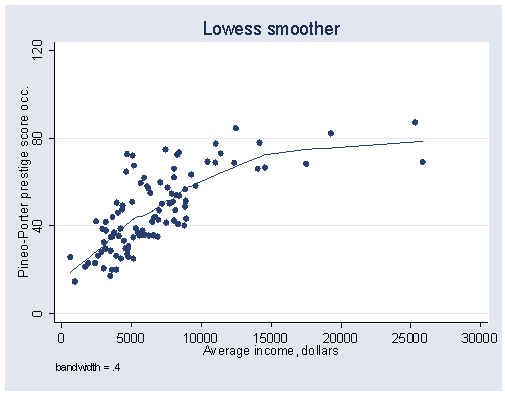
lowess prestige income, bwidth(0.4) xlabel(0(5000)30000) ylabel(0(40)120)
Figure 14.16 on page 421.
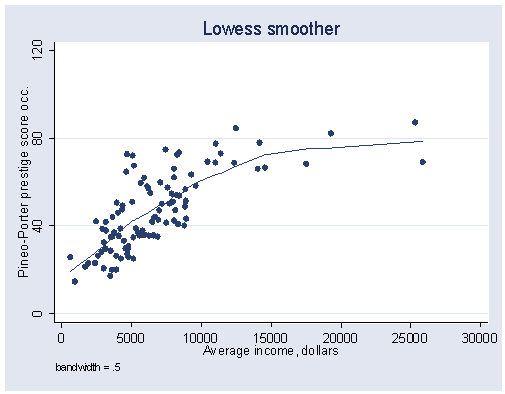
lowess prestige income, bwidth(0.5) xlabel(0(5000)30000) ylabel(0(40)120) gen(newp)
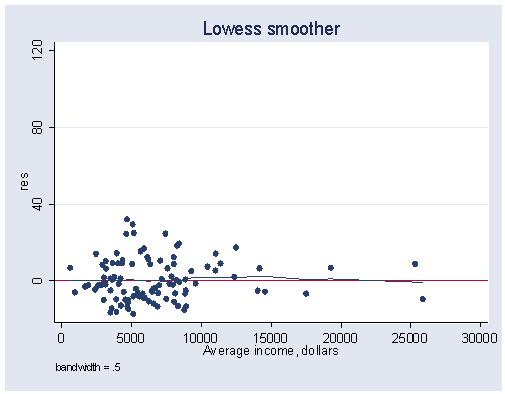
gen res=prestige-newp
lowess res income, bwidth(0.5) xlabel(0(5000)30000) ylabel(0(40)120) yline(0)
For calculation on page 423 and Figure 14.17 on page 424, please see the SAS version of this page. SAS does it simply with proc loess.

